S E Biotechnol. Agron. Soc. Environ. 2011 15(1), 75-84
Discrimination of Corsican honey by FT-Raman
spectroscopy and chemometrics
Juan Antonio Fernández Pierna, Ouissam Abbas, Pierre Dardenne, Vincent Baeten
Walloon Agricultural Research Centre (CRA-W). Valorisation of Agricultural Products Department. Chaussée de Namur, 24. B-5030 Gembloux (Belgium). E-mail: [email protected]
Received on February 4, 2010; accepted on August 24, 2010.
Honey is a complex and challenging product to analyze due mainly to its composition consisting on various botanical sources. The discrimination of the origin of honey is of prime importance in order to reinforce the consumer trust in this typical food product. But this is not an easy task as usually no single chemical or physical parameter is suficient. The aim of our paper is to investigate whether FT-Raman spectroscopy as spectroscopic ingerprint technique combined with some chemometric tools can be used as a rapid and reliable method for the discrimination of honey according to their source. In addition to that, different chemometric models are constructed in order to discriminate between Corsican honeys and honey coming from other regions in France, Italy, Austria, Germany and Ireland based on their FT-Raman spectra. These regions show a large variation in their plants. The developed models include the use of exploratory techniques as the Fisher criterion for wavenumber selection and supervised methods as Partial Least Squares-Discriminant Analysis (PLS-DA) or Support Vector Machines (SVM). All these models showed a correct classiication ratio between 85% and 90% of average showing that Raman spectroscopy combined to chemometric treatments is a promising way for rapid and non-expensive discrimination of honey according to their origin. Keywords. Discrimination, FT-Raman, typical food product, honey, chemometrics, SVM, PLS-DA.
Discrimination du miel de Corse par spectroscopie FT-Raman et chimiométrie. Le miel est un produit complexe à analyser, principalement du fait de sa composition basée sur diverses origines botaniques. La discrimination basée sur l’origine du miel est d’une très grande importance pour renforcer la coniance du consommateur pour ce produit alimentaire typique. Mais ce n’est pas une tâche facile parce qu’en général, un seul paramètre chimique ou physique n’est pas sufisant. L’objectif de cet article est d’investiguer si la spectroscopie FT Raman, comme technique de spectroscopie dite de ingerprinting, combinée à quelques outils de chimiométrie peut être utilisée comme une méthode rapide et iable pour la discrimination du miel en fonction de son origine. De plus, des modèles de chimiométrie sont construits pour discriminer le miel de Corse et le miel issu d’autres régions en France, Italie, Autriche, Allemagne et Irlande en se basant sur ses spectres de FT-Raman. Les modèles développés incluent l’emploi de techniques exploratoires comme le critère de Fisher pour la sélection de longueurs d’onde et des méthodes supervisées comme la Partial Least Squares-Discriminant Analysis (PLS-DA) ou Support Vector Machines (SVM). Tous ces modèles ont montré une proportion de classiication correcte entre 85 % et 90 % en moyenne, montrant que la spectroscopie Raman combinée aux traitements de chimiométrie est une manière prometteuse pour la discrimination rapide et peu couteuse du miel selon son origine.
Mots-clés. Discrimination, FT-Raman, produit alimentaire typique, miel, chimiométrie, SVM, PLS-DA.
1. InTRoDuCTIon
Honey is a natural biological product used as food and medicine since ancient times (Ransome, 2004). It is a complex and challenging product highly linked to the botanical sources it is made and by consequence to the production area. The different proportions of nectar incorporated in honey vary depending on the geographic zone, the vegetation type as well as the lowering period of the plants (Hewitson, 2009). This great variety of combinations of these criteria impacting
and variable composition, it became necessary to use global analytical approaches like ingerprinting and proiling methods. In recent years, characterization of honey has received an increased attention. Many works have been carried out in order to determine the composition of honey (Ha et al., 1998; de Oliveira et al., 2002), physical and chemical properties (Cho et al., 1998; Cozzolino et al., 2003), to detect and quantify honey adulteration with different kinds of syrups (i.e.
cane, beet or high-fructose syrups) (Paradkar et al., 2002; Downey et al., 2003; Kelly et al., 2006; Toher et al., 2007), to specify the main loral sources (Tewari et al., 2005; Bartelli et al., 2007) and to assess the authentication of uniloral or multiloral types of honey (Ruoff et al., 2006b; 2006c).
In recent years, coupling spectroscopic techniques and chemometric methods is one of the tools used and proposed for food origin discrimination (Baeten et al., 2008; Karoui et al., 2008; Manley et al., 2008). Many studies have been performed in order to assess the botanical origin of honey. It has to be mentioned the use of front-face luorescence spectroscopy coupled to Principal Component Analysis (PCA) and Linear Discriminant Analysis (LDA) (Ruoff et al., 2006a) or Factorial Discriminant Analysis (FDA) (Karoui et al., 2007); the application of mid infrared (Tewari et al., 2005; Ruoff et al., 2006c) and near infrared spectroscopy with PCA; Canonical Variate Analysis (CVA) (Davies et al., 2002) and discriminant methods like partial least squares discrimination and LDA (Corbella et al., 2005; Ruoff et al., 2006b); as well as the use of Dispersive Raman spectroscopy coupled with cluster analysis and artiicial neural networks (Goodacre et al., 2002). All these investigations concerned mainly the discrimination and classiication of honey in terms of the botanical origin and, only little study has been done to deine its geographical provenance. Davies et al. (2002) have mentioned that the distinction of honey samples in terms of their geographic regions is less obvious than that is for loral origins but it might be possible with large sample sets. Ruoff and his collaborators have shown that front-face luorescence (Ruoff et al., 2006a) and mid infrared (Ruoff et al., 2006c) spectroscopic techniques combined with chemometric treatments as PCA and LDA may be useful to determine the geographical origin within the same uniloral type. Recently, Donarski et al. (2008) have been working to characterize the resonance peaks relating to speciic biomarkers of botanical and geographical origin using linear discriminant analysis (LDA) and genetic programming (GP) techniques applied to one-dimensional proton nuclear magnetic resonance (1H NMR) spectroscopic data. The potential
of near-infrared (NIR) spectroscopy to determine the geographical origin of honey samples was evaluated by Woodcock et al. (2007; 2009) by using different
chemometric tools as SIMCA or PLS-DA giving encouraging results.
Raman spectroscopy, like mid infrared spectroscopy, probes molecular vibrations. However, the principle underpinning the phenomenon is rather different. Raman scattering arises from the changes in the polarisability or shape of the electron distribution in the molecule as it vibrates. In contrast, infrared absorption requires a change of the intrinsic dipole moment with the molecular vibration. Asymmetric vibrational modes and vibrations of polar groups are more likely to exhibit prominent infrared absorption, while symmetric vibrational modes generally give rise to strong Raman scattering. Although, the mechanism of Raman scattering is different from that of infrared absorption, Raman and infrared spectra provide complementary information about the vibrations of molecules and in consequence about the functional groups that constitute the product (Yang et al., 2005). Typical applications of this technique are in structure determination, multicomponent qualitative and quantitative analysis. FT-Raman spectroscopy is, among other recent analytical techniques, more and more used for the assessment of the authenticity of food products like edible oils and fats (Baeten et al., 1996; 1998; 2000a; 2000b; 2005; Kizil et al., 2008). The increasing use of Raman technique in the food area is due to the recent advances in instrument technology (Duda et al., 1973; Baeten et al., 2002; Yang et al., 2005) like the interferometer methodology that leads to FT-Raman spectrometer type and which makes it possible to monitor many wavenumbers simultaneously. Doing so, the total optical signal reaching the detector may be increased above detector noise. An important advantage of the technique is new sampling presentation which permits to examine samples without any preparation in the whole range of physical states and inside classical glass vials. Major advantages of FT-Raman spectroscopy comprise also its simplicity, rapidity, cost-effective, and non-destructive characteristics.
This paper aims to present the potential of FT- Raman spectroscopy combined to chemometric tools as Partial Least Squares-Discriminant Analysis (PLS-DA) and Support Vector Machines (SVM) to develop a method suitable for the discrimination of honey from different origins. The quality of Corsica honey is recognized by a DO (Denomination of Origin). This DO authenticates the knowledge to make ancestral and speciicities of a honey which beneits from the richness of the Corsica lora.
Quality and Safety Priority. The objective is to develop traceability methods and systems that will provide consumers with added conidence in the authenticity of European food. Honey is one of the focused foods that we have investigated to develop methodologies based on spectroscopic ingerprint techniques for the assessment of European geographic origin of food.
2. TheoRy
2.1. FT-Raman analysis
FT-Raman spectra were acquired on a Vertex 70 – RAM II Bruker FT-Raman spectrometer. This instrument is equipped with a Nd:YAG laser (yttrium aluminium garnet crystal doped with triply ionised neodymium) with an output at 1,064 nm (9,398.5 cm-1). The
maximum of laser power is 1.5 W. The measurement accessory is pre-aligned, only the Z-axis of the scattered light is adjusted to set the sample in the appropriate position regarding the local point. The RAM II spectrometer is equipped with a liquid-nitrogen cooled Ge detector. The OPUS 6.0 software was used for the spectral acquisition, manipulation and transformation.
Samples were presented in the liquid form to the spectrometer in classical glass tubes of an internal diameter of 12 mm and a length of 75 mm (Schott Duran®). Tubes were introduced into a dedicated sample holder developed at the CRA-W and made of aluminium to assure repeatable position of the sample in front of the laser beam. The sample holder was placed in the sample compartment. The laser power was set at 800 mW, the resolution at 4 cm-1 and the
number of co-added scans at 128 for each spectrum. Each spectrum is then collected in 4 min. Analyses were performed in duplicate.
2.2. Chemometric analysis
Different chemometric methods have been applied in order to extract the maximum of information in the honey data. In a irst step a simple exploratory analysis has been performed: the Fisher criterion. This method has been used in order to decide which original variables have an important discriminating power according to the origin (Corsican/non-Corsican). Fisher describes the ratio of the between-class variance and the within-class variance.
For each variable (scattering intensity) j:
FCj= Hj / Ej
k
where Hj = ∑ ni(xij-x.j)2 is the between-class variance
i = 1
K
and Ej = ∑ (ni-1)s2
ijis the within-class variance, where i = 1
ni is the number of objects in class i, xij is the mean scattering intensity of the objects belonging to class i at the j-th wavenumber, x.j is the mean scattering intensity of the objects belonging to all classes at the
j-th wavenumber and sij is the standard deviation of the scattering intensities of the objects belonging to class i at the j-th wavenumber (Massart et al., 1988).
In a second step, different chemometric discriminant supervised algorithms to predict the origin of a honey sample are applied during this study: Partial Least Squares-Discriminant Analysis (PLS-DA) and Support Vector Machines (SVM). PLS-DA and SVM algorithms have been described elsewhere (Fernández Pierna et al., 2004).
3. MaTeRIals anD MeThoDs
3.1. samples
honey samples. Different honey samples have been received from a number of countries located in the Mediterranean region and from two different harvest years (2006 and 2007). The aim of this work was to study the potential of ingerprinting and proiling to discriminate Corsican samples from other geographical origins (i.e. France, Italy, Austria, Germany and Ireland). A total of 182 and 192 samples have been selected respectively for the irst and second year. Table 1 presents a summary of the samples used in this study. As indicated in the table, most of the samples have been taken from the island of Corsica in order to cover as much as possible the natural composition. The data set include a total of 374 samples, from which 219 and 155 samples are coming respectively from Corsican and non-Corsican origin. For the Corsican samples, products from spring, autumn and non-speciied origin as well as from various botanical origins, maquis, bushes, sweet chesnut, strawberry-tree and Clémentinier (Citrus reticulata), are included in the set. Each honey sample was diluted with distilled water in order to get a BRIX value of to 70°.
3.2. Chemometrics
Based on the results obtained in the exploratory analysis (Fisher criterion), two different chemometric models to predict the origin of a honey sample as either Corsican or non-Corsican were generated using PLS-DA and SVM. The study includes:
– Construction of individual models (PLS-DA and SVM) for each year. For these models, the validation procedure used is the leave-one-out cross-validation; – Construction of global models (PLS-DA and SVM) using both years together using the data randomly split into training (274 samples) and test (100 samples). All models were generated using only the training set and validated with the test set; – Construction of global models (PLS-DA and SVM) using both years together based on the wavenumbers selected by the Fisher criterion and using the data split into training and test as in the previous case.
In all the models Multiplicative Scatter Correction (MSC) has been applied as pre-processing technique. MSC corrects spectra for spectral noise and background effects which cause baseline shifting and tilting. Once the models have been constructed they have been validated in order to estimate their performance. In the case of classiication learning, these are expressed as the misclassiication rate as well as the sensitivity and the speciicity. The sensitivity is deined as the proportion of actual positives which are correctly identiied as such, and the speciicity measures the proportion of negatives which are correctly identiied as such.
3.3. software
All computations, chemometric analyses and graphics were carried out with programs developed in Matlab v.7.0. (The Mathworks, Inc., Natick, MA, USA).
4. ResulTs anD DIsCussIon
FT-Raman spectrum of honey (Figure 1) has a large band in the vicinity of 3,234 cm-1 characteristic of
O-H group stretching vibrations, intense peaks centred around 2,941 and 2,904 cm-1 corresponding to C-H
stretching vibrations and several sharp peaks in the 200-1,500 cm-1 region (also called the ingerprinting
region) characteristic of several chemical groups. Honey Raman spectrum is considered as a combination of absorption due to different compounds (Paradkar et al., 2002; Batsoulis et al., 2005); the major compounds are carbohydrates. Honey contains small amounts of proteins, amino acids and organic acids but also vitamins and minerals at very low level (Arvanitoyannis et al., 2005). The comparison of two honey FT-Raman spectra (Corsican and non-Corsican) with a spectrum of a mixture of sugar shows a good similarity (Figure 1). The mixture is composed from the major sugar specimens, fructose and glucose, and the most common disaccharide, sucrose, present in honey.
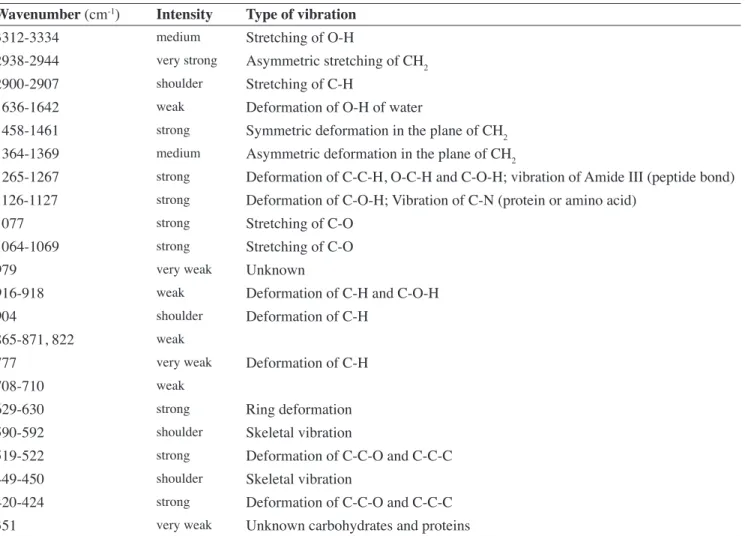
The main vibrational bands of FT-Raman spectra presented in igure 1 and their respective assignments, according to the literature (Paradkar et al., 2002; de Oliveira et al., 2002; Fernández Pierna et al., 2005), are listed in table 2.
On the basis of FT-Raman band assignments (Table 2), it can be seen that the chemical information in a honey FT-Raman spectrum is mainly due to the saccharides. Their speciic bands centered in the vicinity of 3,319 and 3,234 cm-1 correspond to O-H
stretching vibration mode, in the vicinity of 2,941 and 2,904 cm-1 are associated to C-H stretching vibration
and in the vicinity of 1,642 cm-1 are characteristic of
O-H deformation vibration. In the ingerprinting region it can be observed the scattering bands attributed to CH2 group deformation vibration in the vicinity of 1,460 and 1,367 cm-1, the deformation vibration
of C-C-H, O-C-H, and C-O-H in the vicinity of 1,266 cm-1, the C-O-H group deformation vibration
in the vicinity of 1,126 cm-1, the stretching vibration
of C-O in the vicinity of 1,077 and 1,064 cm-1, the
deformation vibration modes of C-H and C-O-H in the vicinity of 916 cm-1 and ring deformation vibration in
the vicinity of 630 cm-1. Scattering bands observed in
the 200 and 600 cm-1 region are attributed mainly the
skeletal vibrational motions with major contributions from the deformation modes of C-C-C, C-C-O, C-C, and C-O groups of saccharides (de Oliveira et al.,
Table 1. Characteristics of the samples analysed — Caractéristiques des échantillons analysés.
Country year number of samples
France (Corsica) 2006 111 2007 108 France (other than Corsica) 2006 18 2007 28
Italy 2006 15
2007 15
Austria 2006 18
2007 23
Ireland 2006 2
2007 0
Germany 2006 18
2007 18
ToTal 2006 182
2002). It is important to notice that by the application of Raman spectroscopy, the other constituents of honey like unknown carbohydrates, proteins, amino acids or organic acids may exhibit intensities with minor contribution in the vicinity of speciic wavenumbers (351; 424; 1,077; 1,126; 1,266 and 1,460 cm-1).
In order to distinguish the individual contribution of the fructose, glucose, and sucrose in a honey spectrum, we have collected their FT-Raman spectra (Figure 2). The so-called ingerprint region (200 and 1,500 cm-1) is
shown. Matching peaks obtained for honey and sugars mixture with those of spectra of fructose, glucose and sucrose permit to attribute most of the scattering bands of honey to the scattering bands of the individual carbohydrates. FT-Raman bands in the vicinity of 1,064; 1,266; 1,367 and 1,460 cm-1 are found in the spectra
of all studied sugar specimens; the scattering bands in the vicinity of 708 and 424 cm-1 are associated to both
fructose and glucose. Scattering band in the vicinity of 519 cm-1 may be attributed to fructose and sucrose, but
due to the relative scattering band intensities and the weak concentration of sucrose in honey, this band can be mainly attributed to the fructose. Other scattering bands can be associated to fructose in the vicinity of 979, 865, 822, and 630 cm-1 while scattering bands of
glucose can be observed in the vicinity of 1,126; 916; 777 and 351 cm-1.
4.1. exploratory analysis
The use of PCA is a normal procedure when working with spectroscopic data. Here PCA did not show clear pattern concerning the different groups or clear outliers. However, the Fisher criterion showed more interesting results because it allows selecting original variables having an important discriminating power according to the origin (Corsican/non-Corsican). These variables are indicated in igure 3. One of our main aims is to relate the spectroscopic information to the chemical one, and this is easier by using Fisher than PCA. The Fisher criterion was used to select original variables having an important discriminating power according to the origin (Corsican/non-Corsican). As previously explained, the idea is to maximize the Fisher (F) ratio (ratio of between-group to within-group variance) for the dataset. As result 15 variables are important as indicated in igure 3.
Comparing the frequencies of the maximum values of the Fisher plot with those of the honey sample spectrum, a high similarity between both can be observed. This is explained by the fact that the scattering bands of sugars and unknown carbohydrates and proteins contribute to the discrimination between the two groups of honeys. In fact, the assignments of scattering bands of the Fisher plot according to table 2 Figure 1. Example of sugar mixture, Corsican and non-Corsican honey FT-Raman spectra — Exemple de spectres FT-Raman de mélange de sucre, de miels de Corse et de miels non originaires de Corse.
Corsican honey
Non-Corsican honey
Sugars mixture
Wavenumber (cm-1)
Raman intensity
0.12 0.10 0.08 0.06 0.04 0.02 0 0.12 0.10 0.08 0.06 0.04 0.02 0
0.12 0.10 0.08 0.06 0.04 0.02 0
conirm the role played by these components in the discrimination of honey samples according to the origin.
4.2. supervised analysis
Different models between Corsican samples and the rest (including all the other French honeys, Italian, Austrian, German and Irish honeys) have been constructed using PLS-DA and SVM:
– discriminating models for each year individually; – discriminating models including samples of both years;
– discriminating models using only the 15 variables selected by the Fisher criterion.
In all cases the results are shown in tables where the success rates obtained for the training and test sets are summarized. For the individual models, it concerns the confusion matrix for the Corsica vs the rest model applied to the training set and using leave-one-out cross validation (LOOCV). For the global models, it corresponds to the confusion matrix for the training set
and the independent test set. In both tables the results are expressed as the percentage of correctly classiied samples as well as the sensitivity and the speciicity (in %).
Table 3 shows the results for the individual models. For year 1 when the constructed PLS-DA model (9 factors) is applied to the training set, 100% of samples are correctly classiied; when performing LOOCV, 87.2% of Corsican samples are correctly classiied as Corsican and 91.5% of non-Corsican as non-Corsican. This drives to a sensitivity of 91.12% and a speciicity of 87.73%. For year 2 the values of 83.24% and 85.86% are obtained for the sensitivity and the speciicity respectively using PLS-DA (8 factors). SVM (C = 1000000, σ = 10) shows slightly larger values than PLS-DA, with a sensitivity of 91.31% and 83.64% and a speciicity of 88.67% and 86.69% for year 1 and year 2, respectively. For the individual models in general better results are obtained for year 1 than for year 2 in terms of sensitivity and speciicity and SVM shows only a small improvement compared to PLS-DA.
Table 2. Main scattering bands of honey and their respective assignments — Bandes importantes du miel et leurs affectations. Wavenumber (cm-1) Intensity Type of vibration
3312-3334 medium Stretching of O-H
2938-2944 very strong Asymmetric stretching of CH2
2900-2907 shoulder Stretching of C-H
1636-1642 weak Deformation of O-H of water
1458-1461 strong Symmetric deformation in the plane of CH2 1364-1369 medium Asymmetric deformation in the plane of CH2
1265-1267 strong Deformation of C-C-H, O-C-H and C-O-H; vibration of Amide III (peptide bond) 1126-1127 strong Deformation of C-O-H; Vibration of C-N (protein or amino acid)
1077 strong Stretching of C-O
1064-1069 strong Stretching of C-O
979 very weak Unknown
916-918 weak Deformation of C-H and C-O-H
904 shoulder Deformation of C-H
865-871, 822 weak
777 very weak Deformation of C-H
708-710 weak
629-630 strong Ring deformation
590-592 shoulder Skeletal vibration
519-522 strong Deformation of C-C-O and C-C-C 449-450 shoulder Skeletal vibration
420-424 strong Deformation of C-C-O and C-C-C
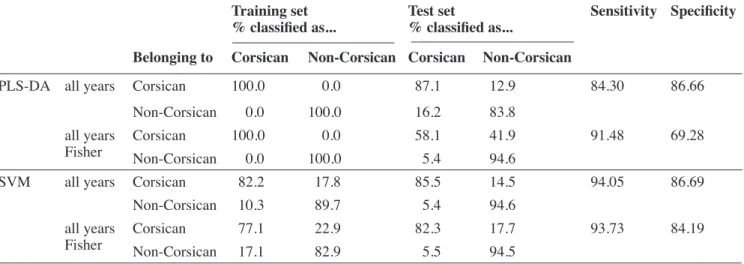
When global models are constructed the results improved mainly when working with SVM (Table 4). PLS-DA (8 factors) has a sensitivity of 84.30% when working with the whole spectra, whereas
SVM (C = 1000000, σ = 10) has a value of 94.05%. Concerning the speciicity similar values are obtained for both methods (86.66% for PLS-DA vs 86.69% for SVM). Working only with the 15 variables selected by the Fisher criterion gives good sensitivities (91.48% for PLS-DA and 94.05% for SVM), however a loss in speciicity (69.28% for PLS-DA and 84.19% for SVM) is obtained mainly when working with PLS-DA. It is important to remark, as it was already demonstrated by Fernández Pierna et al. (2005), that SVM outperforms PLS-DA and that SVM is able to work well even when the number of variables is very small.
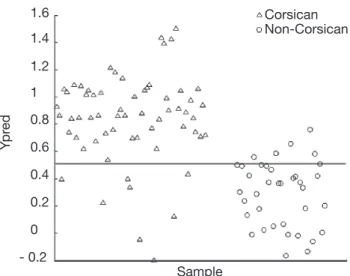
Figures 4 and 5 show the prediction results for the test set using the full PLS-DA and SVM models respectively. As it can be observed, when applying the PLS-DA model, 8 false negative results are found, i.e.
8 Corsican samples from the test set are misclassiied. The same false negative results are obtained when applying the SVM model (SVM misclassiies 9 Corsican samples). Moreover, when studying the misclassiied Corsican samples, it is interesting to note that the 8 false negative results detected by both methods belong to the group of spring samples. Similar results are observed when looking at the LOOCV results for the global model when using PLS-DA. In such a case, 29 false negative results have been obtained and 59% of them belong to the spring samples. The same
Figure 2. FT-Raman spectra of three sugars (fructose, glucose, and sucrose) — Spectres FT-Raman de trois sucres (fructose, glucose et sucrose).
Figure 3. Results of the Fisher criterion showing the most important variables for the discrimination — Résultats du test de Fisher montrant les variables les plus importantes responsables de la discrimination.
Wavenumber (cm-1)
Fisher criterion
6
5
4
3
2
1
0
3,500 3,000 2,500 2,000 1,500 1,000 500 x 104
Fructose
Glucose
Sucrose
Wavenumber (cm-1)
Raman intensity 0.080.07 0.06 0.05 0.04 0.03 0.02 0.01 0 0.08 0.07 0.06 0.05 0.04 0.03 0.02 0.01 0 0.08 0.07 0.06 0.05 0.04 0.03 0.02 0.01
false negative results are obtained when using LOOCV in the global SVM model.
5. ConClusIon
Several important and practical conclusions can be drawn from the investigation presented in this paper.
The recent advances in instrument technology make the FT-Raman a promising method to use in the food
area for authentication. FT-Raman, as well as infrared spectroscopy, provides complementary information about the vibrations of molecules and in consequence about the functional groups that constitute the product. Other important advantages of the technique are its simplicity, rapidity, cost-effective, and non-destructive characteristics. In this study, scattering FT-Raman bands have been selected and could be identiied as ingerprints of the major components in honey, i.e.
Table 3. Confusion matrix for the Partial Least Squares-Discriminant Analysis (PLS-DA) and Support Vector Machines (SVM) equations Corsican vs the rest using leave-one-out cross validation (LOOCV) for individual years — Matrice de confusion pour les équations Partial Least Squares-Discriminant Analysis (PLS-DA) et Support Vector Machines (SVM) (Corse vs le reste) en utilisant une cross validation leave-one-out (LOOCV) pour chaque année de collecte.
Training set
% classiied as... looCV% classiied as... sensitivity speciicity Belonging to Corsican non-Corsican Corsican non-Corsican
PLS-DA Year 1 Corsican 100.0 0.0 87.1 12.8 91.12 87.73
Non-Corsican 0.0 100.0 8.5 91.5
Year 2 Corsican 96.4 3.6 86.4 13.6 83.24 85.86
Non-Corsican 1.2 98.8 17.4 82.6
SVM Year 1 Corsican 99.1 0.9 88.3 11.7 91.31 88.67
Non-Corsican 0.0 100.0 8.4 91.6
Year 2 Corsican 100.0 0.0 87.3 12.7 83.64 86.69
Non-Corsican 0.0 100.0 17.1 82.9
Sensitivity = a/(a+c) where
Speciicity = d/(b+d) Corsican Corsican Non-Corsicana b
Non-Corsican c d
Table 4. Confusion matrix for the Partial Least Squares-Discriminant Analysis (PLS-DA) and Support Vector Machines (SVM) equations Corsican vs the rest using training and test set for both years’ samples before and after variable selection (Fisher) — Matrice de confusion pour les équations Partial Least Squares-Discriminant Analysis (PLS-DA) et Support Vector Machines (SVM) (Corse vs le reste) en utilisant un jeu de données de calibration et test comprenant l’ensemble des échantillons des deux années, avant et après la sélection des variables (Fisher).
Training set
% classiied as... Test set% classiied as... sensitivity speciicity Belonging to Corsican non-Corsican Corsican non-Corsican
PLS-DA all years Corsican 100.0 0.0 87.1 12.9 84.30 86.66
Non-Corsican 0.0 100.0 16.2 83.8
all years
Fisher CorsicanNon-Corsican 100.00.0 100.00.0 58.15.4 41.994.6 91.48 69.28
SVM all years Corsican 82.2 17.8 85.5 14.5 94.05 86.69
Non-Corsican 10.3 89.7 5.4 94.6
all years
fructose, glucose and sucrose. Some other bands have been associated to other minor components as unknown carbohydrates and proteins.
The use of exploratory techniques as the Fisher criterion for wavenumber selection and supervised methods as PLS-DA or SVM seems to be a promising way, when working with FT-Raman data, for a rapid and non-expensive discrimination of Corsican honey from other honey samples. All the studied models showed a correct classiication ratio between 85% and 90% of average, showing a clear advantage for the SVM method specially when working with a reduced number of variables.
acknowledgements
We thank the European Commission, through the 6th
Framework Programme under the Food Quality and Safety Priority as part of the TRACE project (Integrated Project 006942 – TRACE) (www.trace.eu.org) for funding part of this work, Bruker Optics for the instrumentation and Emma Mukandoli from the CRA-W for the analyses.
The information contained in this article relect the authors’ views; the European Commission is not liable for any use of the information contained therein.
Bibliography
Arvanitoyannis I.S. et al., 2005. Novel quality control methods in conjunction with chemometrics (multivariate analysis) for detecting honey authenticity. Crit. Rev. Food Sci. Nutr., 45, 193-203.
Baeten V., Meurens M., Morales M.T. & Aparicio R., 1996. Detection of virgin olive oil adulteration by Fourier transform Raman spectroscopy. J. Agric. Food Chem., 44(8), 2225.
Baeten V., Hourant P., Morales M.T. & Aparicio R., 1998. Oils and fats classiication by FT-Raman spectroscopy. J. Agric. Food Chem., 46, 2638.
Baeten V. & Aparicio R., 2000a. Edible oils and fats authentication by Fourier transform Raman spectrometry. Biotechnol. Agron. Soc. Environ., 4(4), 196.
Baeten V., Aparicio Ruiz R., Niusa M. & Wilson R., 2000b. In: Aparicio R. & Harwood J., eds. Handbook of olive oil, analysis and properties. Gaithersburg, MA, USA: An Aspen Publication, 209-248.
Baeten V. & Dardenne P., 2002. Spectroscopy: developments in instrumentation and analysis. Grasas Aceites, 53(1), 45.
Baeten V. et al., 2005. Detection of the presence of hazelnut oil in olive oil by FT-Raman and FT-MIR spectroscopy. J. Agric. Food Chem., 53(16), 6201.
Baeten V. et al., 2008. Spectroscopic techniques: Fourier Transform (FT) Near Infrared spectroscopy (NIR) and microscopy (NIRM). In: Da-Wen Sun, ed. Modern techniques for food authentication. Oxford, UK: Academic Press, 117-148.
Bartelli D. et al., 2007. Classiication of Italian honeys by mid-infrared diffuse relectance spectroscopy (DRIFTS). Food Chem., 101, 1565.
Batsoulis A.N. et al., 2005. FT-Raman spectroscopic simultaneous determination of fructose and glucose in honey. J. Agric. Food Chem., 53, 207.
Cho H.J. & Hong S.H., 1998. Acacia honey quality measurement by near-infrared spectroscopy. J. Near Infrared Spectrosc., 6, A329.
Corbella E. & Cozzolino D., 2005. The use of visible and near infrared spectroscopy to classify the loral origin of honey samples produced in Uruguay. J. Near Infrared Spectrosc., 13, 63.
Sample
Ypr
ed
Corsican Non-Corsican 1.6
1.4
1.2
1
0.8
0.6
0.4
0.2
0
- 0.2
Figure 4. Partial Least Squares-Discriminant Analysis (PLS-DA) prediction results for the test data set — Résultats de la prédiction Partial Least Squares-Discriminant Analysis (PLS-DA) pour le jeu de données de test.
Sample
Ypr
ed
Corsican Non-Corsican 3
2.5 2
1.5 1 0.5 0 - 0.5 - 1 - 1.5 - 2
Cozzolino D. & Corbella E., 2003. Determination of honey quality components by near infrared relectance spectroscopy. J. Apic. Res., 42(1-2), 16.
Davies A.M.C., Radovic B., Fearn T. & Anklam E., 2002. A preliminary study on the characterisation of honey by near infrared spectroscopy. J. Near Infrared Spectrosc., 10, 121.
de Oliveira L.F.C., Colombara R. & Edwards H.G.M., 2002. Fourier transform Raman spectroscopy of honey. Appl. Spectrosc., 56(3), 306.
Donarski J.A., Jones S.A. & Charlton A.J., 2008. Application of cryoprobe 1H nuclear magnetic resonance spectroscopy and multivariate analysis for the veriication of Corsican honey. J. Agric. Food Chem., 56(14), 5451.
Downey G., Fouratier V. & Kelly J.D., 2003. Detection of honey adulteration by addition of fructose and glucose using near infrared translectance spectroscopy. J. Near Infrared Spectrosc., 11, 447.
Duda R.O. & Hart P.E., 1973. Pattern classiication and scene analysis. New York, USA: John Wiley & Sons. Fernández Pierna J.A. et al., 2004. Combination of Support
Vector Machines (SVM) and Near Infrared (NIR) imaging spectroscopy for the detection of meat and bone meat (MBM) in compound feeds. J. Chemom., 18, 341. Fernández Pierna J.A. et al., 2005. Classiication of modiied
starches by FTIR spectroscopy using support vector machines. J. Agric. Food Chem., 53(17), 6581.
Goodacre R., Radovic B.S. & Anklam E., 2002. Progress toward the rapid nondestructive assessment of the loral origin of European honey using dispersive Raman spectroscopy. Appl. Spectrosc., 56(4), 521.
Ha J., Koo M. & Ok H., 1998. Determination of the constituents of honey by near-infrared spectroscopy. J. Near Infrared Spectrosc., 6, A367.
Hewitson J., 2009. Composition of honey, http://www-saps. plantsci.cam.ac.uk/records/rec336.htm, (29/01/10). Karoui R., Dufour E., Bosset J.O. & De Baerdemaeker J.,
2007. The use of front face luorescence spectroscopy to classify the botanical origin of honey samples produced in Switzerland. Food Chem., 101(1), 314.
Karoui R., Fernández Pierna J.A. & Dufour E., 2008. Spectroscopic techniques: Mid Infrared (MIR) and Fourier Transform Mid Infrared (FT-MIR) spectroscopies. In: Da-Wen Sun, ed. Modern techniques for food authentication. Oxford, UK: Academic Press, 27-64.
Kelly J.D., Petisco C. & Downey G., 2006. Application of Fourier Transform Mid Infrared Spectroscopy to the discrimination between Irish artisanal honey and such honey adulterated with various sugar syrups. J. Near Infrared Spectrosc., 14, 139.
Kizil R. & Irudayaraj J., 2008. Spectroscopic technique: Fourier Transform Raman (FT-Raman) Spectroscopy. In: Da-Wen Sun, ed. Modern techniques for food authentication. Oxford, UK: Academic Press, 185-200. Manley M., Downey G. & Baeten V., 2008. Spectroscopic
technique: Near Infrared (NIR) spectroscopy. In: Da-Wen Sun, ed. Modern techniques for food authentication. Oxford, UK: Academic Press, 65-116.
Massart D.L. et al., 1988. Chemometrics: a textbook. Vol. 2. Amsterdam, The Netherlands: Elsevier.
Paradkar M. & Irudayaraj J.M.K., 2002. Discrimination and classiication of beet and cane inverts in honey by FT-Raman spectroscopy. Food Chem., 76, 231.
Ransome H.M., 2004. The sacred bee in ancient times and folklore. London, UK: Courier Dover Publications, Dover Books on Anthropology and Folklore.
Ruoff K. et al., 2006a. Authentication of the botanical and geographical origin of honey by front-face luorescence spectroscopy. J. Agric. Food Chem., 54, 6858.
Ruoff K. et al., 2006b. Authentication of the botanical origin of honey by near-infrared spectroscopy. J. Agric. Food Chem., 54, 6867.
Ruoff K. et al., 2006c. Authentication of the botanical and geographical origin of honey by mid-infrared spectroscopy. J. Agric. Food Chem., 54, 6873.
Tewari J.C. & Irudayaraj J.M.K., 2005. Floral classiication of honey using mid-infrared spectroscopy. J. Agric. Food Chem., 53, 6955.
Toher D., Downey G. & Murphy T.B., 2007. A comparison of model-based and regression classiication techniques applied to near infrared spectroscopic data in food authentication studies. Chemom. Intell. Lab. Syst., 89(2), 102.
Twardowsky J. & Anzenbacher P., 1994. Raman and IR spectroscopy in biology and biochemistry. New York, USA: Ellis Horwood Limited.
Woodcock T., Downey G., Kelly J.D. & O’Donnell C., 2007. Geographical classiication of honey samples by near-infrared spectroscopy: a feasibility study. J. Agric. Food Chem., 55(22), 9128.
Woodcock T., Downey G. & O’Donnell C.P., 2009. Near infrared spectral ingerprinting for conirmation of claimed PDO provenance of honey. Food Chem., 114(2), 742.
Yang H., Irudayaraj J. & Paradkar M.M., 2005. Characterization of different edible oils and fats by FTIR, FT-NIR and FT-Raman Spectroscopy. Food Chem., 93(1), 25.