Article
0103 - 5053 $6.00+0.00
*e-mail: [email protected]
Determination of Viscosity and Solids in Pressure-Sensitive Adhesives by FTIR-ATR
and Multivariate Calibration
Joana G. de Aguiar, Alessandra Borinand Ronei J. Poppi*
Chemistry Institute, State University of Campinas, CP 6154, 13084-971 Campinas-SP, Brazil
Este trabalho apresenta o emprego da espectroscopia no infravermelho combinada com ferramentas quimiométricas para o controle de qualidade de adesivos. A partir de 105 espectros no infravermelho de amostras de adesivos de diferentes tipos de formulação empregou-se análise de componentes principais (PCA), sendo possível a separação das amostras em quatro diferentes grupos. A regressão por mínimos quadrados parciais (PLS) foi utilizada na quantiicação do teor de sólidos a partir de um conjunto de 28 amostras de adesivos com base aquosa. O PLS por intervalos (iPLS) foi usado na determinação de viscosidade a partir de um conjunto de 73 amostras de adesivos com base solvente, obtendo-se erros menores que 7% em ambos os casos. Dessa forma, os resultados indicam que o emprego de ATR-FTIR, aliada a quimiometria, é uma excelente alternativa para o controle de qualidade de uma indústria de adesivos.
This paper presents the application of infrared spectroscopy in conjunction with chemometric methods for quality control in adhesive manufacturing. From 105 infrared spectra of pressure-sensitive adhesive samples of different formulations, employing principal component analysis (PCA), it was possible the separation in four groups. By using partial least squares regression (PLS), the solid contents of 28 samples of water-based adhesive were determined. The interval-PLS (iinterval-PLS) was used for the determination of the viscosity of 73 solvent-based adhesive samples, with errors less than 7% in both cases. These results indicate the feasibility of employing ATR-FTIR and chemometrics as an attractive alternative for quality control in adhesive manufacturing.
Keywords: ATR, FTIR, adhesive, viscosity, solid content, PLS, I-PLS
Introduction
Pressure-sensitive adhesives are adhesives that remain sticky even when dried or cured. This means that they are capable of bonding to surfaces simply by the application of light pressure and are familiar in their uses in adhesive tapes and labels.1,2
Pressure-sensitive adhesives fall into three broad product categories: water-based, solvent-based and hot melt. They are employed for a variety of uses, such as masking, packaging, insulation and self-adhesive labels.3 Generally tapes tend to utilize solvent-based adhesives, while water-based adhesives are preferred for label stock; hot melts are used in both applications.
Generally in adhesive formulation, the three major components are an elastomer, which provides the elastic phase, the tackiier and the carrier. The earliest pressure-sensitive adhesives used natural rubber. During manufacture
of adhesives one of the most important parameters is viscosity, which basically describes the “thickness” or resistance to low of a substance.4 This low behavior is an indirect measure of product consistency and quality where materials must be consistent from batch to batch and is also a sensitive method for material characterization because low behavior is responsible for molecular weight and molecular weight distribution.
In the case of adhesives manufacturing, the control of viscosity assures better performance when the adhesive will be used in the coating process or in producing tapes, for example. Also, adhesion performance and durability or, in others words, the quality of product for clients and consequently the image of the factory in marketing depends on viscosity control.
Another important parameter of quality is the solid content deined as the percentage, in weight, of solid material present in the formulation of an adhesive in relation to its mass when either humid or diluted. In the industry, the usual procedure for this determination consists of the withdrawal of a small production sample and its dilution with solvent. This product is initially weighed, dried under heating by a light bulb emitting infrared radiation and weighed again. This procedure is time consuming (minimum of 15 min for each different sample), uses staff, is destructive and generates residues.
In the polymer area, which uses similar raw materials to adhesive manufacturing, several papers have been published using spectroscopic tools, such as mid-infrared, near-infrared7 and Raman.8 In the case of Fourier transformation infrared (FTIR), there are a number of reasons for its success: it is quick and sensitive with easy-to-use sampling techniques. Also, the instrumentation is inexpensive, operation of the equipment is simple, and service and maintenance of the equipment are not difficult.9 Specifically, mid-infrared spectroscopy is a well-established analytical tool in the chemical industry and analytical laboratories. This utility arises from the generally well-resolved absorption bands found in mid-IR spectra and the consequent relative ease of chemical identiication and quantiication. The main advantages of Fourier-transform instruments are that they are highly sensitive, permit higher energy throughput and improve the speed of spectral acquisition.
The introduction of sample to attenuated total relection (ATR)10 greatly eases the analysis of several kinds of materials. In the case of liquids or pastes, ATR is particularly suitable. The main feature of an ATR cell is a crystal of highly refractive material (e.g. ZnSe) onto the top surface of which the test sample is layered. Crystal construction is such that light entering at one end undergoes total internal relection at the top and bottom faces to exit from the other end to the detector. At each point of relection, a small evanescent2 wave is generated which penetrates a short distance into any sample in contact with the top face. This interaction results in the absorption of radiation by the sample and the consequent attenuation of the input signal at a number of wavelengths, thus producing an absorption spectrum.11 Harris and Svoboda11 were one of the irst to use attenuated total relectance in the analysis of resins.
Partial least-squares regression is a popular multivariate calibration technique for quantitative analysis due to its ability to overcome problems such as loss of resolution in the analytical signal. PLS performs calibration using information from the whole spectrum to build a regression model against the property being determined (viscosity or
solid content in this case). In recent years, both theoretical and experimental evidence has been published that spectral region selection can signiicantly improve the performance of these full-spectrum calibration techniques. Several methods of variable selection to implement spectral region selection have been described in the literature and have used PLS for multivariate calibration in each subset. The iPLS algorithm13 was used for interval selection in this work. The principle of this algorithm is to split the spectra into smaller equidistant regions and, afterwards, develop PLS regression models for each of the sub-intervals, using the same number of latent variables. Afterwards, an average error is calculated for every sub-interval and for the full-spectrum model. The region with the lowest errors is chosen. An optimized region can be found by reducing or increasing it by symmetrically or asymmetrically subtracting or adding new variables. One of the main advantages of this method is the ability to represent a local regression model in a graphical display, focusing on models with speciied intervals and the full-spectrum mode.
In this paper an exploratory analysis was performed using infrared spectroscopy with attenuated total relectance measurements of pressure-sensitiveadhesives, as well as, it was accomplished adhesive viscosity and solid content determination. Principal component analysis (PCA) was employed for exploratory analysis and partial least squares (PLS) regression for data modeling using the full information of the spectra, while iPLS was used to select variable intervals.
Experimental
Data set for PCA analysis
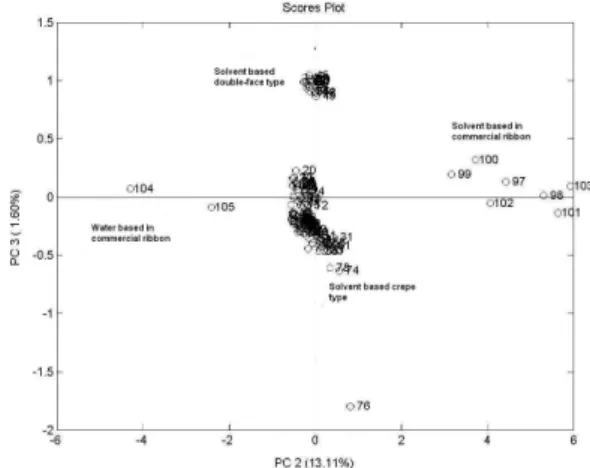
The data set consisted of 105 samples of pressure-sensitive adhesives: 80 crepe type solvent-based, 16 double-face type solvent-based, 7 solvent-based applied on ribbons and 2 water-based applied on ribbons.
Viscosity measurements of solvent-based adhesive
the force required to turn the spindle in the solution at a given rate. The viscosity values were from 56000 to 110000 cP.
Solids content measurements of water-based adhesive
The usual procedure for determination of solids content consists of keeping an adhesive sample under a light source that emits radiation in the infrared wavelength until it reaches temperatures high enough to cause the solvent to evaporate. The solids content is determined by mass ratio before and after drying, multiplied by one hundred.
The determination of the solid contents was carried out by diluting 28 water-based adhesives so that their solid contents ranged from 1 to 54%. These values were checked by the method used for determination of solid content described above.
FTIR measurements
In this study a BOMEM MB100 FTIR spectrometer was used. The instrument was purged with nitrogen to minimize water and CO2 interference. A horizontal ATR sampling accessory equipped with a ZnSe crystal was used to obtain the spectra of the adhesives samples. For ATR data acquisition, approximately 2 mL of adhesive sample was placed onto the crystal and the spectrum was recorded. An air spectrum was used as reference in absorbance calculations and the sample spectra were collected in the range of 650 to 4000 cm-1, using 32 scans at 4 cm-1 resolution. All spectra were obtained in triplicate and the average for each sample was used in the chemometric analysis.
Chemometric analysis
The qualitative evaluations were carried out using PCA and the quantitative determinations by using PLS and iPLS. The programs were run in Matlab 6.5 for Windows using PLS toolbox version 3.5 for use with Matlab from Eigenvector Research Inc.13 The selection of intervals was performed through the iPLS program, version 2.1 for Matlab, developed by Jesper M. Wagner, from the Royal Veterinary and Agricultural University of Denmark.14 To evaluate the error of each calibration model, the root mean square error was used, calculated as:
(1)
where yp is the predicted value, yr is the reference value and N is the number of samples.
For viscosity determination, a total of 73 solvent-based adhesivesamples were used in the modeling. These samples
were split into 63 for model development (calibration step) and 10 for model validation.
For solids content determination, a total of 28 water-based adhesive samples were used, 20 for model development and 8 for validation.
Results and Discussion
Classiication of adhesives types
The PCA is frequently used for exploratory analysis, including of polymeric materials.15,16 The spectra of different pressure-sensitive adhesives were analyzed by PCA and the scores plot of the second versus the third principal component can be seen in Figure 1. It is clear that the visualization of the 4 groups corresponding to each type of adhesive. This is an important information mainly if applied to other adhesive types, as well as to analyze raw materials that have been supplied, containers without labels and many other needs of routine manufacturing.
Viscosity determination of solvent-based adhesive
In order to develop the model for viscosity determination, 63 samples were used for calibration and 10 samples were used for prediction. The variables were selected by iPLS algorithm. Four models were developed by iPLS share the spectrum into 5, 15, 25 and 40 intervals of wavenumber. The model selected was that one using 15 intervals with 6 latent variables that showed the lowest RMSECV (3350 cP) and it was lower than the RMSECV (root mean square of cross-validation) for the global model using 4 latent variables. In Figure 2, the infrared spectrum of natural rubber adhesive is presented and the bars represent the RMSECV for each interval and the horizontal line the RMSECV for the global model.
The region selected to be used in the PLS model was from 1375 to 1565 cm-1 (interval number 5 in Figure 2). The bands around 1360 cm-1 are the C-S stretching, characteristic of vulcanized rubber, and 1500 cm-1 are due to aromatics of rubbers as well as organic solvent present in the formulation. From this it is possible to conclude that the viscosity is closely related to the amount of rubber and organic solvent used in the formulation.
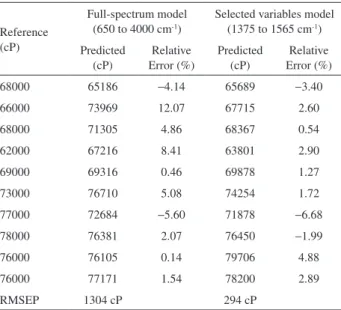
In this way, two PLS models have been developed, one using the whole spectrum, also called the full-spectrum method, and another using only the region selected by iPLS. The predicted values are shown in Table 1, where the results indicate that the iPLS model produces lower errors when compared with the full-spectrum model. The RMSEP value for the iPLS model is 77 % lower than the full-spectrum model. This indicates that the region selected better represents the relation between viscosity and infrared spectrum bands.
Solids content determination of water-based adhesive
Figure 3 shows the spectra of the 28 water-based adhesives used for solids content determination. In this case, it was selected the region from 850 to 1450 cm-1, since spectral variation is observed only in this region. In this analysis, 20 samples were used for calibration and 8 were used for prediction for solid content determination. The models for iPLS were developed by splitting the spectra in 5, 10, 15, 20 and 40 parts, and using the global model. Unfortunately, no interval presented RMSECV less than the global model, thus, it was not possible to select a region of importance for this parameter to develop a model for the PLS considering the information only contained in a single region.
The predicted values for this model are organized in Table 2 where the PLS with 5 latent variables was used. It is possible to observe that although it was not possible to select a region, a maximum of 7.5% in the error was obtained relative to the sample, which is completely acceptable for the adhesive industry.
Table 1. Results for viscosity determination of solvent-based adhesive
Reference (cP)
Full-spectrum model (650 to 4000 cm-1)
Selected variables model (1375 to 1565 cm-1)
Predicted (cP)
Relative Error (%)
Predicted (cP)
Relative Error (%)
68000 65186 −4.14 65689 −3.40
66000 73969 12.07 67715 2.60
68000 71305 4.86 68367 0.54
62000 67216 8.41 63801 2.90
69000 69316 0.46 69878 1.27
73000 76710 5.08 74254 1.72
77000 72684 −5.60 71878 −6.68
78000 76381 2.07 76450 −1.99
76000 76105 0.14 79706 4.88
76000 77171 1.54 78200 2.89
RMSEP 1304 cP 294 cP
Table 2. Results for solids content determination of water-based adhesive
Reference (%)
Predicted (%)
Relative error (%)
RMSEP (%)
2.07 1.92 −7.54
0.3987
4.00 3.96 −0.95
8.09 7.75 −4.34
11.11 10.98 −1.13
15.33 15.10 −1.50
24.29 24.43 0.57
37.75 36.75 −2.73
49.90 49.70 −0.41
Figure 2. Spectrum of solvent-based adhesive samples and the intervals used in iPLS model.
Conclusions
In this study, it was verified that ATR-infrared spectroscopy in conjunction with chemometrics are quality control suitable tools for adhesive manufacturing. PCA clearly grouped 4 types of adhesives. In viscosity determination, variable selection by iPLS improved the PLS calibration results and provided the visualization and interpretation of the most importance region related to the physical property of solved-based adhesives. To water based adhesives, the solids content determination also presented feasible results, with a margin of error which is acceptable for the adhesive industry.
Acknowledgments
The authors wish to thank ADERE Ltda. for supplying the samples and SAE/UNICAMP for a fellowship for J.G.A.
References
1. Czech, Z.; Int. J. Adhes. Adhes.2004, 24, 119.
2. Comyn, J.; Adhesion Science, The Royal of Chemistry: Cambridge, 1997.
3. Pizzi, A.; Mittal, K.L.; Handbook of Adhesive Technology, Marcel Dekker: New York, 1994.
4. Ferguson, J.; Reilly B.; Granville, N.; Polymer1997, 38, 795. 5. ASTM D1084-97, Standard Test Methods for Viscosity of
Adhesives, 2005.
6. Collyer, A. A.; Clegg, D. W.; Rheological Measurements, Chapman & Hall: London, 1998.
7. Pasquini, C.; Figueiredo, F. C.; Prince, B.; Spectrosc. Lett.2005,
38, 741.
8. Ito, K.; Kato, T.; Ona, T.; Vib. Spectrosc.2004, 35, 159. 9. Koenig, J. L.; Spectroscopy of Polymers, ACS Professional
Reference Book, American Chemical Society: Washington, 1992.
9. Yuan, H. F.; Chu, X. L.; Li, H. R.; Xu, Y. P.; Fuel 2006, 85, 1720.
10. Downey, G.; Trends Anal. Chem.1998, 17, 418.
11. Harris, R. L.; Svoboda, G. R.; Anal. Chem.1962, 34, 1655. 12. Munck, L.; Nielsen, J. P.; Moller, B.; Jacobsen, S.; Sondergaard,
I.; Engelsen, S. B.; Norgaard, L.; Bro, R.; Anal. Chim. Acta
2001, 446, 171.
13. Norgaard, L.; Saudaland, A.; Wagner, J.; Nielsen, J. P.; Munck, L.; Engelsen, S. B.; Appl. Spectrosc.2000, 54, 413.
14. Wise, B. M.; Gallagher, N. B.; PLS Toolbox for Use with Matlab, Eingevector Research: Manson, 1998.
15. Elomaa, M.; Lochmuller, C. H.; Kudrjashova, M.; Thermochim.
Acta. 2000, 362,137.
16. Shimoyama, M.; Maeda, H.; Matsukawa, K.; Inoue, H.; Ninomiya, T.; Ozaki, Y.; Vib. Spectrosc.1997, 14, 253.
Received: May 15, 2009 Web Release Date: December 3, 2009