Effect of antioxidant and optimal antimicrobial mixtures of
carvacrol, grape seed extract and chitosan on different spoilage
microorganisms and their application as coatings on different
food matrices
Javiera F. Rubilar
a,c, Rui M. S. Cruz
b,c, Igor Khmelinskii
a,c, and Margarida C.
Vieira
b,c*aDepartamento de Qu´ımica e Farm´acia, Faculdade de Ciˆencias e Tecnologia, Universidade do Algarve, Campus
de Gambelas, 8005-139 Faro, Portugal.
bDepartamento de Engenharia Alimentar, Instituto Superior de Engenharia, Universidade do Algarve, Campus
da Penha, 8005-139 Faro, Portugal.
cCentro de Investiga¸c˜ao em Qu´ımica do Algarve (CIQA), Departamento de Qu´ımica e Farm´acia, Faculdade de
Ciˆencias e Tecnologia, Universidade do Algarve, Campus de Gambelas, 8005-139 Faro, Portugal. E-mail addresses: [email protected], [email protected] and [email protected].
*
Corresponding author [email protected] Tel: +351-289-800900 Fax: +351-289-800066
Received: 14 March 2012; Published online: 18 April 2013
Abstract
There is growing interest in the use of natural agents with antimicrobial (AM) and antioxidant (AOX) properties. Optimization of the AM capacity for mixtures containing carvacrol, grape seed extract (GSE) and chitosan, against gram-negative (Pseudomonas aeruginosa), gram-positive bac-teria (Staphylococcus aureus, Lisbac-teria innocua and Enterococcus faecalis) and yeast (Saccharomyces cerevisiae) at 106 cfu mL−1
was studied. To observe the synergistic or antagonistic effect and find optimal combinations between the three agents, a simplex centroid mixture design was run for each microorganism, combining carvacrol (0-300 ppm, X1)X, GSE (0-2000 ppm, X2) and chitosan (0-2%
w/v, X3). Results of the response surface analysis showed several synergistic effects for all
microorgan-isms. Combinations of 60 ppm-400 ppm-1.2% w/v (carvacrol-GSE-chitosan; optimal AM combination 1, OAMC-1); 9.6 ppm-684 ppm-1.25% w/v (OAMC-2); 90 ppm-160 ppm-1.24% w/v (OAMC-3) were found to be the optimal mixtures for all microorganisms. Radical scavenging activity (RSA) of the same agents was then compared with a standard AOX (butylated hydroxytoluene; BHT) at different concentrations (25, 50 and 100 ppm; as well as the optimal AM concentrations) by the 1,1-diphenyl-2-picrylhydrazyl (DPPH) method. RSA increased in the following order: chitosan< carvacrol< BHT< GSE and for the OAMC: OAMC-2< OAMC-1< OAMC-3. The best RSA (OAMC-3) was applied as a coating in two different food matrices (strawberries and salmon). For strawberries, P. aeruginosa was more sensitive to the action of OAMC-3 than S. cerevisiae. For salmon, S. aureus was more resistant to the action of OAMC-3 than E. faecalis and L. innocua.
1
Introduction
Synthetic packaging films have led to seri-ous ecological problems due to their non-biodegradability. The high level of consumer concern for environmental protection led food and packaging industries to increase research in biodegradable food packaging materials (Fajardo et al.,2010). Biopolymers can be an alternative source for packaging materials’ development due to their biodegradability. Chitin is an abundant naturally occurring biopolymer and is found in the exoskeleton of crustaceans, in fungal cell walls and in other biological materials. It is mainly poly(β-(1-4)-2-acetamido-D-glucose), which is structurally identical to cellulose except that a secondary hydroxyl on the second carbon atom of the hexose repeat unit is replaced by an acetamide group (Geraldine, Ferreira Soares, Botrel, & Goncalves, 2008). Chitosan is derived from chitin by deacetylation in an alkaline media. Therefore, chitosan is a copolymer consisting of acetamido-D-glucose and β-(1-4)-2-amino-D-glucose units, with the latter usually exceeding 80%. Moreover, chitosan is one of a few natural cationic polysaccharides, derived from crustacean or fungi, having antimicrobial (AM) properties against many bacteria, filamen-tous fungi and yeast (Rabea, Badawy, Stevens, Smagghe, & Steurbaut, 2003). Furthermore, chitosan has antitumor and hypocholesterolemic functions but it does not have significant antiox-idant (AOX) activity (Ojagh, Rezaei, Razavi, & Hosseini, 2010). Several studies have shown that the AM and AOX effect of chitosan was greatly enhanced by the addition of essential oils (Jung et al., 2010). Carvacrol, the major component (50-86%) of oregano (Origanum sp.), is a phenolic compound that has been used for many generations as a food flavouring agent and is generally recognized as safe (GRAS, as flavouring agent) by the FDA (US Food and Drug Administration, 2006). The AOX activity of carvacrol has been demonstrated (Aeschbach et al., 1994). Recently its AM activity against bacteria, mold and yeast has been reported, along with carvacrol’s high potential to extend the shelf-life and improve safety of perishable foods (Guarda, Rubilar, Miltz, & Galotto,2011). Another compound known by its AM properties
is grape seed extract (GSE). This is a rich source of monomeric phenolic compounds such as (+)-catechins, (-)-epicatechin, (-)-epicatechin-3-o-gallate, gallic acid and dimeric, trimeric and tetrameric procyanidins, which have AOX (Kim & Thomas, 2007) and antibacterial properties (Corrales, Han, & Tauscher,2009). The order of increasing AM activity reported for parts of the grape vine was flesh, whole fruit grape extracts, fermented fruit, fermented pomace, skin, leaves and seeds (Xia, Deng, Guo, & Li,2010).
Anastasiadi, Chorianopoulos, Nychas, and Haroutounian (2009) suggested that high con-centrations of flavonoids and their derivatives in grape seed and of flavonoids, stilbenes and phe-nolic acids in grape stems were responsible for the AM activity. Rodriguez Vaquero, Alberto, and Manca de Nadra (2007) concluded that the non-flavonoid caffeic acid and the flavonoids such as rutin and quercetin have high inhibitory activities on growth of L. monocytogenes. Rhodes, Mitchell, Wilson, and Melton (2006) demonstrated that polymeric phenolic fractions produced the highest inhibition activity for all Listerial species, but not for other bacteria such as B. cereus, Salmonella menston, E. coli, S. aureus or Yersinia enterocolitica.
On the other hand, chitosan’s application as an edible film and coating is very attractive, and it has been reported in several studies as one of the most promising coating materials for different food matrices (Park, Stan, Daeschel, & Zhao,2005; Park & Zhao,2004). However, none have studied optimal combinations of chitosan and natural AM agents. The present study aims to develop an optimal mixture of carvacrol, GSE and chitosan for the growth inhibition of five different microorganisms, and test its usage in two different food matrices (strawberries and salmon), thereby contributing to future applications in coatings and active packaging films with AM and AOX properties.
2
Materials and Methods
2.1
Microorganisms and media
Listeria innocua (ATCC 33090), Staphylococ-cus aureus (ATCC 25923), EnterococStaphylococ-cus fae-calis (ATCC 29212), Pseudomonas aerugi-nosa (ATCC 27853) and Saccharomyces cere-visiae (ATCC 9763) were obtained from Iberlab&imunoreage®(Lisbon, Portugal). Yeast malt agar (YMA, for yeast), tryptic soy broth (TSB, for bacteria), tryptic soy agar (TSA, for bacteria), and tryptone water were obtained from Scharlau (Lisbon, Portugal). Yeast malt broth (YMB, for yeast) was obtained from Merck (Lis-bon, Portugal).
2.2
Antimicrobial agents and
chemicals
Carvacrol (98% pure; Cat: 28,219-7), 1,1-diphenyl-2-picrylhydrazyl (DPPH; Cat: D9132-1G), butylated hydroxytoluene (BHT; Cat: 47168) and chitosan (high molecular weight; with a deacetylation degree of >75%, Cat: 419419-250G) were obtained from Sigma Aldrich (Lis-bon, Portugal). Grape seed extract (GSE; exGrape® seed OPC 40 powder, polyphenols >95% and proanthocyanidins >70%) was ob-tained from Gardonnenque (Groupe Grap’Sud, Cruviers Lascours, France). Ethanol and acetic acid were purchased from Merck (Lisbon, Portu-gal). Methanol was obtained from Jos´e Manuel Gomes dos Santos (JMGS Odivelas, Portugal).
2.3
Determination of carvacrol
and GSE minimal inhibitory
concentrations
The minimal inhibitory concentrations (MIC) of carvacrol and GSE were determined for the five studied microorganisms (L. innocua, S. aureus, E. faecalis, P. aeruginosa and S. cerevisiae). Stock solutions of the AM agents were prepared, based on previous studies by Jayaprakasha, Selvi, and Sakariah (2003) and Guarda et al. (2011), as follows: 30% of carvacrol in ethanol and 10% of GSE in distilled water. Serial dilutions of car-vacrol (7500; 6000; 4500; 3000; 1500; 750; 375;
300; 225; 150; 75 and 37.5 ppm) and GSE (16000, 12000, 8000, 4000, 2000, 1000, 500, 250, 125 ppm) were prepared in sterile TSA for the bacte-ria and in sterile YMA for the yeast. Petri dishes were inoculated with 1 mL of 106 cfu for bacte-ria (growth in TSB for 18 h at 37ºC) and yeast (growth in YMB for 18 h at 28 ºC) (except P. aeruginosa where an inoculum of 104 cfu mL−1 was also tested) and incubated (Binder, BD-115, Germany) at 37ºC (bacteria) and 28 ºC (yeast) for 48 h. The lowest concentration able to inhibit visible growth (colony-forming units (cfu) on the surface of the solid medium) of the test microor-ganisms was taken as being the MIC Guarda et al. (2011). The highest concentration of ethanol (used as solvent for carvacrol) was used as a con-trol, to verify that ethanol had no AM effect. All experiments were run in triplicate.
2.4
Experimental Design
Response surface methodology was used in or-der to test the synergies between the three com-pounds (carvacrol, GSE and chitosan). The MIC obtained for L. innocua and E. faecalis were se-lected, which were 300 ppm for carvacrol, and 2000 ppm for GSE. A simplex centroid mixture (SCM) design was run for each microorganism using the Design-Expert® 7.0 software (Design-Expert software, 2005), at 300 ppm carvacrol, 2000 ppm GCE and 2% w/v chitosan, with the objective to find one or more optimal mixtures with a broad spectrum of action and effective simultaneously against yeast, gram-positive and gram-negative bacteria. The above MIC values were selected, because the other MIC were either too high, as in the case of P. aeruginosa, show-ing values of MIC greater than 7500 ppm for car-vacrol and values of MIC of 16000 ppm for GSE, or too low, such as S. cerevisiae or S. aureus, showing MIC values of 150 and 225 ppm for car-vacrol, respectively. Therefore, we selected the values close to the average MIC values obtained for the five microorganisms tested.
In order to check the viability of all bacteria and yeast, a control was run with TSA for bacteria and YMA for yeast.
The data obtained from the SCM design were fit-ted with a third order polynomial equation (Eq.
1). The equation was as follows:
Yi= β1x1+ β2x2+ β3x3+ β12x1x2 +β23x2x3+ β13x1x3+ β123x1x2x3
(1)
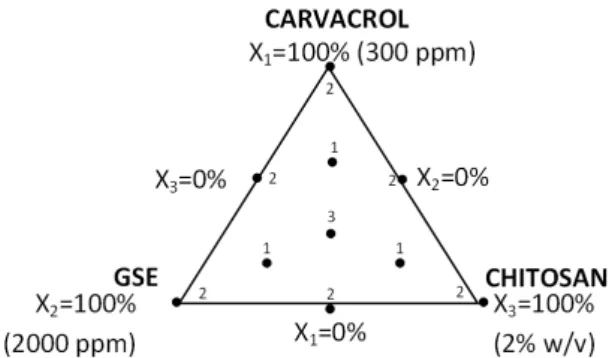
where Yiis the response variable of the evaluated parameter i (defined as log reduction for each mi-croorganism, which was the difference between what grew in the agar control and what grew in the agar with added AM solutions). Prediction models were obtained for Y1: log reduction of L. innocua; Y2: log reduction of S. aureus; Y3: log reduction of E. faecalis; Y4: log reduction of P. aeruginosa and Y5: log reduction of S. cere-visiae; where β1, β2, β3, β12, β23, β13 and β123 are the estimated coefficients (Myers & Mont-gomery,1995). The different combinations of the three natural agents, carvacrol (0-300 ppm, X1), GSE (0-2000 ppm, X2) and chitosan (0-2% w/v, X3), were prepared following the proportions de-termined by the experimental design (Table 1), in sterile TSA for bacteria and sterile YMA, for yeast, according to the method of Guarda et al. (2011). The plates inoculated with 106cfu mL−1 of each of the microorganisms were incubated at the appropriate conditions (section 2.3). The ad-equacy of the model was determined by evalu-ating the coefficient of determination (R2) and the Fisher test value (F -value) obtained from the analysis of variance (ANOVA). Statistical signif-icance of the model and model variables were de-termined at a significance level of 0.05. The cu-bic model equation was used by the software to build the response surface. Three-dimensional response surface plots were generated by keep-ing one response variable at its optimal level and plotting that against three factors (independent variables). The complete design for each mi-croorganism consisted of 18 experimental points including three replications of the central point (Fig. 1). The actual values of the factors for the experimental design are given in Table1.
2.5
Optimization and model
validation
The goal (maximum logarithmic reduction) and constraint (six logarithmic reductions at most) were established for each response in order to
Figure 1: Simplex centroid mixture design.
carry out an optimization between the three nat-ural AM agents for each microorganism and to select the best possible combination. Several researchers reported concentrations of chitosan solutions between 1% and 2% w/v for the de-velopment of chitosan films (Pranoto, Rakshit, & Salokhe, 2005; Durango et al., 2006). There-fore, the percentage of chitosan for optimization was restricted between 60% (1.2% w/v) and 70% (1.4% w/v). An experimental validation was per-formed in order to confirm the optimal solutions selected by the prediction models for each mi-croorganism. The experimental validation was run in triplicate.
2.6
Antioxidant activity (DPPH
radical assay)
The measurements of the free radical scavenging effect of carvacrol, GSE and chitosan were based on previous studies by Sokmen et al. (2004), Baydar, Ozkan, and Yasar (2007), and Kim and Thomas (2007) and compared to BHT, a known antioxidant, by the DPPH method. A 1.0 mL solution of the agents at different concentrations (25, 50, 100 ppm as well as the optimal AM con-centrations OAMC-1, OAMC-2 and OAMC-3) in methanol was mixed with 2.0 mL of methano-lic solution of DPPH (40 mg L−1). The mix-ture was shaken vigorously and allowed to stand at room temperature for 30 min. Then, the absorbance was measured at 517 nm against methanol (blank) in a spectrophotometer. Lower absorbance of the reaction mixture indicated
T able 1: Original comp onen ts of the design matrix and exp erimen tal v alues obtained for eac h micro organism L. inno cua S. aur eus E. fae calis P. aeruginosa S. cer evisiae Run X1 X2 X3 Y1 X1 X2 X3 Y2 X1 X2 X3 Y3 X1 X2 X3 Y4 X1 X2 X3 Y5 1 200 333.3 0.33 6.15 ± 0.03 200 333.3 0.33 6.48 ± 0.0 200 333.3 0.33 6.30 ± 0.17 200 333.3 0.33 6.53 ± 0.07 200 333.3 0.33 6.45 ± 0.07 2 50 333.3 1.33 6.08 ± 0.03 50 333.3 1.33 6.48 ± 0.0 50 333.3 1.33 6.00 ± 0.17 50 333.3 1.33 6.40 ± 0.07 50 333.3 1.33 6.32 ± 0.07 3 0 1000 1 6.15 ± 0.03 0 1000 1 6.48 ± 0.0 0 1000 1 6.00 ± 0.17 0 1000 1 6.53 ± 0.07 0 1000 1 6.45 ± 0.07 4 0 1000 1 6.08 ± 0.03 0 1000 1 6.48 ± 0.0 0 1000 1 6.30 ± 0.17 0 1000 1 6.40 ± 0.07 0 1000 1 6.32 ± 0.07 5 50 1333 0.33 6.11 ± 0.03 50 1333 0.33 6.48 ± 0.0 50 1333 0.33 6.30 ± 0.17 50 1333 0.33 6.40 ± 0.07 50 1333 0.33 4.83 ± 0.11 6 150 0 1 6.14 ± 0.03 150 0 1 6.48 ± 0.0 150 0 1 6.00 ± 0.17 150 0 1 6.53 ± 0.07 150 0 1 6.32 ± 0.07 7 150 0 1 6.08 ± 0.03 150 0 1 6.48 ± 0.0 150 0 1 6.30 ± 0.17 150 0 1 6.40 ± 0.07 150 0 1 6.45 ± 0.07 8 0 2000 0 6.08 ± 0.03 0 2000 0 6.48 ± 0.0 0 2000 0 6.30 ± 0.17 0 2000 0 4.15 ± 0.06 0 2000 0 0.30 ± 0.10 9 0 2000 0 6.15 ± 0.03 0 2000 0 6.48 ± 0.0 0 2000 0 6.30 ± 0.17 0 2000 0 4.04 ± 0.06 0 2000 0 0.48 ± 0.10 10 0 0 2 6.08 ± 0.03 0 0 2 6.48 ± 0.0 0 0 2 6.30 ± 0.17 0 0 2 6.53 ± 0.07 0 0 2 6.45 ± 0.07 11 0 0 2 6.15 ± 0.03 0 0 2 6.48 ± 0.0 0 0 2 6.00 ± 0.17 0 0 2 6.40 ± 0.07 0 0 2 6.32 ± 0.07 12 300 0 0 6.08 ± 0.03 300 0 0 6.48 ± 0.0 300 0 0 6.30 ± 0.17 300 0 0 1.38 ± 0.06 300 0 0 6.32 ± 0.07 13 300 0 0 6.15 ± 0.03 300 0 0 6.48 ± 0.0 300 0 0 6.30 ± 0.17 300 0 0 1.26 ± 0.06 300 0 0 6.4 5 ± 0.07 14 100 667 0.67 6.08 ± 0.03 100 667 0.67 6.48 ± 0.0 100 667 0.67 6.30 ± 0.17 100 667 0.67 6.53 ± 0.07 100 667 0.67 6.45 ± 0.07 15 100 667 0.67 6.08 ± 0.03 100 667 0.67 6.48 ± 0.0 100 667 0.67 6.30 ± 0.17 100 667 0.67 6.53 ± 0.07 100 667 0.67 6.45 ± 0.07 16 100 667 0.67 6.08 ± 0.03 100 667 0.67 6.48 ± 0.0 100 667 0.67 6.30 ± 0.17 100 667 0.67 6.53 ± 0.07 100 667 0.67 6.45 ± 0.07 17 150 1000 0 4.33 ± 0.04 150 1000 0 6.48 ± 0.0 150 1000 0 5.04 ± 0.14 150 1000 0 3.00 ± 0.13 150 1000 0 6.32 ± 0.07 18 150 1000 0 4.40 ± 0.04 150 1000 0 6.48 ± 0.0 150 1000 0 5.26 ± 0.14 150 1000 0 3.26 ± 0.13 150 1000 0 6.45 ± 0.07 X1 : Carv acrol (ppm); X2 : GSE (ppm); X3 : Chitosan (% w/v); Yi : exp erimen tal v alues obtain e d for eac h micro organism (Log reductions ± SD). All analy ses w ere run in triplicate.
higher free radical scavenging activity. All de-terminations were carried out in triplicate. The percent of DPPH decoloration of the sam-ples was calculated according to the formula (Eq. 2).
Antiradical activity = 100 × (1–(Sample absorbance Control absorbance))
(2)
2.7
Inoculation and coating
treatment of strawberry and
salmon
Fresh strawberries were purchased from a local supermarket immediately after they arrived from storage. Fruits were selected for uniform size, diameter, colour and maturity (3/4 of surface showing red) and for being free of visible defects and decay. The strawberries were dipped into 250 ppm sodium hypochlorite for 30 s and rinsed with distilled water. No residual chlorine was en-sured with a control test. It is known that chlo-rine in contact with salmon (or organic matter) can produce organic chlorinates (carcinogenic), nevertheless, to reproduce the same conditions for salmon and strawberries, the experiment was performed with chlorine. Fresh salmon was pur-chased from a local seafood market, and stored for a short period of time. Salmon was cut into pieces with the following dimensions: approxi-mately 3 cm x 3 cm x 1.5 cm (length, width and thickness).
The methodology for salmon and strawberry was based on a previous study with modifications (Park et al.,2005). Strawberries were inoculated with 106 cfu mL−1 suspensions of S. cerevisiae and P. aeruginosa (separately) by dipping straw-berries in 106 cfu suspension for one min and dried on foil for 1 h before subjecting to coat-ing application. Salmon samples were inoculated with 106cfu mL−1suspensions of L. innocua, E. faecalis and S. aureus (separately) by dipping each salmon piece in 106cfu suspensions for one min and dried on foil for 1 h before coating ap-plication.
Inoculated strawberries and salmon pieces were coated with the solution with the best AOX ca-pacity (optimal AM combination 3; OAMC-3), and two controls were also analysed (dipped in
distilled water and residual chlorine). Strawber-ries and salmon pieces were dipped in coating solutions at room temperature (22ºC) for 1 min and dried on a sterile stainless-steel screen with 70% ethanol under fans (2.2 ± 0.2 m s−1) for about 1 h to ensure surface dryness. Fruits were then packed in a sterile expanded polystyrene food tray, which was placed within a polyethy-lene bag, and stored at refrigeration temperature (5.8 ± 0.85ºC).
2.8
Microbiological analysis
Microbiological analysis was carried out on days 0 and 2. After 16 days visual difference between the control and coated food matrices (strawber-ries and salmon) were observed.
10 g of inoculated and coated food matrix (straw-berries and salmon) were mixed with 90 mL of tryptone water for 120 s in a Stomacher bag (Seward, Stomacher 400), using a Stomacher blender (Seward, Stomacher 400, London, Eng-land). The suspension was plated with appro-priate dilutions on YMA for yeast and TSA for bacteria. YMA plates were incubated for 48 h at 28 ºC and TSA for 48 h at 37 ºC. The experi-ments were run in triplicate.
2.9
Statistical analysis
A randomized experimental design was used. Data analyses were carried out using Statgraph-ics Centurion XV software (2006), based on anal-ysis of variance and the Student’s t -test. Differ-ences were considered at a significance level of α=0.05.
3
Results and Discussion
3.1
Carvacrol and GSE minimal
inhibitory concentrations
For carvacrol the density was considered to be 0.976 g mL−1, at 20ºC, obtaining concentrations of 50; 40; 30; 20; 10; 5; 2.5; 2.0; 1.5; 1.0; 0.5 and 0.25 mmol. For comparison purposes with GSE, the concentrations of carvacrol were converted into ppm.
Carvacrol and GSE exhibited AM activity against most microorganisms tested in this study. P. aeruginosa was the most resistant to the ac-tion of carvacrol showing values of MIC greater than 7500 ppm (106 cfu mL−1). L. innocua and E. faecalis, presented values of MIC of 300 ppm and S. aureus a MIC of 225 ppm, show-ing less resistance to the action of this natural AM agent than P. aeruginosa. The yeast was the least resistant to the action of carvacrol pre-senting a MIC of 150 ppm. These results are similar to those found by Cosentino et al. (1999) who tested the AM activity of Thymus essential oils and found that yeasts were the most sensi-tive among the studied microorganisms, followed by the positives and coming last the gram-negative bacteria. The AM activity of essential oils, which contain high percentages of carvacrol, has been studied by different researchers. These compounds have shown to be inhibitory on se-lected food-spoilage organisms (Sivropoulou et al., 1996; Smith-Palmer, Stewart, & Fyfe,1998; Cosentino et al.,1999; Hammer, Carson, & Riley, 1999). Most researchers have reported that the gram-positive bacteria are more sensitive than gram-negative bacteria when using different es-sential oils (Marino, Bersani, & Comi,2001; Pin-tore et al., 2002). This is in agreement with the results of the present study, regarding the effect of carvacrol on P. aeruginosa. Hence, it was essential to determine the carvacrol MIC for a lower inoculum. A MIC of 1500 ppm of car-vacrol was obtained for 104cfu mL−1of P. aerug-inosa. Sivropoulou et al. (1996) and Hammer et al. (1999) determined the AM activity of an extract from Origanum vulgare containing car-vacrol ( 80%), and found that P. aeruginosa pre-sented a MIC of 2000 ppm, a result which was similar to those of other authors (Cosentino et al.,1999; Lambert, Skandamis, Coote, & Nychas, 2001). The higher resistance of gram-negative bacteria to the action of the AM agents can be explained by the outer membrane that surrounds the lipopolysaccharides (LPS) wall in these mi-croorganisms, thereby restricting the diffusion of hydrophobic compounds (Vaara,1992).
Carvacrol is able to disintegrate the outer mem-brane of the gram-negative bacteria, releasing the LPS, which may increase the permeability of the adenosine triphosphate in the cytoplasmic
membrane, and consequently change the passive permeability of the cell. Therefore, a higher con-centration of the AM agent is needed to produce the same effect as in the gram-positive bacteria (Smith-Palmer et al., 1998; Burt, 2004; ˇSegvi´ c-Klari´c, Kosalec, Masteli´c, Pieckov´a, & Pepeljnak, 2006).
Burt (2004) reviewed several studies, in which essential oils and/or active compounds such as carvacrol were analysed, and found MICs for S. aureus and Listeria spp. very similar to those reported in this study. Veldhuizen, Tjeerdsma-Van Bokhoven, Zweijtzer, Burt, and Haagsman (2006) studied the inhibitory effect of carvacrol and carvacrol-related compounds against S. au-reus. Carvacrol presented a MIC of 225 ppm (very similar to this study) and was more ef-fective than carvacrol-related compounds. The GSE showed lower AM activity than carvacrol against all microorganisms. The yeast (S. cere-visiae) was the most resistant to the action of this AM agent (no inhibitory effect) presenting a MIC exceeding 16000 ppm. This polyphenolic resistance can be explained by the yeast natural environment (e.g. grapes and wines) in which several phenolic compounds are present. For this reason, many authors only determined the an-tibacterial capacity of GSE (Jayaprakasha et al., 2003; Baydar, Ozkan, & Sagdic, 2004; Baydar, Sagdic, Ozkan, & Cetin,2006; Anastasiadi et al., 2009). The gram-positive bacteria presented a MIC of 2000 ppm for L. innocua and E. faecalis, and a MIC of 500 ppm for S. aureus. P. aerug-inosa was more resistant to the action of GSE than the gram-positive bacteria, as reported in other studies (Jayaprakasha et al.,2003; Baydar et al.,2004; Baydar et al.,2006). The P. aerug-inosa yielded MIC of 4000 ppm (104 cfu mL−1) and 16000 ppm (106 cfu mL−1). Jayaprakasha et al. (2003) determined the antibacterial capac-ity of GSE and found a MIC of 1000 ppm for S. aureus. Shoko et al. (1999) have also reported the AM activity of GSE and proposed that gal-lic acid was the active compound responsible for the inhibition of E. coli and Salmonella enteri-tidis. Thuille, Fille, and Nagl (2003) studied the inhibitory effect of grape kernel extract against several pathogens and presented MICs of 1000 ppm and 1500 ppm for S. aureus and P. aerug-inosa, respectively. The bacterial growth
inhi-bition caused by GSE can be described by sev-eral mechanisms of action. Namely, polyphenols can penetrate the semipermeable bacterial mem-brane, reacting with the cytoplasm or cellular proteins. This potential is higher in GSE as phe-nolic acids are present in an undissociated form (Paulus,1993; Corrales et al.,2009).
Scalbert (1991) proposed that the antibacterial activity of tannins, compounds present in GSE, could be due to the inhibition of extracellular mi-crobial enzymes. The resistance of gram-negative bacteria to GSE can be explained by their lipidic wall, a strong barrier against polyphenols’ ac-tion. Different extraction procedures and grape seed types may explain the different AM activi-ties achieved in different studies (Corrales et al., 2009).
3.2
Response prediction models
The grades given for each response were averaged for each formulation, defined by the experimen-tal design (Table1). Through statistical analy-sis (Design-Expert, 2005), a search for the pre-diction model that could best fit the experimen-tal data for each response was then performed. Analysis of sequential F-test, for each response, indicate whether the cubic terms β123X1X2X3 would contribute significantly (at 5% level) to the model or not. The model fitting analysis (Table 2) showed, for all the studied microorganisms, a prediction coefficient of determination in reason-able agreement with the adjusted coefficient of determination. The precision with a ratio greater than 4 was also obtained for all models for each microorganism. Therefore, all models could be used to navigate the design spaces. Prediction models were obtained for all responses Y1, Y2, Y3, Y4 and Y5 as shown in Table3.
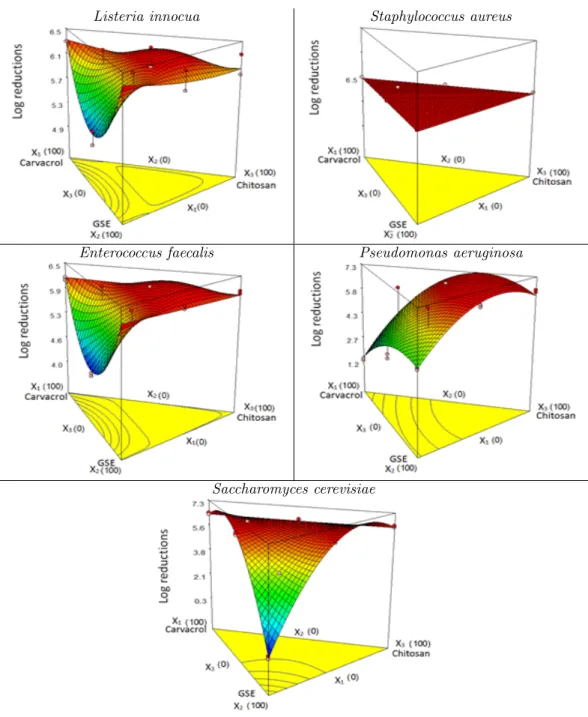
Response surfaces are presented in Fig. 2 for each microorganism. L. innocua and E. faecalis presented a very similar response surface, at low values of carvacrol and GSE and high chitosan concentration (red surface, Fig. 2). For S. au-reus, all combinations showed 6 log reductions because the MICs of carvacrol and GSE were 225 ppm and 500 ppm, respectively. Therefore, this result was expected because S. aureus was the microorganism more sensitive to the action of
AM agents and the concentrations used in this mixture design were higher in all combinations of carvacrol, GSE and chitosan than the MIC for S. aureus.
The concentration used for P. aeruginosa was lower than the corresponding MICs (>7500 for carvacrol and 16000 ppm for GSE) but the re-sult, as can be seen in the Fig. 2, was syner-gistic (concentration below the MICs), obtain-ing 6 log reductions near to the chitosan zone. The response surface for the S. cerevisiae clearly shows that the maximum logarithmic reduction was close to the maximum values of carvacrol and chitosan, and no inhibition was found near the maximum values of GSE due to the polyphe-nolic compounds that are a natural environment for this type of yeast.
All plots in Fig. 2, except P. aeruginosa, showed that concentrations of carvacrol lower than 300 ppm (100% carvacrol) and concentrations of GSE lower than 2000 ppm (100% GSE), in mixture with chitosan (lower than 2% w/v), are sufficient for obtaining six logarithmic reductions for each of the studied microorganisms. The largest log-arithmic reduction zone, resulting from a syner-gistic effect, was observed at 50% of carvacrol, 50% of GSE and high values of chitosan.
3.3
Optimization and model
validation
Several optimal AM combinations (OAMC) were obtained by the program, but only three were selected for all microorganisms. One of the OAMCs selected contained the highest percent-age of GSE (OAMC-1, in Table 4), another contained similar proportions between carvacrol and GSE (OAMC-2, in Table 4) and the third contained the highest percentage of carvacrol (OAMC-3, in Table4).
The three optimal combinations obtained be-tween the three natural agents (carvacrol, GSE and chitosan solution) in the models for all the microorganisms (Table4) were validated exper-imentally. The experimental validation showed that the same optimal combination between the three AM agents, selected by the models, can produce six logarithmic reductions for all of the studied microorganisms.
Listeria innocua Staphylococcus aureus
Enterococcus faecalis Pseudomonas aeruginosa
Saccharomyces cerevisiae
Figure 2: Response surfaces for the effect of carvacrol, GSE and chitosan on the log reduction of different microorganisms (X1: Carvacrol, X2: GSE and X3: Chitosan).
Table 2: Summary of the analysis of variance for all responses.
Source Log Reductions Log Reductions Log Reductions Log Reductions Log Reductions
L. innocua S. aureus E. faecalis P. aeruginosa S. cerevisiae
Model Special Cubic Linear Special Cubic Special Cubic Special Cubic
df MS F-value df MS F-value df MS F-value df MS F-value df MS F-value
Model 6 0.84 22.93* 2 - - 6 0.32 7.66* 6 8.69 15.60* 6 10.52 412.58* Residual 9 0.036 13 - 9 0.041 9 0.56 9 0.025 Lack of Fit 3 0.10 44.36* 3 0.071 2.69 3 1.65 136.02 3 0.058 6.42 Pure Error 6 0.0024 6 - 6 0.026 6 0.012 6 0.010 Corrected Total 15 15 15 15 15 R2 adj 0.8977 - 0.7271 0.8538 0.9940 R2 pred 0.8599 - 0.5642 0.8113 0.9883 Adeq. Prec. 14.998 - 8.515 11.958 58.883 Std. Dev. 0.19 - 0.20 0.75 0.16 * Significant at 1% level.
Table 3: Predictive models obtained for each microorganism. Microorganisms
Coefficients L. innocua S. aureus E. faecalis P. aeruginosa S. cerevisiae
β1 +6.16 +6.48 +6.33 +1.55 +6.37 β2 +6.15 +6.48 +6.33 +4.17 +0.40 β3 +6.06 +6.48 +6.10 +6.26 +6.35 β12 -6.83 +0.00 -4.48 +2.31 +11.98 β13 -0.026 +0.00 -0.035 +10.34 -0.10 β23 -0.029 +0.00 -0.035 +4.47 +11.94 β123 +24.16 +0.00 +18.34 +33.39 -21.83
Table 4: Optimal antimicrobial combinations between the three AM agents. Run* Carvacrol GSE Chitosan Carvacrol GSE Chitosan
(%) (%) (%) (ppm) (ppm) (% w/v)
OAMC-1 3.2 34.2 62.6 9.6 684 1.25
OAMC-2 20 20 60 60 400 1.2
OAMC-3 30 8 62 90 160 1.24
Control 0 0 100 0 0 1.25
Guarda et al. (2011) studied the minimal in-hibitory concentration of carvacrol and thymol, and also found the synergistic effect between the two agents (based on the MIC) for L. innocua, S. aureus, E. coli, S. cerevisiae and A. Niger. The results showed that there was a synergis-tic effect between carvacrol (C ) and thymol (T ) for the growth inhibition of all microorganisms at all combinations of concentrations (0.5T – 0.5C ; 0.25T – 0.75C ; 0.75T -0.25C , expressed in fractions) at 100% of the MIC’s of the AM agents. Synergistic effect was only observed for yeast when carvacrol and thymol were in equal proportions. At 50% of the MIC, no synergistic effect was found for any of the microorganisms. The study of synergistic effects between differ-ent agdiffer-ents is very important for several reasons, such as the decrease of essential oils’ concentra-tion in food and high concentraconcentra-tions of essential oils may cause sensory changes (Chi, Zivanovic, & Penfield,2006).
3.4
Antioxidant activity
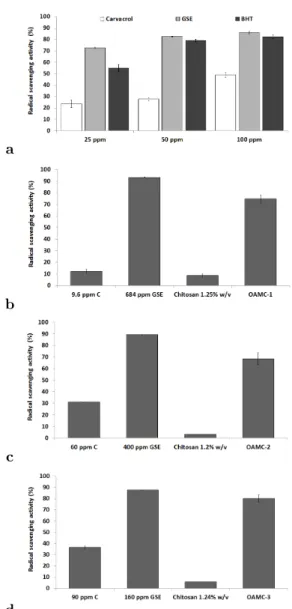
The free radical scavenging activity of GSE was evaluated by the decrease in the peak area of the DPPH radical at 517 nm. Fig. 3(a) shows the radical scavenging activities of carvacrol, GSE and BHT at different concentrations. The amount of DPPH radical decreased much more in the presence of GSE and BHT than carvacrol. The radical scavenging activity of carvacrol, GSE and BHT ranges from 23.7 ± 3.3%, 72.6 ± 0.3% and 54.9 ± 3.3%, respectively at 25 ppm con-centration. Sharp increases in radical scavenging activity, with an increase in the concentration of GSE and BHT, were observed at 50 ppm con-centration, giving 82.4 ± 0.4% and 79.1 ± 0.9%, respectively. Similar results for GSE were ob-tained by Jayaprakasha et al. (2003) at 50 ppm concentration (70% the radical scavenging activ-ity).
The AOX properties of GSE are primarily due to flavonoids that can perform scavenging ac-tion on free radicals, in this case DPPH. The presence of a hydroxyl functional group in the structure and its position on the ring of the flavonoid molecule determines the AOX capac-ity (Arora, Nair, & Strasburg, 1998). Addition
a
b
c
d
Figure 3: RSA of carvacrol, GSE and BHT at dif-ferent concentrations (ppm) (a), RSA of agents at different concentrations of the OAMC-1 (b), OAMC-2 (c), and OAMC-3 (d) by the DPPH method. Error bars represent standard error. Different lower case letters for each concentra-tions are significantly different (p < 0.05).
of hydroxyl groups to the flavonoid nucleus will enhance the AOX activity, while their substitu-tion by methoxy groups diminishes the AOX ac-tivity (Majo, Guardia, Giammanco, Neve, & Gi-ammanco,2008).
Amongst the different parts of a grape vine, grape seeds exhibit the highest AOX activity followed by the skin and the flesh (Pastrana-Bonilla, Akoh, Sellappan, & Krewer,2003). The AOX potential of GSE is twenty and fifty fold greater than those of vitamins E and C, respec-tively (Shi, Yu, Pohorly, & Kakuda,2003). Fig. 3 shows the radical scavenging activities of carvacrol, GSE and chitosan with the opti-mal AM concentrations (OAMC-1, in Fig. 3(b); OAMC-2, in Fig. 3(c); and OAMC-3, in Fig. 3(d) separately and in mixtures. An antagonistic effect of radical scavenging activity of GSE was observed in mixture with carvacrol and chitosan. This could be explained by hydrogen donating to chitosan and not to DPPH (Jayaprakasha et al., 2003).
Comparing the optimal AM combinations (OAMC-1, OAMC-2, OAMC-3), the best rad-ical scavenging activity was found for OAMC-3; therefore this mixture will be used in coating tests of the food matrices.
3.5
Microbiological analysis
The effect of coating with the OAMC-3 on the growth of P. aeruginosa and S. cerevisiae inocu-lated on the surface of fresh strawberries is shown in Fig. 4(a). Immediately after the coating ap-plication (by dipping and drying), the count of viable bacterial cells on the strawberries was re-duced from 4.9 log cfu g−1of P. aeruginosa and about 4.8 log cfu g−1 of S. cerevisiae on un-coated (control) strawberries to about 1.8 log cfu g−1 of P. aeruginosa and about 2.8 log cfu g−1 of S. cerevisiae on coated strawberries, respec-tively. Park et al. (2005) studied the effect of chitosan coating with 0.3% potassium sorbate in strawberries and the results showed that immedi-ately after coating application, Cladosporum sp showed a reduction of 1 log cfu g−1.
After 48 h of the coating application, the level of viable cells on the strawberries was reduced from 4.2 log cfu g−1 of P. aeruginosa and about 4.8
log cfu g−1 of S. cerevisiae on uncoated (control) strawberries to a< 1.0 log cfu g−1 of P. aerugi-nosa and about 3.3 log cfu g−1 of S. cerevisiae on coated strawberries, respectively.
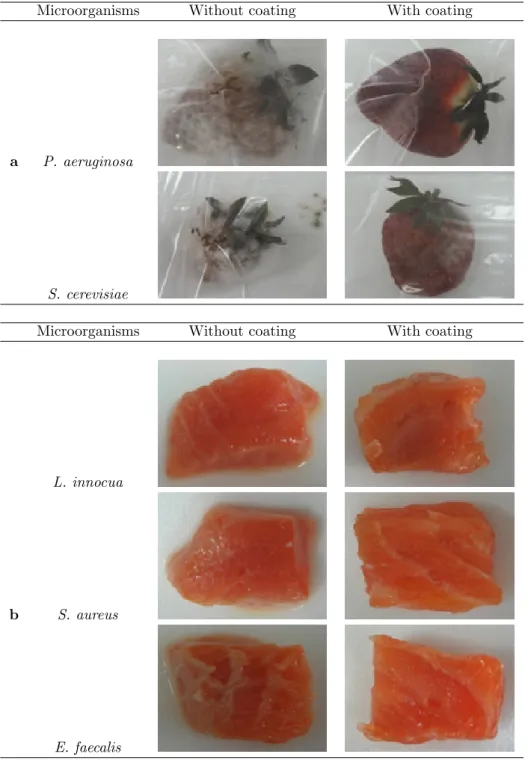
Fig. 5(a) shows visible contamination by mold growth on uncoated strawberries after 16 days, unlike the strawberries coated with OAMC-3 that presented no visible contamination. Never-theless, comparing strawberries inoculated with P. aeruginosa and strawberries inoculated with S. cerevisiae, some mold growth could be ob-served in the latter. The effects of coating with the OAMC-3 on the growth of E. faecalis, L. in-nocua and S. aureus inoculated on the surface of fresh salmon are shown in Fig. 4(b). Imme-diately after the coating application (by dipping and drying), the level of viable bacterial cells in the salmon was reduced from 5.7 log cfu g−1 of E. faecalis, about 6.2 log cfu g−1 of L. innocua and about 5.4 log cfu g−1 of S. aureus on un-coated (control) salmon to about 4.7 log cfu g−1 of E. faecalis, about 4.1 log cfu g−1of L. innocua and about 5.2 log cfu g−1of S. aureus on coated salmon.
48 h after the coating of salmon with OAMC-3, the level of viable cells was reduced from about 5.7 log cfu g−1 of E. faecalis, about 6.2 log cfu g−1 of L. innocua and about 6.6 log cfu g−1 of S. aureus on uncoated (control) salmon to about 4.7 log cfu g−1 of E. faecalis, about 5.0 log cfu g−1 of L. innocua and about 5.9 log cfu g−1 of S. aureus on coated salmon.
Fig. 5(b) shows visibly stronger decomposition of uncoated salmon with a yellow liquid drain-ing after 14 days, while the salmon coated with OAMC-3 presented no such indications for any of the microorganisms studied.
The principal antibacterial compound found in the methanol extract from grape seed is gallic acid and it has shown inhibitory effects on E. coli and S. enteritidis (Shoko et al.,1999). The pres-ence of gallic acid is responsible for their high affinity for the lipid bilayer, and it affects the membrane structure. The major phenolic con-stituents like epicatechin may alter the cell mor-phology by influencing the osmotic pressure of the cell, thus disrupting the cytoplasmic mem-brane and causing leakage of cell constituents (Perumalla & Hettiarachchy,2011).
proper-a
b
Figure 4: Effect of coating on strawberries upon P. aeruginosa and S. cerevisiae (a), and effect of coating on salmon upon E. faecalis, L. innocua, and S. aureus (b).
ties present in GSE. It can generate a deterio-ration effect on the lipid bi-layer membrane and as a result, produce a loss of the cell structure and function, leading to cell death (Perumalla & Hettiarachchy,2011).
Since most foods are mainly composed of wa-ter, carbohydrates, fats, proteins and NaCl, it is important to know the influence of these ponents on the AM activity of any AM com-pounds. Devlieghere, Vermeulen, and Debevere (2004), determined the influence of different food components (starch, whey protein, NaCl and oil) on the AM effect of chitosan.
The results showed that the AM activity of chi-tosan was strongly decreased by high amounts
of starch (30% w/v), leading to a significantly shorter lag phase and a significantly higher growth rate of Candida lambica. Furthermore, it was only mentioned that the gelatinized starch could interact negatively with the AM capacity of chitosan, but it is possible that native starch interacts in a different negative way on the AM capacity of chitosan. Similar results were ob-tained for proteins, due to decrease in the AM activity of chitosan when 10% of whey protein isolate was added. In the case of NaCl, 2% was enough to inhibit the AM activity of chitosan because it interferes with the electrostatic forces between chitosan and the microbial surface. An opposite effect with oil was observed, due to no
Microorganisms Without coating With coating
a P. aeruginosa
S. cerevisiae
Microorganisms Without coating With coating
L. innocua
b S. aureus
E. faecalis
Figure 5: Strawberries inoculated with P. aeruginosa and S. cerevisiae, without and with coating, after 16 days (a), and salmon without and with coating, inoculated with L. innocua, S. aureus, and E. faecalis after 14 days (b).
influence in the AM capacity of chitosan. This phenomenon could be explained by the fact that chitosan is positioned at the outside of the emul-sion drops due to the interaction between the positively charged chitosan and the negatively charged free fatty acid (Devlieghere et al.,2004; Jumaa & Muller,1999).
All these phenomena, might explain why the ap-plication of chitosan coatings on strawberries and salmon did not reduce six logarithmic for all mi-croorganisms.
4
Conclusions
The natural AM agents (carvacrol and GSE) were found to be more effective against the stud-ied gram-positive bacteria, as evidenced by their lower MIC values. The experimental valida-tion confirmed that the optimal soluvalida-tions ob-tained with carvacrol, GSE and chitosan inhibit at least six logarithmic of all microorganisms. GSE and OAMC-3 presented the highest AOX capacities. The coating with OAMC-3 presented significant log reduction on all microorganisms studied, from the beginning of the experiment and after 48 h of the coating application in straw-berries and salmon. In the case of strawstraw-berries, P. aeruginosa was the microorganism more sen-sitive to the action of OAMC-3 than S. cere-visiae, while in the case of salmon, S. aureus was more resistant to the action of OAMC-3 than E. faecalis and L. innocua. For strawberries and salmon, the OAMC-3 did not reduce 6 logarith-mic for all logarith-microorganisms (as well as in agar) because chitosan as a charged molecule could in-teract with charged molecules present in food, thereby decreasing significantly the AM capacity of the chitosan coating. The optimal AM mix-ture selected in this study can contribute to the development of active packaging with AM and AOX properties.
Acknowledgements
The author Javiera F. Rubilar gratefully ac-knowledges her Ph.D. grant Erasmus Mundus 2008-1022/001 Frame ECW/17 from the EACEA of the European Union. The au-thor Rui M. S. Cruz would like to thank
Funda¸c˜ao para a Ciˆencia e Tecnologia (Grant SFRH/BPD/70036/2010).
References
Aeschbach, R, Loliger, J, Scott, B., Murcia, A, Butler, J, Halliwell, B, & Aruoma, O. (1994). Antioxidant actions of Thy-mol, Carvacrol, 6-Gingerol, Zingerone and Hydroxytyrosol. Food and Chemical Tox-icology, 32 (1), 31–36. doi:10 . 1016 / 0278 -6915(84)90033-4
Anastasiadi, M., Chorianopoulos, N. G., Nychas, G.-J. E., & Haroutounian, S. A. (2009). Antilisterial Activities of Polyphenol-Rich Extracts of Grapes and Vinification Byproducts. Journal of Agricultural and Food Chemistry, 57 (2), 457–463. doi:10.1021/jf8024979
Arora, A, Nair, M., & Strasburg, G. (1998). Structure-activity relationships for antiox-idant activities of a series of flavonoids in a liposomal system. Free Radical Biology and Medicine, 24 (9), 1355–1363. doi:10.1016/ S0891-5849(97)00458-9
Baydar, N., Ozkan, G, & Sagdic, O. (2004). To-tal phenolic contents and antibacterial ac-tivities of grape (Vitis vinifera L.) extracts. Food Control, 15 (5), 335–339. doi:10.1016/ S0956-7135(03)00083-5
Baydar, N. G., Sagdic, O., Ozkan, G., & Cetin, S. (2006). Determination of antibacterial ef-fects and total phenolic contents of grape (Vitis vinifera L.) seed extracts. Interna-tional Journal of Food Science and Tech-nology, 41 (7), 799–804. doi: 10.1111/j.1365-2621.2005.01095.x
Baydar, N. G., Ozkan, G., & Yasar, S. (2007). Evaluation of the antiradical and antioxi-dant potential of grape extracts. Food Con-trol, 18 (9), 1131–1136. doi:10 . 1016 / j . foodcont.2006.06.011
Burt, S. (2004). Essential oils: their antibacte-rial properties and potential applications in foods - a review. International Journal of Food Microbiology, 94 (3), 223–253. doi:10. 1016/j.ijfoodmicro.2004.03.022
Chi, S, Zivanovic, S, & Penfield, M. (2006). Ap-plication of chitosan films enriched with
oregano essential oil on Bologna - Ac-tive compounds and sensory attributes. Food Science and Technology Interna-tional, 12 (2), 111–117. doi:10 . 1177 / 1082013206063845
Corrales, M., Han, J. H., & Tauscher, B. (2009). Antimicrobial properties of grape seed ex-tracts and their effectiveness after incorpo-ration into pea starch films. International Journal of Food Science and Technology, 44 (2), 425–433. doi:10.1111/j.1365- 2621. 2008.01790.x
Cosentino, S, Tuberoso, C., Pisano, B, Satta, M, Mascia, V, Arzedi, E, & Palmas, F. (1999). In-vitro antimicrobial activity and chemi-cal composition of Sardinian Thymus es-sential oils. Letters in Applied Microbiol-ogy, 29 (2), 130–135. doi:10 . 1046 / j . 1472 -765X.1999.00605.x
Design-Expert software. (2005). Version 7.0.0. Stat-Ease, Minneapolis.
Devlieghere, F, Vermeulen, A, & Debevere, J. (2004). Chitosan: antimicrobial activity, in-teractions with food components and ap-plicability as a coating on fruit and veg-etables. Food Microbiology, 21 (6), 703–714. doi:10.1016/j.fm.2004.02.008
Durango, A., Soares, N., Benevides, S, Teixeira, J, Carvalho, M, Wobeto, C, & Andrade, N. (2006). Development and evaluation of an edible antimicrobial film based on yam starch and chitosan. Packaging Technology and Science, 19 (1), 55–59. doi:10.1002/pts. 713
Fajardo, P., Martins, J. T., Fucinos, C., Pas-trana, L., Teixeira, J. A., & Vicente, A. A. (2010). Evaluation of a chitosan-based edible film as carrier of natamycin to im-prove the storability of Saloio cheese. Jour-nal of Food Engineering, 101 (4), 349–356. doi:10.1016/j.jfoodeng.2010.06.029
Geraldine, R. M., Ferreira Soares, N. d. F., Botrel, D. A., & Goncalves, L. d. A. (2008). Characterization and effect of edible coat-ings on minimally processed garlic qual-ity. Carbohydrate Polymers, 72 (3), 403– 409. doi:10.1016/j.carbpol.2007.09.012 Guarda, A., Rubilar, J. F., Miltz, J., & Galotto,
M. J. (2011). The antimicrobial activity of microencapsulated thymol and carvacrol.
International Journal of Food Microbiol-ogy, 146 (2), 144–150. doi:10 . 1016 / j . ijfoodmicro.2011.02.011
Hammer, K., Carson, C., & Riley, T. (1999). Antimicrobial activity of essential oils and other plant extracts. Journal of Applied Microbiology, 86 (6), 985–990. doi:10.1046/ j.1365-2672.1999.00780.x
Jayaprakasha, G., Selvi, T, & Sakariah, K. (2003). Antibacterial and antioxidant ac-tivities of grape (Vitis vinifera) seed ex-tracts. Food Research International, 36 (2), 117–122. doi:10 . 1016 / S0963 - 9969(02 ) 00116-3
Jumaa, M, & Muller, B. (1999). Physicochemical properties of chitosan-lipid emulsions and their stability during the autoclaving pro-cess. International Journal of Pharmaceu-tics, 183 (2), 175–184. doi: 10.1016/S0378-5173(99)00086-1
Jung, E. J., Youn, D. K., Lee, S. H., No, H. K., Ha, J. G., & Prinyawiwatkul, W. (2010). Antibacterial activity of chitosans with dif-ferent degrees of deacetylation and viscosi-ties. International Journal of Food Science and Technology, 45 (4), 676–682. doi:10 . 1111/j.1365-2621.2010.02186.x
Kim, K. W., & Thomas, R. L. (2007). An-tioxidative activity of chitosans with vary-ing molecular weights. Food Chemistry, 101 (1), 308–313. doi:10.1016/j.foodchem. 2006.01.038
Lambert, R., Skandamis, P., Coote, P., & Ny-chas, G. (2001). A study of the minimum inhibitory concentration and mode of ac-tion of oregano essential oil, thymol and carvacrol. Journal of Applied Microbiology, 91 (3), 453–462. doi:10.1046/j.1365- 2672. 2001.01428.x
Majo, D., Guardia, M., Giammanco, S., Neve, L., & Giammanco, M. (2008). The antioxidant capacity of red wine in relationship with its polyphenolic constituents. Food Chemistry, 111 (1), 45–49.
Marino, M, Bersani, C, & Comi, G. (2001). Impedance measurements to study the an-timicrobial activity of essential oils from Lamiaceae and Compositae. International Journal of Food Microbiology, 67 (3), 187– 195. doi:10.1016/S0168-1605(01)00447-0
Myers, R., & Montgomery, D. (1995). Experi-ments with mixtures. In response Surface Methodology, Process and Product opti-mization Using Designed Experiments. pp. 535-623. New York: Wiley Interscience. Ojagh, S. M., Rezaei, M., Razavi, S. H., &
Hos-seini, S. M. H. (2010). Effect of chitosan coatings enriched with cinnamon oil on the quality of refrigerated rainbow trout. Food Chemistry, 120 (1), 193–198. doi:10.1016/j. foodchem.2009.10.006
Park, S., & Zhao, Y. (2004). Incorporation of a high concentration of mineral or vitamin into chitosan-based films. Journal of Agri-cultural and Food Chemistry, 52 (7), 1933– 1939. doi:10.1021/jf034612p
Park, S., Stan, S., Daeschel, M., & Zhao, Y. (2005). Antifungal coatings on fresh straw-berries (Fragaria x ananassa) to control mold growth during cold storage. Journal of Food Science, 70 (4), M202–M207. Pastrana-Bonilla, E, Akoh, C., Sellappan, S, &
Krewer, G. (2003). Phenolic content and antioxidant capacity of muscadine grapes. Journal of Agricultural and Food Chem-istry, 51 (18), 5497–5503. doi:10 . 1021 / jf030113c
Paulus, W. (1993). Directory of Microbicides for the Protection of Materials. A Handbook, pp. 496. The Netherlands: Springer. Perumalla, A. V. S., & Hettiarachchy, N. S.
(2011). Green tea and grape seed extracts - Potential applications in food safety and quality. Food Research International, 44 (4), 827–839. doi:10 . 1016 / j . foodres . 2011.01.022
Pintore, G, Usai, M, Bradesi, P, Juliano, C, Boatto, G, Tomi, F, . . . Casanova, J. (2002). Chemical composition and antimi-crobial activity of Rosmarinus officinalis L. oils from Sardinia and Corsica. Flavour and Fragrance Journal, 17 (1), 15–19. doi:10 . 1002/ffj.1022
Pranoto, Y, Rakshit, S., & Salokhe, V. (2005). Enhancing antimicrobial activity of chi-tosan films by incorporating garlic oil, potassium sorbate and nisin. LWT-Food Science and Technology, 38 (8), 859–865. doi:10.1016/j.lwt.2004.lwt.2004.09.014
Rabea, E., Badawy, M., Stevens, C., Smagghe, G, & Steurbaut, W. (2003). Chitosan as an-timicrobial agent: Applications and mode of action. Biomacromolecules, 4 (6), 1457– 1465. doi:10.1021/bm034130m
Rhodes, P., Mitchell, J., Wilson, M., & Melton, L. (2006). Antilisterial activity of grape juice and grape extracts derived from Vitis vinifera variety Ribier. International Jour-nal of Food Microbiology, 107 (3), 281–286. doi:10.1016/j.ijfoodmicro.2005.10.022 Rodriguez Vaquero, M. J., Alberto, M. R., &
Manca de Nadra, M. C. (2007). Influence of phenolic compounds from wines on the growth of Listeria monocytogenes. Food Control, 18 (5), 587–593. doi:10 . 1016 / j . foodcont.2006.02.005
Scalbert, A. (1991). Antimicrobial Properties Of Tannins. Phytochemistry, 30 (12), 3875– 3883. doi:10.1016/0031-9422(91)83426-L ˇ
Segvi´c-Klari´c, M., Kosalec, I., Masteli´c, J., Pieckov´a, E., & Pepeljnak, S. (2006). Anti-fungal activity of thyme (Thymus vulgaris L.) essential oil and thymol against moulds from damp dwellings. Letters in Applied Microbiology, 44 (1), 36–42.
Shi, J., Yu, J., Pohorly, J., & Kakuda, Y. (2003). Polyphenolics in grape seeds-biochemistry and functionality. Journal of Medicinal Food, 6 (4), 291–299.
Shoko, T., Soichi, T., Megumi, M., Eri, F., Jun, K., & Michiko, W. (1999). Isolation and identification of an antibacterial compound from grape and its application to foods. Nippon Nogeikagaku Kaishi, 73 (2), 125– 128.
Sivropoulou, A, Papanikolaou, E, Nikolaou, C, Kokkini, S, Lanaras, T, & Arsenakis, M. (1996). Antimicrobial and cytotoxic activ-ities of Origanum essential oils. Journal of Agricultural and Food Chemistry, 44 (5), 1202–1205. doi:10.1021/jf950540t
Smith-Palmer, A, Stewart, J, & Fyfe, L. (1998). Antimicrobial properties of plant essential oils and essences against five important food-borne pathogens. Letters in Applied Microbiology, 26 (2), 118–122.
Sokmen, A, Gulluce, M, Akpulat, H., Dafer-era, D, Tepe, B, Polissiou, M, . . . Sahin, F. (2004). The in vitro antimicrobial and
antioxidant activities of the essential oils and methanol extracts of endemic Thymus spathulifolius. Food Control, 15 (8), 627– 634. doi:10.1016/j.foodcont.2003.10.005 Statgraphics Centurion XV software. (2006).
Version 15.2. 05. Statistical graphics corp. Warrenton, Virginia.
Thuille, N, Fille, M, & Nagl, M. (2003). Bac-tericidal activity of herbal extracts. Inter-national Journal of Hygiene and Environ-mental Health, 206 (3), 217–221. doi:10 . 1078/1438-4639-00217
US Food and Drug Administration. (2006). Database of select committee on GRAS substances (SCOGS) Reviews.
Vaara, M. (1992). Agents that increase the per-meability of the Outer-MembranE. Micro-biological Reviews, 56 (3), 395–411.
Veldhuizen, E., Tjeerdsma-Van Bokhoven, J., Zweijtzer, C, Burt, S., & Haagsman, H. (2006). Structural requirements for the an-timicrobial activity of carvacrol. Journal of Agricultural and Food Chemistry, 54 (5), 1874–1879. doi:10.1021/jf052564y
Xia, E.-Q., Deng, G.-F., Guo, Y.-J., & Li, H.-B. (2010). Biological Activities of Polyphe-nols from Grapes. International Journal of Molecular Sciences, 11 (2), 622–646. doi:10. 3390/ijms11020622