GENERATIONAL AND AGE DIVERSITY IN A PORTUGUESE
HOTEL CHAIN
Rita da Silva Lopes Milho
Dissertation submitted as partial requirement for the conferral of Master of
Science in Human Resource Management
Supervisor:
Doutora Sara Cristina Moura da Silva Ramos, Assistant Professor ISCTE Business School – Instituto Universitário de Lisboa
I
Acknowledges
First of all, I would like to thank to my special thesis supervisor Professor Sara Ramos, that every time gave me an amazing support and was always available for me. For all the hours spent, for all the calls, messages, email and meetings that we had. Always comprehensive, friendly, worried and nice to me, shared her ideas and absolutely guided me through this year. A big thank to my biggest support and encouragement.
To Inês Sousa that, with no necessity or obligation at all, helped me very time I needed and listen my outpourings with inexhaustible patience. For the lots of hours spent with me and the support in various phases of the study. She was basically my co-supervisor and was always my shelter. Without Inês I would never reach this goal with confidence.
Thank you to all of my family and friends. Thanks to my boyfriend, my parents, my brother and all the rest of the family for the support and understanding shown during this time. I promise to reward them by the time I have been missing.
To my work colleagues and my chief that understood my absences and hard days, giving me them support, ideas and encouragement. They always believed even more than me.
Last but not least, a huge acknowledgment to my wonderful friends Inês, Catarina and Joana that always motivated and trusted in me, as I trusted in them. Thank you my dears!
II
Abstract
Having three generations working together, side by side, is a great challenge to organizations of today, not only in Portugal but in almost every country of European Union.
Our aim with the present study was to compare the actual versus perceived differences between generations, in terms of some workplace characteristics. We also aimed to test if Age Diversity Climate, a recent construct on literature, was related to Commitment. Once our study is focused only on tourism sector, to study the concepts and theories mentioned above we applied a survey on a Portuguese hotel chain, where we had a total of 98 participants.
Our main results reported that the employees of diverse generations have more perceived differences between them than actual ones. This probably leads to the conclusion that rooted stereotypes prevail above the actual differences. Another important result showed that Age Diversity Climate is a good predictor for Commitment whereby the company should focus its attention on promoting Human Resources Management practices adequate to all the generation cohorts. However, the company should give a bit extra emphasis on practices directed to older workers, once this generation value it more than others.
The major limitation of our study is that the analyzed sample is small and could be not representative of the rest of the company, and of the other organizations present in Tourism sector. We suggest that hereafter the future research could test these differences and correlations on a more extensive target and confirm, or not, our results and conclusions.
III
Resumo
Ter três gerações a trabalhar juntas, lado a lado, é um dos maiores desafios das organizações hoje em dia, não só em Portugal como na restante União Europeia.
O nosso objetivo com o presente estudo é comparar as diferenças reais com as differenças percebidas entre gerações, em termos de características do local de trabalho. Também pretendemos testar se o Clima de Diversidade Etária, um construto recente na literatura, está relacionado com o Compromisso. Uma vez que o nosso estudo é focado unicamente no setor do Turismo, para analisar estas temáticas dirigimos um questionário a uma cadeia hoteleira portuguesa, onde participaram 98 trabalhadores.
Os nossos principais resultados reportaram que os colaboradores das várias gerações percecionam mais diferenças do que as que realmente existem entre si. Outro resultado importante mostra que o Clima de Diversidade Etária é um bom preditor do Compromisso, pelo que a empresa deve focar-se em promover práticas de Recursos Humanos para todos os grupos geracionais. No entanto, a empresa deve focar-se um pouco mais em práticas direcionadas aos mais velhos, pois estes parecem valorizar este Clima de Diversidade Etária mais que as restantes gerações.
A maior limitação do nosso estudo deve-se ao facto de termos uma amostra reduzida que poderá não ser representativa da restante empresa ou mesmo de outras organizações do Turismo. Sugerimos que em estudos futuros sejam testadas estas diferenças e correlações num contexto mais extenso de forma a confirmar, ou não, os nossos resultados e conclusões.
IV
Index
Introduction 1
Chapter I - Literature Review 2
1.1. General relevance 2
1.2. Demographic changes and generations at work 5
1.3. Actual Differences versus Perceived Differences 6
1.4. Age Similarity Preference 7
1.5. Commitment and Age Diversity Climate 9
Chapter II – Methodology 13
2.1 Participants 13
2.2 Procedures 13
2.3. Measures 14
Chapter III – Results 16
Chapter IV – Discussion 25
Conclusion 30
References 32
Annexes 37
Annex A – Survey 37
Annex B – SPSS Outputs 48
V
Figures index
Figure 1.1.1. Age structure of the population by large age groups (%), Portugal, 1970-2014. 3
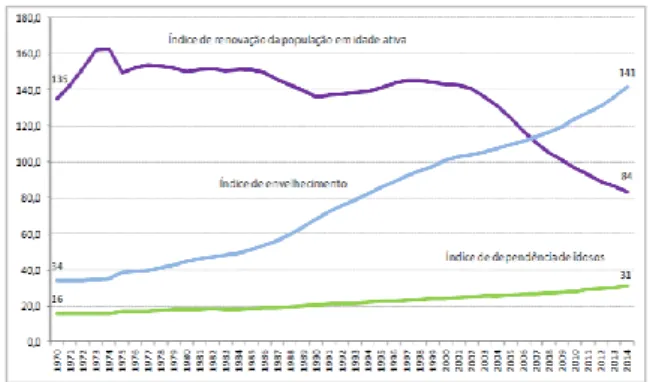
Figure 1.1.2. Aging index, elderly dependency ratio and refresh rate of the working age population, (Nº), Portugal, 1970-2014. 3
Figure 1.1.3. % of whole economy GDP – Direct Contribution of Travel & Tourism to GDP 4
Tables index
Table 4.1. Workplace characteristics with significant real differences between Generations 16
Table 4.2. Workplace characteristics with significant perceived differences, about what Boomers value, between Generations 18
Table 4.3. Workplace characteristics with significant perceived differences, about what GenY value, between Generations 19
Table 4.4. Workplace characteristics with significant perceived differences, about what GenX value, between Generations 20
1
Introduction
Age is one of the most salient characteristics of the population and it has been studied for many years. However, studying age is becoming each day more important once this demographic characteristic has been suffering many changes over time. Currently, research has been studying the concept of ageing. Ageing is, according to International Labor Organization (ILO) (in Magazine World of Work, 2009), a process which rises the percentage of old people within the total population. Ageing is one of the major problems of this century and one of the markets that it is impacting is labor market. According to International Labor Organization (ILO) (in Magazine World of Work, 2009), this issue affects or will affect both developed and developing countries and it is a thematic present on the agendas of diverse meetings of many organizations. The ageing population is already influencing Portugal, as the entire European Union. It is a phenomenon that rises from the combination of various tendencies being two of the most important: the birth decline and increased longevity. Logically, if the population in general is getting older, the workforce will follow the same tendency. By the fact that youth is simultaneously postponing the start of their careers (increasing their qualifications) and the retirement age is continuously increasing, the medium age of the working age population is definitely increasing. Due to the mentioned trends, the workforce starts to be composed by employees from around 20 years old until maybe 66. This will lead to a situation where we can have three or even four generations working together, which could raise other issues. Literature proves us that our ideas, opinions, desires, and motivations change with our age. So, in order to efficiently manage human resources it is needed to continuously study these themes in various contexts.
The present dissertation pretends to contribute to learn more about the generations and their differences, preferences and expectations. It is integrated on an International Study that is being conducted in different countries by a multidisciplinary research team (coordinated by Professor Rhetta Standifer).
2
I.
Literature Review
1.1. General relevance
Nowadays, one of the most evident tendencies of demographic evolution is related to an ageing population (Ramos, 2015). Not just in Portugal, but in the entire European Union (EU), the population is getting older and the medium age is highly increasing. This phenomenon is both influenced by the birth decline and increased longevity (INE, 2015). Accordingly to the “World Population Ageing 2013” (INE, 2015), population ageing is progressing rapidly in many of the EU countries.
These changes in demographic characteristics are deeply important to Portugal once, according to INE (Statistics Portugal) and Pordata, the country has:
- The 5th higher ageing index (143,9% in 2015 – Pordata, 2016)
- The 3rd lower renewal rate of the working age population (that represents the
number of people with the age of entry in the labor market and the number of people with the age of leaving the market – was 84 (number) in 2014 – INE, 2015)
- The 3rd largest increase in median age between 2003 and 2013 (increasing 4,1
years, from 38,5 to 42,6 median age – Pordata, 2016)
- The 4th higher proportion of elderly (20,3% in 2014 – INE, 2015)
Mentioning the report “World Population Ageing 2013” (INE, 2015), “the global proportion of people with more than 60 years old increased from 9,2% in 1990 to 11,7% in 2013, and is expected than continues to grow, reaching 21,1% in 2050”. In numbers, this means that people with more than 60 years old could double and the elders with more than 80 years could became the triple, during 2050.
Specifically in Portugal, it was found three consequences of the simultaneously “birth fall” and increased longevity: decrease of younger population (0 to 14 years old), decrease of working-age population (15 to 64 years old) and increase of elderly people (more than 65) (INE, 2015). All these tendencies, show that ageing is one of the Portuguese bigger social issues to the next years.
3 As Ramos (2015) mentioned, these demographics changes lead to a potentially growing of medium age to working population, which highlights the need to rethink, globally, employment practices and the organizational human resource management policies.
All the facts previously presented show the social relevance behind the current study, and support the importance of this thematic. However, it is not only the social relevance that matters but also its theoretical pertinence. Therefore, one considers that ageing at work and generational discrimination are issues still understudied (when compared with gender or ethnical differences that have much more support on the literature). Taking this into account, there is also no consensus about how Human Resources professionals should deal with this topics, namely with the differences between generational cohorts which, day by day, have increasingly work together. These need of having different ageing groups working side by side reveals another difficulty to Human Resources Departments, which Ramos (2015) alerts that is related to the changes in motivations of the employees during their age settings, being these aspects still understudied.
The main purpose of our research, is trying to provide some important inputs to explain these topics and also try to explore some guidelines to Human Resources Management in Portugal. The current study will just focus on Tourism sector once, as Sezerel and Tonus (2014) mentioned in their study, hotel industry should be a field to observe. Due to its environment, the hospitality industry – especially the hotel sector – is considered to be multicultural and composed of a greater diversified workforce (…) these features positions the hotel industry as a promising field to study (Sezerel & Tonus, 2014). Simultaneously, to the fact that Tourism sector – more specifically hotel – be an area to examine in terms of generations, this sector is also growing in Portugal. According to data Figure 1.1.1. Age structure of the population by large age
groups (%), Portugal, 1970-2014
(Source: INE, IP, Annual estimates of the resident population, 2014)
Figure 1.1.2. Aging index, elderly dependency ratio and refresh
rate of the working age population, (Nº), Portugal, 1970-2014
4 from UNWTO (the World Tourism Organization), there was an increasing of 4,4% on international tourists during 2015. The revenues from this increment, to Portugal, were 9,3% higher than in 2014, according to Banco de Portugal (INE, 2015). In INE (2015), is possible to see that the first semester of 2016 are also following the growing tendency, increasing 10,2% over the same period of 2015, being this June the best since there is records (last 10 years).
According to World Travel & Tourism Council – WTTC – (cit in “Diário de Notícias”, 2016), in the ends of 2015, tourism and transportation represented 7,9% of employment in Portugal (363 thousands of jobs). To the present year, WTTC expected that the number of employees raises to 441 thousand, which will represent more 4,6% jobs than the year before. However, the total contribution of this industry should be even bigger, reaching 915 thousand jobs (22%) divided by: hotels, travel agencies, transports (except shuttle journeys), airlines and entertainment business for tourists. The WTTC reveals that, in the last five years, this sector is growing at a faster rate than the own economies. About the impact of tourism and travels in GDP (Gross Domestic Product), WTTC estimates that during 2015 it has contributed around 11,3 billions of euros (6,4% of richness). For 2016, it is supposed to increase to values of 14,6 billion (more 2,2% than 2015). All these characteristics of Tourism sector makes it so special and interesting to study.
Figure 1.1.3. % of whole economy GDP – Direct Contribution
of Travel & Tourism to GDP (Source: WTTC, 2016)
5 1.2. Demographic changes and generations at work
These demographic evolutions have been impacting not only the society in general, but also the organizations and their workforce. By the fact that the older employees need to work longer because the retirement age is continuously getting higher, the consequence is the increasing of medium working age population. These changes are leading to a moment where we have three or even four generations working together (Lester, Standifer, Schultz & Windsor, 2012), and that could raise other issues and difficulties to human resources management teams. Lester et al (2012) also mentioned that nowadays with such a diverse workforce, it is necessary for different generations to work side by side and interact together effectively. However, not everybody perceive, accepts and value the HRM policies in the same way and different groups of workers deal with them differently (Ramos, 2015). Obviously, these dissimilarities will lead into some issues, once employees from various generations may have different desires and expectations of what they want from the workplace (Lester et al, 2012). The same authors alsoreferred, these differences could be about intrinsic and / or extrinsic factors. Maybe now becomes the question: But after all, what is a generation? There are many definitions to Generation varying with the authors and seasons. One of them, emerged during 1998 and was reinforced in 2007, defined Generations as a social construction in which individuals born during a specific time period experience, and are influenced by, historic and social circumstances in such a way that these experiences differentiate one cohort from another (Jurkiewicz & Brown, 1998; Sessa, Kabacoff, Deal, & Brown, 2007).
About the division of employees in various generations, the authors have also many opinions. Is frequently accepted by the majority of the authors that are four generation cohorts in society nowadays. However, there are some different interpretations about the time range used to characterize each group and its designation (Faria, 2014). One that revealed more consensus and was used in the present dissertation, is the division that Schullery (2013) mentioned: Traditionalists (born prior to 1946), Boomers (born between 1946 and 1964), Generation X (born between 1965 and 1981) and Generation Y or Millennials (born after 1982). Being in 2016, Traditionalists will be workers with more than 70 years old, so this generational cohort will not be taking into this study. So, was assumed that currently we just have three generations working together.
6 1.3. Actual Differences versus Perceived Differences
Now that we already defined Generation and divided the employees according to it, we can question: are these three generations so different from each other? Or will they
perceive more differences, between them, than the actual ones? Schullery (2013)
defended that were found significant differences regarding job values between Generation X and Millennials. Results of Schullery (2013) shows that Generation X is the generation that give more importance to extrinsic components (such as salary). Lester et al (2012) found differences between generations in terms of email communication, social media and fun at work, being Generation Y the one that most values these three components at the workplace. The same authors revealed that Boomers significantly prefer face-to-face communication with the other colleagues, when compared to Generations X and Y. In contrast, Lester et al (2012) state that an investigation of perceptual dissimilarities across the generations highlights the mistaken opinions each generation holds from the other. Several of these misconceptions are line up with the strong stereotypes that are rooted in our culture and lifestyle, and are basically related to the way workers communicate. According to Lester et al (2012) reading, what all five actual value differences (founded in their study) share each other is that they are expected to affect how coworkers interact with one another. These interactions affect the opinions they hold and consequently may lead them to reach an incorrect conclusion that emphasizes generational stereotypes (2012). If we agree that are much more perceived differences between generations than the real ones, it seems logical that both employees and managers could benefit from this awareness (Lester, 2012). The more similarities workers find between them, the more they approach each other. Having this opportunity, we decided to study the thematic for trying to prove this statement and approach generations. So, the first hypothesis that will be tested, is:
Hypothesis 1: There are more perceived value differences between generations than actual value differences
7 1.4. Age Similarity Preference
As it was referred above, many companies currently have three or even four generations working side by side, and as Avery, McKay and Wilson (2007) revealed, the older is becoming the workforce, more diversity will emerge in it. However, this situation leads to another possible issue related to the hypothesis of employees do not like or want to engage in age-diverse interactions, preferring to work with people similar to their age. This preference (or not) to work with others similar to the own age was described by Standifer et al (2012) by the concept of Age Similarity Preference (ASP).
The Age Similarity Preference could be explained in different ways. To Standifer et al (2013) some possible explanations to why workers have such a preference lie in relational demography and theories as similarity-attraction, self-categorization, and social identity theory. Social demography holds that individuals compare their external characteristics, namely age or gender, with their colleagues and that perceived similarities influence their work attitudes and behaviors (Hogg & Terry, 2000; McGuire et al., 2007). From this comparison, individuals categorize themselves and others into groups using for that meaningful and salient dimensions to them, as age (Avery et al., 2007). These categories could be applied when workers intend to distinct themselves from others, defining them and coworkers as in- or out- group members (Avery, McKay & Wilson, 2007). Having these statements into account, we can say that “age cohorts” are one of the possible social categorizations recognized in literature (Ashforth & Mael, 1989; Tajfel & Turner, 1985). Standifer et al. (2013) also state that social identity theory would propose that, when interacting with others an out-group association will result in a higher possibility of negative stereotyping that emphasizes differences instead of similarities (Ashforth & Mael, 1989; Tajfel & Turner, 1985).
According to Avery et al (2007), some consequences of higher age similarity are a better technical communication within groups (Zenger & Lawrence, 1989), less tendency to turnover (O’Reilly, Caldwell, & Barnett, 1989; Sacco & Schmitt, 2005), increased organizational citizenship behavior (Chattopadhyay, 1999; Riordan & Weatherly, 1999), reduced conflict (Jehn, Chadwick, & Thatcher, 1997; Pelled, Xin, & Weiss, 2001), greater involvement (Hobman, Bordia, & Gallois, 2004), higher peer-rated performance (Zalesny & Kirsch, 1989), and enhanced job challenge and person– group fit (Kirchmeyer, 1995).
8 Kunze et al (2013) reinforced that age similarity leads to better communication both within a working group and also between employees (with similar age) of different groups.
As Standifer et al (2013) argue that these groups, based on age, allow individuals to make attributions about coworkers, their values, and their attitudes. Thus, the ones identified as “similar” are assumed to hold similar values and attitudes (Avery et al, 2007; Tajfel & Turner, 1985). However, Avery et al (2007) highlights that being dissimilar to one’s coworkers in terms of age makes it a characteristic even more relevant (Randel, 2002), which consequently leads employees to pay greater attention to age differences and identify more with their similar-age peers than with their coworkers in general (Chattopadhyay, Tluchowska, & George, 2004; Riordan & Weatherly, 1999). In conclusion, co-workers with similar ages tend to attract each other and create groups based on similar stages of private lives (eg: having young children) and /or on historical moments (eg: growing up in the internet age), leading to more groups inside organizations (Lawrence, 1988 – cit in Kunze et al, 2013). The social categorization referred above, leads, according to Kunze et al (2013), to higher interactions between age peers, being them professional or personal ones.
The question that rises now is if the Age Similarity Preference correlates with age and, if there is correlation, is the preference per pears more frequent among younger or older workers? To Standifer et al (2013), Age Similarity Preference reveals to be more frequent among younger employees than in older ones. So, the second hypothesis of this dissertation is:
Hypothesis 2: ASP (Age Similarity Preference) is negatively correlated with age: is higher among young employees than in older ones
9 1.5. Commitment and Age Diversity Climate
Even ten years ago, in 2006, Burke and Ng stated that “the trend towards managing diversity is no longer a “nice to do” but an economic imperative (…) organizations should ensure that valuable human resources are not wasted because of discriminatory practices”. This requirement of fair and nondiscriminatory Human Resources Management Policies is each day more important for the companies, as consequence of the mentioned demographic changes that are happening in European Union, and specifically in Portugal. The way people of different ages behave in the organizations is, in general, related to the HRM practices of the company (Combs, Liu, Hall, & Ketchen, 2006; Schalk et al, 2010). HRM practices are, according to Pinto et al (2015), tools that support the management of attitudes, behaviors and performance of human resources in order to achieve organizational goals. According to Kunze, Boehm and Bruch (2013), another great influencer of how workers behave in organizations is the way top managers perform and hold or not stereotypes. As Carmeli (2008) said top managers’ attitudes and actions are understood as desired behaviors among employees. Taking this statement into account, Kunze et al (2013:414) completed that “negative age stereotypes of the top managers and diversity-friendly human resource (HR) policies (…) might aggravate and attenuate, respectively, the social-identity and social-categorization processes negatively affecting performance in age-diverse organizations”.
To Finkelstein and Farrell (2007), there are three dimensions of age bias: “stereotyping” (there is the cognitive component), “prejudice” (there is the affective component), and “discrimination” (there is the behavioral component and the one focused on this study). To Kunze, Boehm and Bruch (2013:414), “high levels of age diversity are leading to social fragmentation between different age groups, fostered by social identity (Tajfel & Turner, 1986) and social categorization processes (Turner, 1985 – cit in Kunze et al, 2013), which may then lead to increased levels of discriminatory behavior between different age subgroups impairing organizational performance (Kunze et al, 2011)”. As Guillaume et al (2013 – cit in Bieling & Dorozalla, 2014) mentioned, organizations should provide a diversity climate in order to potentiate the benefits of diversity and diminish its negative effects. Focusing on the growing of age diversity, Guillaume et al (2013 – cit in Bieling & Dorozalla, 2014) deepened his previous explanation and stated that organizations need to implement a climate in which employees of all generations are
10 seen positively to get “diversity at work to work”. In a more general term, Sezerel and Tonus (2014:355) defined diversity climate as “the perceptions and attitudes of individuals towards the differences among employees in the workplace”. Specifically, about age diversity climate, Bieling and Dorozalla (2014) clarified it as “employees' individual perceptions of the policies and practices that communicate the extent to which fostering age diversity and eliminating age-related discrimination is a priority in the organization (Pugh et al., 2008 – cit in Bieling and Dorozalla, 2014), in determining employee attitudes and behavior.”
So, raises the question: Are age diverse companies generally promoting a positive or a negative age climate? To Kunze et al (2013) in age-heterogeneous companies (…) age is expected to become a more relevant factor of social classification, which increase negative age-discrimination climate, described on social identity (Tajfel & Turner, 1986) and social categorization arguments (Turner, 1985 – cit in Kunze et al, 2013) like was mentioned on previous hypothesis support. Age discrimination climate is basically the opposite of age diversity climate but in the negative approach. One possible definition for negative age-discrimination climate was presented by Kunze et al (2011:266) and says “it is an emergent construct that reflects group members’ shared perceptions (Kozlowski & Klein, 2000 – cit in Kunze et al, 2011) of the fairness or unfairness of organizational actions, procedures, and behavior towards different age groups”. Have this definition into account, Kunze et al (2013) assumed that negative age-discrimination climate could have two major explanations: organizational procedures and systems that are unfair (e.g. the firm’s HR system) and/or interpersonal interactions and occasions (e.g. between employees or between employees and supervisors).
The creation of subgroups based on age, will lead into some problems and possible division of employees. For example, as Tajfel’s (1970 – cit in Kunze et al, 2013) referred the appearance those subgroups almost automatically leads to in-group favoritism and out-group discrimination. Kunze et al (2013) even develops more and defends that when occurs such grouping, a drop in social integration might happen, also as mutual feelings of age-based discrimination. For example, supervisors and/or colleagues could not promote a fair allocation of tasks between different generations, and career opportunities or performance assessments might be seriously age-biased. Ultimately, if the social integration among different age cohorts is low, age-biased practices, procedures, and behaviors become more acceptable and frequent in the organization, ending in a global climate of age discrimination (Kunze et al, 2013).
11 As mentioned above, the two main organizational factors that we assumed to higher contribute (negatively or positively) to discriminatory behaviors are: age stereotypes of the top managers and diversity-friendly human resource policies. By opposite, diversity climate is promoted through leadership behaviors and HRM practices (Bieling & Dorozalla, 2014). Focusing on the second one, Kooij et al (2010) stated that employees understand the HRM practices as an investment in them and as a recognition of their performance and efforts. So workers feel they should return that investment through positive attitudes towards the organization (Kooij et al, 2010). An outcome of the support perceived from an organization is the Commitment of employees (Eisenberger, Huntington, Hutchinson & Sowa, 1986; Stettoon, Bennett & Liden, 1996 – cit in Pinto, Ramos & Nunes, 2015). A possible definition of commitment, was state by Meyer and Herscovitch (2001), and says it is a “force that binds an individual to a course of action of relevance to one or more targets”. As mentioned by Jaros (2007), there is a
three-component model of commitment, developed by Meyer and Allen in 1997, which proposes
that Commitment has three simultaneous mindsets: Affective, Normative and Continuance organizational commitment. Jaros (2007:7) characterized this three components as: Affective Commitment as the “commitment based on emotional ties the employee develops with the organization primarily via positive work experiences”; Normative Commitment as the “commitment based on perceived obligation towards the organization (as norms of reciprocity)”; and, Continuance Commitment as the “commitment based on the perceived costs, both economic and social, of leaving the organization”. Although commitment is considered to be composed by these three items, Meyer et al (2002) declared that Affective Commitment Scale (ACS) is a great predictor of turnover when compared to variables as Normative Commitment Scale (NCS) or Continuance Commitment Scale (CCS). Previously, Meyer and Herscovitch (2001) had already defended that Affective Commitment Scale, tends to strongly correlate, in a negative way, with absenteeism and, positively, with job performance and citizenship behaviors. Having these citations into account, one have decided to focus on study only the Affective Commitment, once this component in faced as the best predictor of the leaving intention.
According to Ramos (2015), the older workers are generally more satisfied and committed in their work. Also as Lyons and Kuron (2013) stated that younger employees demonstrate less organizational commitment. Similarly to the previous mentioned
12 authors, Kumar and Giri (2009) also stated that aged employees show a greater organizational commitment. Even Brooke and Taylor (2005) and Linz (2004) – both cit in Chi, Maier & Gursoy (2013) – referred that the level of organizational commitment tends to rise with employees age and its position on the organization. Finally, also D’Amato and Herzfeldt (2008) reinforced that the more older are the members of the group, the higher are their commitment with the organization.
However, this statement that older employees are more commitment than younger ones could be influenced by the age diversity climate and/or age discrimination climate. Social exchange theory defends that age diversity climate affects the perceived organizational support which has positive long-term effects on performance and job satisfaction (Bieling & Dorozalla, 2014). By other side, it has been confirmed by many authors that job satisfaction is the main predictor of employees’ commitment (Knight, Durham & Locke, 2001; Ingersoll, 2001; Ingersoll, 2006 – cit in Ahmad & Ibrahim, 2015). So, logically, we can assume that age diversity climate should influence employees’ commitment. Madera, Dawson and Neal (2013) said that when is perceived a negative diversity climate in the organizations, easily starts conflict and that will decrease the organizational commitment of the employees. According to Kunze et al (2013), workers that perceive age discrimination at the office are expected to return lower levels of emotional attachment. Still, it is important taking into account that to older employees that face higher threats of age-related discrimination, age diversity climate probably becomes a more important signal of organizational support than to younger employees (Bieling & Dorozalla, 2014). Also Kunze et al (2013:417) cited “if older and younger employees constantly perceive age-based discrimination within in their organization, it is very likely that this perception is not limited to the individual level; but rather, through processes of contagion (Salanova et al, 2005 – cit in Kunze et al, 2013) and socialization (Schneider, 1987 – cit in Kunze et al, 2013), it might spread throughout the entire organization, cumulating in high levels of shared perceptions of a negative age-discrimination climate”.
So, according with as been quoted, the third and final hypothesis testing in the current project, is:
Hypothesis 3: Older employees are more commitment with their company than younger ones, if they perceive a positive age diversity climate
13
II.
Methodology
2.1. Participants
To test the above hypotheses, we gathered data from a Hotel Chain. This company has 27 hotels distributed by Portugal (20) and Brazil (7). The Hotel Chain integrates the ranking of the 207 biggest hotel companies in the world and, one of its societies, belongs to the Rating 1 of Portuguese Companies. This firm was built in 1986 and the capital is wholly Portuguese. The enterprise employs around 2.500 workers, being 1.000 in Portugal. Initially, our sample consisted of 100 participants. However, after a preliminary analysis to the asymmetry of the variables, we found two severe outliers that were taken from the sample. Thus, there were 98 valid subjects, being 49% men and 51% women. We divided the responders by generational cohorts, namely Generation Y (36,7%), Generation X (37,8%) and Boomers (25,5%). Related to participants’ Level of Education, 72,4% completed High School or less, and 27,6% has a “Graduate degree”. Finally, about tenure on current organization: 17,3% “Less than 1 year”, 14,3% “1-3 years”, 11,2% “4-6 years”, 6,1% “7-9 years”, 7,1% “10-12 years”, 18,4% “12-15 years” and 25,5% “more than 15 years”.
2.2. Procedures
The data were collected through a Questionnaire. This survey was delivered to the participants by a paper version. We have chosen this method because of some specific characteristics of sector in analysis (Tourism). The majority of the workers do not have access to a corporative e-mail or computer at their workplace (for example, the chambermaids, cleaners and kitchen workers), and, some of them are not comfortable to use these technologies. According to these issues, and in order to have the most representative sample as possible, the majority of the subjects fulfilled the questionnaire in paper. This method had one big problem related with the time spent. Not just the time consumed by the necessity of visit each hotel, but also the time needed to insert the data for study and working on the results. From the 20 inns of the hotel chain, we selected five to collect data in paper. This choice was based on a geographic criteria and the availability of the investigators to visit the hotels. We have chosen to focus on the five hotels located in Lisbon to go there personally, and collect the answers in paper. However, the paper questionnaires fulfilled were not representative enough to this dissertation. So, facing this
14 difficulty, we choose to distribute the same questionnaire to the rest of the hotel units (out of Lisbon) through a web-based version. This last strategy represented 25% of the responses, being the others 75% collected by paper.
The average time it took the participants to complete the survey was around 20 minutes, and it was always guaranteed the confidentiality and anonymity of the responders. By choosing to distribute the questionnaires in paper, it was raised an anonymity problem related to these subjects. However, to overcome this limitation were used sealed envelopes, so the responders could fulfill and close it immediately, in order that only the research team could see the results.
2.3. Measures
As mentioned above, data were collected through quantitative method: a survey. This form is composed by 27 questions and it is integrated on an International study conducted in different countries by a multidisciplinary research team1. The questionnaire had some measures that will not be focused in this dissertation once, as I previously mentioned, it is integrated on an International Project and, because of it, the survey have more questions than the ones used in the present dissertation. According to this, it will be just explained the measures that were used at this study. From these 27 questions, 6 of them are demographic. For this dissertation, one focused on 7 questions related to the values and preferences of the employees, to their commitment / intention to leave and to the diversity climate of the company.
The first 4 queries are about what “I value” and what “Generations value” (Lester et al, 2012). To evaluate the actual and perceived differences between generations we used the scales already validated and tested by Lester et al. on their study, conducted in 2012, named “Actual versus perceived generational differences at work: An empirical examination”. These scales were already integrated on the survey used as base to this dissertation. It starts by asking to the subject to indicate how important for he/she are the 15 characteristics of the workplace mentioned. These 15 items included (a) teamwork, (b) autonomy, (c) security, (d) professionalism, (e) flexibility, (f) formal authority, (g) technology, (h) face-to-face communication, (i) e-mail communication, (j) social media, (k) structure at work, (l) involvement, (m) continuous learning, (n) fun-at-work, and (o)
15 recognition. The answers followed a six-point Likert’s scale, where 1 = None and 6 =
Fullest Extent. After that, the subject should indicate, through the same scale and for the
same characteristics, how important he/she thinks are those 15 characteristics for an employee of “Boomers” generation. This repeats through the “Generation Y” and “Generation X”.
The next question is about the subjects preferences regarding their Age Similarity Preference and they had to answer also through a six-point Likert’s scale (with 1 =
Strongly Disagree to 6 = Strongly Agree). The questions used to test Age Similarity
Preference were proposed by Standifer and they will be tested in this study. This scale has 5 items and it represents the preference of the subjects to work with people similar to them in terms of age.
Finally, the participants were questioned about their organization. These two last queries follow, once again, a six-point Likert’s scale (1 = Strongly Disagree to 6 = Strongly
Agree). The first one had 6 statements related to the affective commitment of the
employee (Allen & Meyer, 1990). The other one, is about the Age Diversity Climate scale and had 7 items, four of them were retrieved from Bohem, Kunze and Brunch (2014) and three more items were added to account for a) performance evaluation, b) recognition, and c) job demands.
16
III. Results
2Actual and perceived differences on workplace characteristics
Hypothesis 1 proposed that there are more perceived value differences between generations than actual value differences. This hypothesis was analyzed in two phases. First we look for the real differences and then to the perceived ones. To analyze the mentioned differences, it was performed an One-Way ANOVA. However the necessary assumptions to use it (normality of the distribution; and homogeneity of variances) were not verified. Despite this, as our sample was not much skewed, we could use two robust tests, that are resistant to the violation of the stated assumptions: Brown-Forsythe e Welch. The mentioned robust tests were used to identify the significant differences between generations, but after that is crucial to understand between which cohorts exists those dissimilarities. To see this, it was used the post-hoc test: Games-Howell, once it is the most indicated in cases of heterogeneity of variances.
Actual / Real differences
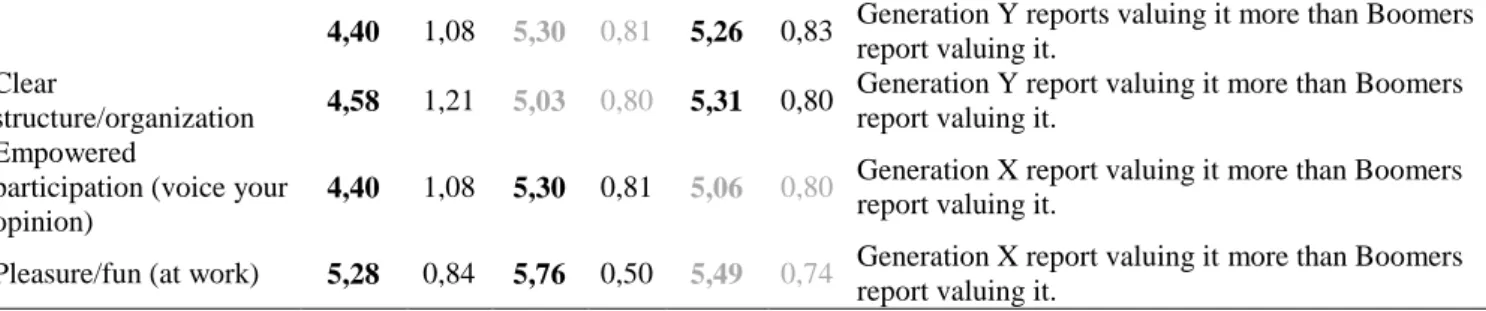
To analyze the actual value differences between generations, we focused on the first question of the survey: “(…) Using the six-point scale, please indicate how important you consider each characteristic to be. (…)”, which basically means, in terms of the participant “which workplace characteristics I value the most”. Based on that question and used the analysis explained on previous paragraph, we found significant differences on the responses gave by each generation cohort on 4 of the 15 items: face-to-face communication (F(2, 93) = 9,001; p < 0,001), clear structure/organization (F(2, 93) = 4,516; p = 0,013), empowered participation (F(2, 94) = 4,278; p = 0,017), and pleasure/fun at work (F(2, 94) = 3,721; p = 0,028). On table 4.1 are described the significant differences found between generations and respective means and standard deviations. Items Boomers Generation X Generation Y Interpretation
Mean SD Mean SD Mean SD
Face-to-face
communication 4,40 1,08 5,30 0,81 5,26 0,83
Generation X reports valuing it more than Boomers report valuing it.
2 We used Statistical Package for the Social Sciences (SPSS), version 23, to analyze the data.
17
4,40 1,08 5,30 0,81 5,26 0,83 Generation Y reports valuing it more than Boomers
report valuing it. Clear
structure/organization 4,58 1,21 5,03 0,80 5,31 0,80
Generation Y report valuing it more than Boomers report valuing it.
Empowered
participation (voice your opinion)
4,40 1,08 5,30 0,81 5,06 0,80 Generation X report valuing it more than Boomers
report valuing it.
Pleasure/fun (at work) 5,28 0,84 5,76 0,50 5,49 0,74 Generation X report valuing it more than Boomers report valuing it.
p-value < 0,05
Table 4.1. Workplace characteristics with significant real differences between Generations
An examination of previous results reveal that Boomers are the generation that reported the lower scores to these items, which means that are the group that values less these characteristics. On the item face-to-face communication, we see that Boomers significantly differ from the other two generation (Generation X and Generation Y), being this group the one that values less this workplace characteristics, oppositely to Generation X that revealed the highest mean. In terms of clear structure/organization, the opinion of Boomers significantly differs from the opinion of Generation Y and about empowered
participation and pleasure/fun (at work) Boomers reported to be dissimilar from
Generation X.
With these results, we see that there are 4, of the possible 15, workplace characteristics where generations reported to detain actual significantly value differences between them.
Perceived differences
To analyze the perceived value differences between generations, we focused on the second, third and fourth questions of the survey: “Using the six-point scale, please indicate how important you think each of the workplace characteristics would be to someone between the ages of 52-70 (…)”, which means “Boomers value”; “Using the six-point scale, please indicate how important you think each of the workplace characteristics would be to someone below the age of 32 (…)”, which means “Generation
Y value”; “Using the six-point scale, please indicate how important you think each of the
workplace characteristics would be to someone between the ages of 33-51 (…)”, which means “Generation X value”.
First we analyzed the significant differences about what Boomers value. Table 4.2 shows the items where the opinions of generational cohorts differ. From the 15 workplace characteristics, there were 4 where apparently Boomers own value differ from what the
18 other two generations think Boomers to value: Security/stability (F(2, 92) = 6,376; p = 0,003), Professionalism (F(2, 93) = 5,920; p = 0,004), Face-to-face communication (F(2, 93) = 6,682; p = 0,002) and Social media (F(2, 92) = 3,194; p = 0,046).
Boomers value Items Boomers Generation X Generation Y Interpretation
Mean SD Mean SD Mean SD
Security/stability
4,91 0,79 5,54 0,69 5,54 0,74 Generation Y reports thinking that Boomers value it
more than Boomers report valuing it.
4,91 0,79 5,54 0,69 5,54 0,74 Generation X reports thinking that Boomers value it
more than Boomers report valuing it. Professionalism
4,88 0,85 5,49 0,61 5,46 0,78 Generation Y reports thinking that Boomers value it
more than Boomers report valuing it.
4,88 0,85 5,49 0,61 5,46 0,78 Generation X reports thinking that Boomers value it
more than Boomers report valuing it. Face-to-face
communication
4,42 0,93 5,27 0,87 5,20 1,05 Generation Y reports thinking that Boomers value it
more than Boomers report valuing it.
4,42 0,93 5,27 0,87 5,20 1,05 Generation X reports thinking that Boomers value it
more than Boomers report valuing it.
Social media 3,71 1,27 3,61 1,54 2,91 1,27 Generation Y reports thinking that Boomers value it less than Boomers report valuing it.
p-value < 0,05
Table 4.2. Workplace characteristics with significant perceived differences, about what Boomers value, between Generations
In terms of Security/stability, Professionalism and Face-to-face communication, both Generation X and Generation Y report thinking that Boomers value it more than they own report valuing it. However, about Social media the Boomers apparently think they value more this characteristic that Generation Y thinks they value it.
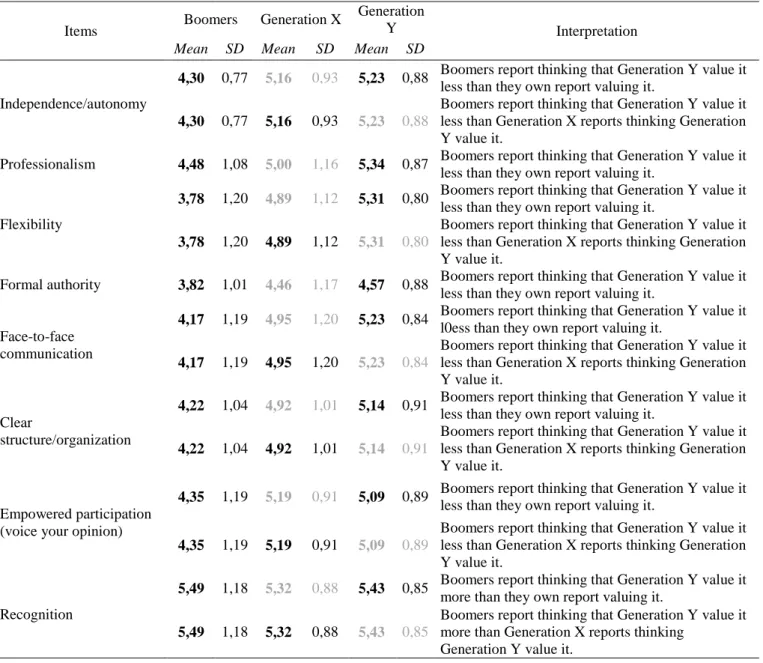
Secondly, we focused on the differences presented to what Generation Y value. Findings are on table 4.3, and they show 8 significant differences from the 15 workplace characteristics in study. The items where generations showed dissimilar opinions about what Generation Y value, were: Independence/autonomy (F(2, 92) = 9,119; p < 0,001), Professionalism (F(2, 92) = 4,791; p = 0,010), Flexibility (F(2, 91) = 15,617; p < 0,001), Formal authority (F(2, 91) = 3,930; p = 0,023), Face-to-face communication (F(2, 92) = 6,792; p = 0,002), Clear structure/organization (F(2, 92) = 6,386; p = 0,003), Empowered participation (F(2, 92) = 5,827; p = 0,004), and Recognition (F(2, 91) = 5,857; p = 0,004).
19
Generation Y value
Items Boomers Generation X
Generation
Y Interpretation
Mean SD Mean SD Mean SD
Independence/autonomy
4,30 0,77 5,16 0,93 5,23 0,88 Boomers report thinking that Generation Y value it
less than they own report valuing it.
4,30 0,77 5,16 0,93 5,23 0,88
Boomers report thinking that Generation Y value it less than Generation X reports thinking Generation Y value it.
Professionalism 4,48 1,08 5,00 1,16 5,34 0,87 Boomers report thinking that Generation Y value it less than they own report valuing it.
Flexibility
3,78 1,20 4,89 1,12 5,31 0,80 Boomers report thinking that Generation Y value it
less than they own report valuing it.
3,78 1,20 4,89 1,12 5,31 0,80
Boomers report thinking that Generation Y value it less than Generation X reports thinking Generation Y value it.
Formal authority 3,82 1,01 4,46 1,17 4,57 0,88 Boomers report thinking that Generation Y value it less than they own report valuing it.
Face-to-face communication
4,17 1,19 4,95 1,20 5,23 0,84 Boomers report thinking that Generation Y value it
l0ess than they own report valuing it.
4,17 1,19 4,95 1,20 5,23 0,84
Boomers report thinking that Generation Y value it less than Generation X reports thinking Generation Y value it.
Clear
structure/organization
4,22 1,04 4,92 1,01 5,14 0,91 Boomers report thinking that Generation Y value it
less than they own report valuing it.
4,22 1,04 4,92 1,01 5,14 0,91
Boomers report thinking that Generation Y value it less than Generation X reports thinking Generation Y value it.
Empowered participation (voice your opinion)
4,35 1,19 5,19 0,91 5,09 0,89 Boomers report thinking that Generation Y value it
less than they own report valuing it.
4,35 1,19 5,19 0,91 5,09 0,89
Boomers report thinking that Generation Y value it less than Generation X reports thinking Generation Y value it.
Recognition
5,49 1,18 5,32 0,88 5,43 0,85 Boomers report thinking that Generation Y value it
more than they own report valuing it.
5,49 1,18 5,32 0,88 5,43 0,85
Boomers report thinking that Generation Y value it more than Generation X reports thinking
Generation Y value it.
p-value < 0,05
Table 4.3. Workplace characteristics with significant perceived differences, about what GenY value, between Generations
Professionalism and Formal authority are the only 2 items where the opinions of the own
generation in analysis (Generation Y) differs from one other generation: Boomers. Both this items, represented to be more valued by the own Generation Y than from Boomers. By other side, Independence/autonomy was a characteristic that Generation Y reported to value it less than when compared to what Generation X and Boomers think they value it. Then, there were 3 items where Generation Y reported to value more than Generation X and Boomers think they will value: Flexibility, Face-to-face communication and Clear
20 About Empowered participation, Boomers report to think that Generation Y value it less than they own report valuing it, and Generation X report thinking that Generation Y value it more than Boomers think they value it. Finally, when analyzing the scores to
Recognition, Boomers report to think that Generation Y value it more than they own
report valuing it, and Generation X reports thinking that Generation Y value it less than Boomers think they value it.
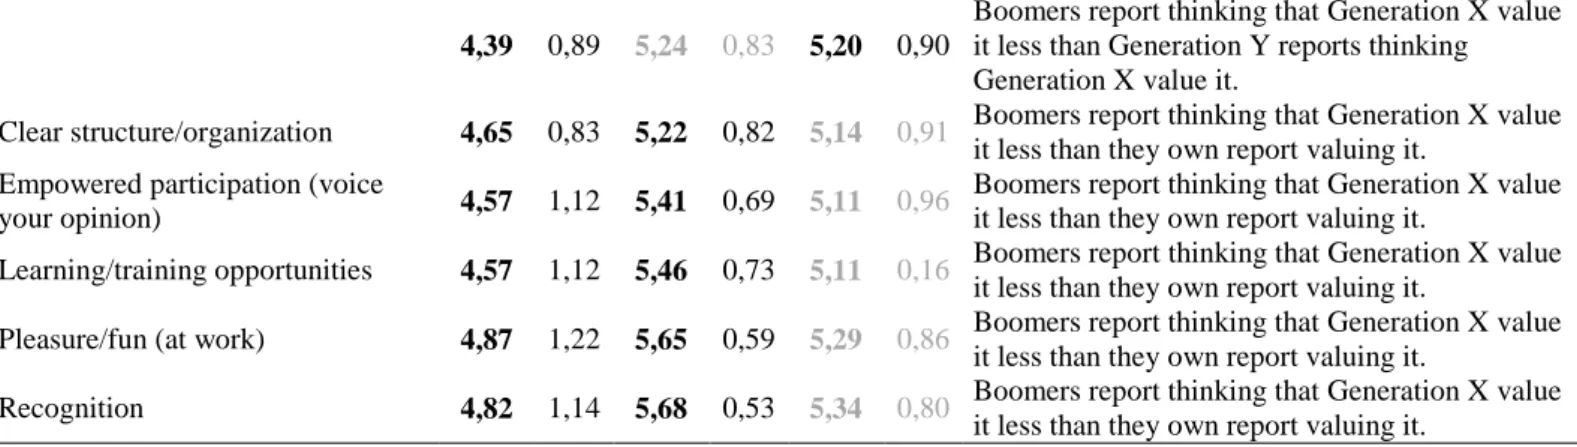
Lastly, the analysis to determine the generations’ perception of what Generation X value revealed the most perceptual differences of all the analyses, having 12 items with differences from the 15 possible. The reported significant differences can be seen on table 4.4 and were about the characteristics: Teamwork (F(2, 93) = 3,923; p = 0,023), Independence/autonomy (F(2, 92) = 3,976; p = 0,022), Security/stability (F(2, 92) = 12,199; p < 0,001), Professionalism (F(2, 91) = 15,271; p < 0,001), Flexibility (F(2, 92) = 4,733; p = 0,011), Formal authority (F(2, 92) = 4,181; p = 0,018), Face-to-face communication (F(2, 92) = 7,944; p = 0,001), Clear structure/organization (F(2, 92) = 3,369; p = 0,039), Empowered participation (F(2, 92) = 6,064; p = 0,003), Learning/training opportunities (F(2, 92) = 6,830; p = 0,002), Pleasure/fun (at work) (F(2, 92) = 5,702; p = 0,005), and Recognition (F(2, 91) = 7,791; p = 0,001). Generation X value Items Boomers Generation X Generation Y Interpretation
Mean SD Mean SD Mean SD
Teamwork 5,13 0,97 5,68 0,53 5,33 0,83 Boomers report thinking that Generation X value it less than they own report valuing it.
Independence/autonomy 4,70 0,97 5,30 0,74 5,14 0,78 Boomers report thinking that Generation X value it less than they own report valuing it.
Security/stability
4,83 0,98 5,68 0,53 5,60 0,60 Boomers report thinking that Generation X value
it less than they own report valuing it.
4,83 0,98 5,68 0,53 5,60 0,60
Boomers report thinking that Generation X value it less than Generation Y reports thinking Generation X value it.
Professionalism
4,41 1,05 5,51 0,69 5,43 0,70 Boomers report thinking that Generation X value
it less than they own report valuing it.
4,41 1,05 5,51 0,69 5,43 0,70
Boomers report thinking that Generation X value it less than Generation Y reports thinking Generation X value it.
Flexibility 4,48 0,95 5,00 1,05 5,26 0,82
Boomers report thinking that Generation X value it less than Generation Y reports thinking Generation X value it.
Formal authority 4,26 0,75 4,95 0,94 4,71 0,93 Boomers report thinking that Generation X value it less than they own report valuing it.
Face-to-face communication 4,39 0,89 5,24 0,83 5,20 0,90 Boomers report thinking that Generation X value it less than they own report valuing it.
21
4,39 0,89 5,24 0,83 5,20 0,90
Boomers report thinking that Generation X value it less than Generation Y reports thinking Generation X value it.
Clear structure/organization 4,65 0,83 5,22 0,82 5,14 0,91 Boomers report thinking that Generation X value it less than they own report valuing it.
Empowered participation (voice
your opinion) 4,57 1,12 5,41 0,69 5,11 0,96
Boomers report thinking that Generation X value it less than they own report valuing it.
Learning/training opportunities 4,57 1,12 5,46 0,73 5,11 0,16 Boomers report thinking that Generation X value it less than they own report valuing it.
Pleasure/fun (at work) 4,87 1,22 5,65 0,59 5,29 0,86 Boomers report thinking that Generation X value it less than they own report valuing it.
Recognition 4,82 1,14 5,68 0,53 5,34 0,80 Boomers report thinking that Generation X value it less than they own report valuing it.
p-value < 0,05
Table 4.4. Workplace characteristics with significant perceived differences, about what GenX value, between Generations
There is 8 workplace characteristics were the own valorization of Generation X differ from the perception of another generation (Boomers). Those characteristics were:
Teamwork, Independence/autonomy, Formal authority, Clear structure/organization, Empowered participation, Learning/training opportunities, Pleasure/fun (at work), and Recognition. To all these 8 items, Boomers report thinking that Generation X value it less
then Generation X report valuing it. Then, there was 3 features were Boomers differ their opinion when compared with Generation Y opinion (about GenX) and with the own Generation X. The 3 features were: Security/stability, Professionalism and Face-to-face
communication, and for them the Generation X (in analysis) always reported valuing it
more than the other two groups think (Boomers and Generation Y). Finally, Flexibility appears to be a characteristic where the opinions of Boomers and Generation Y differ, when reported how they think Generation X value it. Boomers report thinking that Generation X values it less than Generation Y reports thinking Generation X values it.
Comparing the reported actual valued differences with the perceived valued ones, we see that there was only one workplace characteristic that reported significant differences in all the 4 analyses: Face-to-face communication. Contrarily, there were two items that were never reported to present differences (not actual neither perceived): Openness to technology and Email Communication. After all the analysis is even possible to highlight that Boomers were the generation that reported more significant differences, being present in all of them.
According to the results presented before, it can be seen that were reported 24 perceived valued differences between generational cohorts (4 in answers of “Boomers value”, 8 in
22 “Generation Y value” and 12 in “Generation X value”). Remembering that were reported 4 real valued differences in 15 possible (which represent 27% of dissimilarities), and having in account that in terms of perceived valued differences we had 24 in 45 possible (which represent 53% of dissimilarities), we can see that were reported more perceived differences than actual ones. So we conclude that hypothesis 1 was supported.
Age similarity preference
Hypothesis 2 held that ASP (age similarity preference) is negatively correlated with age: ASP is higher among young employees than in older ones. Before we make the analysis of this thematic, it was necessary to study the internal consistency between the five questions of the survey about Age Similarity Preference. This test was important once from the five questions we wanted to construct an index variable to ASP. To evaluate this internal consistency, we looked to Cronbach alpha and we saw it was only 0,231, which means that the five queries did not have a good consistency between them.
According to these results, was performed a reliability analysis to understand if the internal consistency could be increased by the extraction of some question. With the mentioned test, we observed that the fifth question (“I prefer my immediate supervisor to be older than me in age”) is negatively correlated to the rest, whereby the five questions are not measuring the same thematic. By taking out this question, the Cronbach alpha raised to 0,728, which is a much better value to internal consistency. Having this into account, we decided to create an index variable to Age Similarity Preference without the question: “I prefer my immediate supervisor to be older than me in age”. With this change, the scale becomes more viable (α=0,728) and its mean turns in 4,80 (std 3,13).
After create the Age Similarity Preference index, we tested the correlation between this variable and the age of the subjects, through a Person Correlation. This correlation was almost null and non-significant (r -0,037; sig 0,722). However, although there is no relationship between ASP and age, we test whether there would be between ASP and Generational cohorts. To see it, we used two robust tests: Welch and Brown-Forsythe. Both assessments shown us that, in fact, there is significant correlation between ASP and Generations (sigW 0,819; sigB-F 0,847). Therefore, Hypothesis 2 was not supported.
23
Commitment and Age diversity climate
Hypothesis 3 suggested that older employees are more commitment with their company than younger ones, if they perceive a positive age diversity climate. Similarly to the analysis made on the previous hypothesis, we tested the Cronbach alpha of the Commitment variable, to discuss if it could be created an index variable that integrates the six questions about Commitment, made on survey. The result of the reliability analysis revealed that the six questions have a great internal consistency (α=0,788) and we can integrate them all on an index variable.
Once to test the Age diversity climate we also have seven different questions on the survey, we analyzed if it could be created an index variable to an easier analysis of the thematic. By following the same procedure that to Commitment, we tested the Cronbach alpha that shown us the seven questions have a lot of internal consistency (α=0,872) and we can create an index variable, as we made to Commitment. Although the internal consistency of the seven questions was high, we confirmed that, even if we take some question out from the group, it was never so reliable as they all together.
After creating the index variables previously explained, we analyzed the respective means of Commitment and Age diversity climate, in each Generation.
The Commitment scale varies from 1 (strongly disagree) to 6 (strongly agree). All the questions are directed to the idea that “the higher the value of the response, the more the commitment of the employee”. Having it into account, we saw that Boomers revealed the highest mean of commitment (mean = 5,00; std = 0,94), next to Generation X (mean = 4,86; std = 0,90) and Generation Y the lower committed (mean = 4,64; std = 0,91), although all generations show a high level of commitment.
The Age diversity climate scale behaves the same way of Commitment scale (from 1 to 6). “The higher the value of the response, the more positive age diversity climate is perceived”. With this statement is possible to see that Generation X has the lower mean of age diversity climate (mean = 4,38; std = 1,05), followed by Boomers (mean = 4,64; std = 1,05) and Generation Y the higher mean (mean = 4,79; std = 0,81), although all generations show a high level of age diversity climate.
24 To test our hypothesis, we performed a Multiple Linear Regression (MLR) using Hayes’ macro (2014). Results shown that the overall model is significant (F(3,88) = 19,341; p < 0,001). Then, we decided to test is our predictors of commitment (age and age diversity climate) explain the commitment. Results reported that, in fact, age and age diversity climate predict affective commitment (the one in analysis in this dissertation), in 39,74%. Therefore, we needed to study the simple effects of both predictors in analysis on commitment. Results show that age diversity climate explains affective commitment (t(88) = 7,222; p < 0,001), and that age also explains affective commitment (t(88) = 2,594;
p = 0,011). However, despite of the fact that both age and age diversity climate influences
commitment, the both items combined show that there is no moderation effect (t(88) = -0,054; p = 0,954). This means that age diversity climate does not moderate the relationship between age and commitment. Consequently, hypothesis 3 was not supported.
25
IV. Discussion
There are many evidences in literature defending that diversity is positive in organizations. Subeliani and Tsogas (2005) were two authors that cited diversity as the basis of economic benefits, namely a better understanding of the markets and local consumers, better capacity to attract and retain the best people and high creativity, capacity to manage conflicts and flexibility. However, these benefits that diversity could raise are only effective with a good manage of it. As Faria (2014) mentioned, the management of diversity is getting everyday more importance to organizations due to the high increasing of globalization and internationalization of companies.
Before discussing each hypothesis tested of the present dissertation, it seems important to highlight a characteristic of the data collection that we noticed. Almost all the answers of the questionnaire and, consequently, the majority of the means reported, are above 4 (“Slightly Agree”). This factor leaded to some asymmetry problems on all the analyses and could be related to the fact of the subjects did not had the desired conditions to answered the survey, namely adequate place and available time.
Focusing on the answers gave by the participants on the first question of the survey (“Using the six-point scale, please indicate how important you consider each characteristic to be (…)”), and comparing the means of it between each generation, we can see that all generational cohorts highly valued “Recognition” and poorly “Social media”. This consistency between generations and the fact that hypothesis 1 was supported, reveal that the three age groups are probably not so different between them, as they perceive. The mentioned hypothesis that generations are more similar to each other than they think, could also be supported by the fact that were reported only 4 actual differences (in 15 possible) versus 24 perceived ones.
The results previously presented, lead to a possible conclusion that the definition of generations made by the American (Anglo-Saxon) Literature, and used in this study, could make no sense having in account the Portuguese reality. There are some authors that defend the creation of generations as having in its basis the culture of a country. Susaeta et al (2011) specifically mentioned that to define generations we should have into account the concepts of family values, cultural and social rules and religion beliefs. This
26 way, Faria (2014) alerts that it is necessary to be careful when assuming some general conclusions present on literature, once it could be not applied to all cases.
Considering the generational cohorts already assumed, namely their denomination and time range, it is important being alert to the Portuguese reality. Faria (2014) reinforced that the social-economic and political situations in Portugal were significantly different from the ones identified on an international level. So, having in his basis the significant moments that influenced Portugal, Faria (2014) suggested the division to generational cohorts referred below:
Baby Boomer – a generation deeply influenced by the political regime of New State (“Estado Novo”), period marked by a young population but with high infant mortality and illiteracy rates.
Generation X – marked by the revolution of April 1974 (“25 de Abril de 1974”); the date symbolizes a turning point on politics, with a huge influence on
economic, social and cultural components.
Generation Y - represent the “sons of 25th April 1974”; born on democracy and saw some prosperity periods; watched the entrance of European funds of the European Community and the country starts follow what is happening on an International level, namely, technologic, economic and cultural standards.
Taking into account the literature about the definition of generations referred above, we can also suppose that maybe Generation X reported so much internal variances and inconsistencies because it has people very different inside it. For example, in the Portuguese context, the revolution of 25th April was a huge event that break the people in
two different generation: before 25th April 1974 and after it.
In the results analysis, we saw that when comparing the reported actual valued differences with the perceived valued ones, there was one item that reported significant differences in all the 4 analyses (I value, Boomers value, Generation X value, and Generation Y value): Face-to-face communication. The real valued differences observed for this workplace characteristic (face-to-face communication) is probably a result of the fact that communication is the basis of the workplace interactions nowadays. As Gursoy et al (2013) cited, it is important that managers understand that employees from different generations may also have different preferences for communication styles. However, as mentioned, results also reported this characteristic not only as a real difference but also