ABSTRACT
In this study, scenarios of changes in land-use patterns, agricultural production and climate, and their effects on water demand and availability in the São Francisco river basin (Brazil) are analysed. The global driver population growth, economic development, and trade liberalization are included. Using the regionalized version of a global agro-economic land- and water use model, impacts are analysed for two scenarios: a regionalized world with slow economic development, high population growth, and little awareness of environmental problems (A2), and a globalized world with low population growth, high gross domestic product (GDP) growth, and environmental sustainability (B1). A regional ecohydrological model is used to analyse the effect of these scenarios on water demand and availability. The climate scenarios in general show a wetter future (years 2021 – 2050), with wetter rainy seasons and drier dry seasons. The water availability for irrigated agriculture is high, while hydropower generation is declining by 3.2% (A2) and 1.7% (B1) compared to the reference.
Keywords: São Francisco river basin; land-use; agriculture; hydrology; MAgPIE; SWIM.
RESUMO
Neste estudo, analisa-se como as mudanças nos padrões de uso de solo, produção agrícola e mudanças climáticas podem afetar a demanda e a disponibilidade hídrica na bacia hidrográfica do rio São Francisco, incluindo cenários de crescimento da população, desenvolvimento econômico, políticas e condições de mercado. Utilizando uma versão regionalizada do modelo agroeconômico global de uso de solo e água, impactos são analisados para dois cenários: um cenário com moderado desenvolvimento econômico, alto crescimento populacional e pouca consciência dos problemas ambientais (A2), e um cenário com moderado crescimento populacional, alto desenvolvimento econômico, e alta sustentabilidade ambiental (B1). Um modelo eco-hidrológico regional é usado para analisar os efeitos desses cenários. Em geral, os cenários climáticos mostram um futuro mais úmido (anos 2021 – 2050), com estações chuvosas mais úmidas e estações de seca mais intensas. A disponibilidade de água para a agricultura irrigada é alta, enquanto a geração de energia hidrelétrica está em declínio de 3,2% (A2) e 1,7% (B1) em relação ao de referência.
Palavras-chave: bacia hidrográfica do rio São Francisco; uso da terra; agricultura; hidrologia; MAgPIE; SWIM.
AND WATER AVAILABILITY FOR THE SÃO FRANCISCO RIVER BASIN
CENÁRIOS DE MUDANÇAS CLIMÁTICAS E DE USO DA TERRA, DEMANDA EDISPONIBILIDADE DE ÁGUA PARA A BACIA HIDROGRÁFICA DO RIO SÃO FRANCISCO Hagen Koch
PhD, Senior scientist, Potsdam Institute for Climate Impact Research (PIK), Research Domain Climate Impacts and Vulnerabilities – Potsdam (Brandenburg), Germany.
Anne Biewald
PhD, Senior scientist, Potsdam Institute for Climate Impact Research (PIK), Research Domain Climate Impacts and Vulnerabilities – Potsdam (Brandenburg), Germany.
Stefan Liersch
PhD, Senior scientist, Potsdam Institute for Climate Impact Research (PIK), Research Domain Climate Impacts and Vulnerabilities – Potsdam (Brandenburg), Germany.
José Roberto
Gonçalves de Azevedo
Full professor in Civil Engineering, Department of Civil Engineering, Technology ad Geosciences Center (CTG), Universidade Federal de Pernambuco (UFPE) – Recife (PE), Brazil. Gerald N. Souza da Silva PhD student, UFPE – Recife (PE), Brazil. Karolin Kölling
Master student, Potsdam Institute for Climate Impact Research (PIK), Research Domain Climate Impacts and Vulnerabilities – Potsdam (Brandenburg), Germany.
Peter Fischer
PhD student, Leibniz-Institute of Freshwater Ecology and Inland Fisheries (IGB), Department of Ecohydrology – Berlin, Germany.
Robert Koch
PhD student, Technische Universität Berlin (TUB), Department of Landscape Architecture and Environmental Planning – Berlin, Germany. Fred Fokko Hattermann
PhD, Senior scientist, Potsdam Institute for Climate Impact Research (PIK), Research Domain Climate Impacts and Vulnerabilities – Potsdam (Brandenburg), Germany.
Address for correspondence:
Hagen Koch – P.O. Box. 601 203 – D-14412 – Potsdam (Brandenburg) – Germany – E-mail: Hagen.Koch@pik-potsdam.de
INTRODUCTION
Agricultural production and water scarcity are intrin-sically linked. Agriculture is the largest user of the world’s freshwater resources, being responsible for 70% of overall water consumption (GRAFTON & HUS-SEY, 2011). The main driver of global water scarcity is increasing agricultural production due to population growth (FALKENMARK et al., 1989; VOROSMARTY et
al., 2000). Since incomes in developing countries are
expected to rise (ROSEGRANT, 2003) and diets of in-dustrial countries will likely be adopted by many devel-oped societies (PINGALI, 2007), the global demand for livestock products will increase (DELGADO, 2003). As the production of livestock-based calories requires more water than the production of vegetal calories, water re-sources will be put under additional pressure (HOEKS-TRA & CHAPAGAIN, 2007).
The interplay of international food trade and demand play a decisive role for local and regional water availabil-ity. Studies have shown that water-scarce regions import water virtually embedded in food, thus alleviating scarcity (FADER et al., 2011; HANASAKI et al., 2010; HOEKSTRA & HUNG, 2002; OKI & KANAE, 2004) or export virtual water, thus aggravating scarcity (BIEWALD et al., 2014).
Climate change will affect the water balance and the water demand for agricultural irrigation in many re-gions. With changing land use, that is, turning natural vegetation into agricultural land, these effects can be amplified. In regions with sufficient precipitation vol-umes, the effects on water availability can be negligible or even positive. In regions with low or temporally un-even distribution of precipitation volumes, agricultur-al production necessitates irrigation. Increased water withdrawals decrease streamflow and can have nega-tive effects, for example, on hydropower generation, public water supply, and riverine ecology, and have the potential to aggravate upstream-downstream or trans-boundary conflicts. Montenegro & Ragab (2012) em-phasize that future climate and land-use changes call for new water resources management and mitigation strategies. Furthermore, studies indicate that climate change will result in reduction of the national real gross domestic products (GDPs), which can adversely affect agricultural production (FARIA, 2012).
The relationship between climate and land-use is complex and acts at different spatial and temporal scales (CHASE
et al., 2000; PIELKE, 2005; ROUNSEVELL & REAY, 2009).
Regional climate change is a consequence of global cli-mate change and land-use changes, especially on the meso- and micro-scale (MÖLDERS, 2000; CONRADT et
al., 2007). Anthropogenic land-use changes usually occur
on local or regional scales and are driven by local, nation-al, and global drivers through international trade and oth-er socioeconomic changes, as described earlioth-er. Climate is the major driver of the hydrological cycle, and therefore even small changes in the climate parameters are affect-ing water balance components directly (BRONSTERT et
al., 2007). Additionally, land-use changes can result in
strong impacts on hydrological processes (CALDER, 1992; DEFRIES & ESHLEMAN, 2004). Urbanization can result in higher flood peaks (MOSCRIP & MONTGOMERY, 1997), afforestation can increase evapotranspiration and de-crease runoff (FOHRER et al., 2001), whereas deforesta-tion can increase peak discharges (SEIBERT & MCDON-NELL, 2010; BIRKEL et al., 2012).
The extent of climate and land-use change impacts on the water balance depends on the catchment properties, that is, climate conditions, predominating land-use and soil properties (SAHIN & HALl, 1996). Studies aiming at analysing both climate and land-use change impacts often find that climate change dominates on larger scales, whereas land-use change impacts can be more important on local or regional scales. For example, Lahmer et al. (2001) found that potential climate change impacts outweigh the effects of moderate conversion of cropland into dry pasture, meadow, forest, or fallow land in mesoscale catchments in Northern Germany. As climate is a major driver for crop growth, impacts of climate change on crop growth are also of concern (RÖTTER & VAN DE GEIJN, 1999; TUCK et al., 2006; BELLARBY et al., 2010; HABERL et al., 2011; WENKEL
et al., 2013). However, the impacts of climate change on
crop growth are subject to considerable uncertainties (GODFRAY et al., 2010).
According to Lázaro et al. (2014), analyzing results sim-ulated by different Global Circulation Models (GCMs) for Northeastern Brazil, some GCMs show an increase of up to 12% in annual precipitation, whereas others show a decrease of up to 42%. Additionally, Montene-gro & Ragab (2010, 2012) found negative and positive precipitation trends for river basins in Northeastern Brazil, depending on the GCM used. Schaeffer et al.
(2008) simulated a reduction of hydropower genera-tion of 4.3% and 7.7% for the São Francisco river ba-sin for two climate scenarios (A2 and B2) for the years 2071–2100 based on runs of the GCM Hadley Centre Coupled Model, version 3 (HadCM3).
Generally, climate change is expected to affect agriculture in Brazil negatively (CUNHA et al., 2015). Martins et al. (2010) indicate that agriculture in some parts of Brazil can be seriously affected by climate change, but also is responsible for greenhouse gas emissions, as the world largest consumer of pesticides. Irrigation is seen as an adaptation strategy to climate change for farmers in Brazil. However, high costs for the installation, mainte-nance and operation can prevent farmers from apply-ing irrigation (CUNHA et al., 2015). Also the technical knowledge required and the necessary administrative work can impede the application of irrigation, espe-cially at small-sized farms. Whereas in some regions of Brazil precipitation volumes are sufficient for rain fed agriculture all over the year, in regions with a longer dry period year-round cultivation is possible only by applying irrigation. The water demand for agricultural irrigation can put water resources under strong pres-sure. For instance, Ferraz et al. (2013) found for the state of Goiás, depending on the subregion, that be-tween 2% and 44% of available water resources would be required to fulfill the irrigation water demand. Analysing climate change effects on the suitability of land for agricultural production in Brazil, Assad & Pinto (2008) found a decrease for most of the crops consid-ered, such as cotton, coffee, corn, or soybean. For sugar cane an improvement of growing conditions is expect-ed, yet requiring irrigation in some regions, for exam-ple, the Northeast of the country. The area suitable for sugar cane can increase from approximately 6 million ha under recent climate to 13 million – 17 million ha by applying irrigation, depending on the climate scenar-io. Dalri & Cruz (2008) showed that even under humid condition in the state of São Paulo (Botucatu) irrigation can increase the yield significantly. Applying irrigation sums of 520 mm and 740 mm, while precipitation sums up to 1,422 mm and 1,484 mm over the entire growing
cycle, increases stem production by 43.5% and 67.2%, respectively. This means that of the overall 1,942 mm and 2,224 mm approximately one fourth and one third of the water requirements are covered by irrigation. Although irrigation increases the yield under humid conditions as in the state of São Paulo, it is seldom used because of the remaining paradigm that irrigation is economically not reasonable (SILVA et al., 2014). By applying irrigation even in the semiarid northeast-ern parts of Brazil sugar cane can be grown. Silva et al. (2012) estimate a water demand of 1,710 mm for the entire growing cycle of sugar cane; however, the an-nual precipitation at the location of their experiment in the semiarid Sub-middle São Francisco river basin (Juazeiro) sums up to 523 mm. Assuming that the wa-ter requirements must not be fulfilled by 100%, that is, applying deficit irrigation, the irrigation water demand still is in the magnitude of 800 to 1,000 mm for the en-tire growing cycle of sugar cane. This means approxi-mately two thirds of the water requirements must be covered by irrigation. However, Maneta et al. (2009) found that increasing irrigation water demand in the São Francisco river basin would not affect other uses such as hydropower generation, negatively.
Besides climatic factors, environmental effects of sug-ar cane production sug-are also important. According to Massagardi et al. (2013), the strong increase of ethanol production based on sugar cane, mainly to produce car fuel, as proposed by the Decennial Plan for Energy Ex-pansion of the Ministério das Minas e Energia (MME) should be viewed critically, because social and envi-ronmental effects are not considered. The named plan would require the expansion of sugar cane area from 8 million ha in 2012 to at least 13 million ha in 2021, assuming also an increase in productivity (t/ha) of 30% (MASSAGARDI et al., 2013). Land-use change towards sugar cane would result in changing hydrological con-ditions, as altered groundwater recharge and stream flow (MONTENEGRO & RAGAB, 2012). This increase in area used for sugar cane production would mean ex-tension of cultivation into areas climatically not opti-mal, that is, where irrigation is required.
OBJECTIVES
In this study, changes in land-use patterns,
sion of the global agroeconomic land- and water use Model of Agricultural Production and its Impact on the Environment (MAgPIE), adapted to the São Francisco river basin, impacts of global change scenarios are an-alysed consistently. To exemplify how these scenarios can inform about the future development of land-use in the São Francisco river basin, outputs for two different Special Report on Emissions Scenarios (SRES) are anal-ysed. Results are shown for scenario A2, which depicts a regionalized world with slow economic development, as well as high population growth and little awareness of
en-vironmental problems, and scenario B1, which is a global-ized world with low population growth, high GDP growth and environmental sustainability. Further information on these scenarios can be found in Siegmund-Schultze et al. (2015). The scenarios resulting from MAgPIE are used as inputs for the ecohydrological Soil and Water Integrated Model (SWIM) in order to analyse the land-use and cli-mate change effects on water availability and demand in the region. The focus of this paper is on irrigation water demand; the effects of changed land use and water de-mand on hydropower generation are also included.
MATERIALS AND METHODS
Study area
The São Francisco river basin—the focus area of this study—in the east of Brazil has an area of approximately 640,000 km2. The drainage area occupies
approximate-ly 8% of the Brazilian territory and covers six states: Bahia, Minas Gerais, Pernambuco, Alagoas, Sergipe, Goiás, and the Federal District. More than 14.2 million people, approximately 7.5% of the country’s population, lived in the region in 2010 (IBGE, 2010). The climate shows diverse characteristics. The headwaters re-ceive annual precipitation volumes up to 2,000 mm/a, whereas the middle and lower part are characterized by much lower annual precipitation volumes such as only 350 mm/a in some regions (CBHSF, 2004). According to the Agência Nacional de Águas and the Ministério do
Meio Ambiente (ANA/MMA, 2013) the mean discharge
at the mouth of the São Francisco river is 2,846 m3/s.
Some sub-basins, for example, Rio das Velhas, Parao-peba and Rio Grande Verde, are critical regarding the relation between water demand and water availability (ANA/MMA, 2013). Besides natural factors such as low or temporally uneven distribution of precipitation and shallow soils with low water storage capacity, the ever increasing water demand, especially for agricultural irrigation, is seen as a problem in the region (Me-deiros et al., 2013; Braga et al., 2008). Although agri-cultural production is relevant for the region, estimates concerning the size of agricultural area are uncertain. Between 2006 and 2010 the water withdrawals in the
basin have increased from 180.8 to 278.8 m3/s, with
ir-rigation being the most important user, demanding 68% (2006) and 77% (2010) of the overall withdrawals (ANA/ MMA, 2013). An increase in water demand is expected, for example, with the Transposition Project (Northern axis: withdrawal from river stretch between reservoirs Sobbradinho and Itaparica; Eastern axis: withdrawal from Itaparica reservoir), where water is transferred to northern regions inside and outside of the basin (Lern-er & Carpio, 2006). The minimum quantity transf(Lern-erred by the two axes of the transposition is approximately 26.4 m3/s, while during high flows up to 127 m3/s
(dai-ly maximum of 114.3 m3/s) can be transferred (ANA,
2005). In the middle of the last century, the first large dam, Três Marias, located in the Upper São Francisco river basin (total capacity of 19,528 hm3, live capacity
of 15,278 hm3) was constructed to increase the
reli-ability of water supply. In the late 1970s, Sobradinho reservoir (total capacity of 34,117 hm3, live capacity
of 28,669 hm3) and in the late 1980s, Itaparica
res-ervoir (total capacity of 10,782 hm3, live capacity of
3,549 hm3) were constructed in the Sub-middle São
Francisco river basin (ANA/GEF/PNUMA/OEA, 2004a). These reservoirs were constructed mainly for hydro-power generation and flood control. However, they also supply water for agricultural irrigation and to municipalities and are used to augment streamflow for navigation.
Scenarios
In this study, two scenarios described in the SRES
of environmental problems, and ii) B1, which is a glo-balized world with low population growth, high GDP growth, and environmental sustainability.
The scenarios include also information on climate change. The projected global average surface warming at the end of the century for the two different SRES scenarios is 1.1 to 2.9°C for scenario B1 and 2.0 to 5.4°C for scenario A2. The climate scenarios used in general show a clear sign of increasing air temperatures but no clear signal for precipitation. Overall the future scenar-io A2 is markedly wetter and scenarscenar-io B1 is somewhat wetter compared to the historical period. It also needs to be mentioned that the GCM HadCM3 is rather wet in the historical period, that is, simulated discharges are higher than observed ones. However, the spatial distri-bution gives a much more differentiated picture. Where-as the southern part of the São Francisco river bWhere-asin is becoming much wetter, regions in the northern part are becoming drier. As most of the runoff is generated in the southern part, the overall discharge is also increasing.
The SRES scenarios provide a number of qualitative in-dicators which have to be translated into quantitative model input for an agroeconomic model. In the con-text of agricultural modeling, population development translates into demand for crop and livestock prod-ucts, while the development of GDP in the different world regions influences dietary habits such as meat consumption, amount of calories consumed or wasted per person. The exogenously given projections for food demand in the model are derived from scenario informa-tion on consumpinforma-tion per capita (in kcal) and the popu-lation growth (VALIN et al., 2014). Based on historical time series, the amount of consumption per capita (in kcal) varies, depending on the national per capita GDP. In the globalized B1, world trade barriers are relaxed by 10% per decade globally, starting from 2010. In the regionalized A2, trade liberalization is slowing down, in which trade barriers are relaxed by 5% per decade. Table 1 shows how the qualitative indicators are trans-lated into model parameters.
Year America (million people)Population in Latin Daily Kcal per capita Share of diet which is based on livestock-calories [%] Protection of natural areas
Scenario A2 B1 A2 B1 A2 B1 A2 B1
2005 572 553 2,775 2,824 20 20 -
-2035 901 724 3,199 3,256 20 30 Low High
Table 1 – Specific parameters for Latin America based on Special Report on Emissions Scenarios (SRES) A1 and B2.
The agroeconomic Model of Agricultural Production and its Impact on the Environment (MAgPIE)
MAgPIE (LOTZE-CAMPEN et al., 2008) is a global,spa-tially explicit, economic land-use model. The model distinguishes ten world regions on the demand side and uses input data of 0.5 degree resolution on the supply side. The ten world regions are: Sub-Sahara Africa, Centrally Planned Asia (including China), Europe (includ-ing Turkey), Former Soviet Union, Latin America, Middle East and North Africa, North America, Pacific OECD, Pa-cific Asia, and South Asia (including India). Due to compu-tational constraints, all model inputs on the supply side are aggregated to clusters for the optimization process based on a k-means clustering algorithm (DIETRICH et
al., 2013). With income and population projections as
exogenous inputs, demand for agricultural commod-ities is projected and produced for 15 food crops. As
demand is scenario-specific and changes over time, it does not react to changes in supply or any other variables. The model simulates time steps of 10 years and uses in each period the optimal land-use pattern from the previous period as initial condition. Spatially explicit land-use types in MAgPIE comprise cropland, pasture, forest, urban areas, and other land (KRAUSE
et al., 2013). The objective function of MAgPIE
mini-mizes global agricultural production costs, which in-volves factor costs for labour, capital, and intermediate inputs derived from the GTAP database (NARAYANA & WALMSLEY, 2008), investments into research and de-velopment (R&D), land expansion costs as well as trade and transport costs. R&D investments allow MAgPIE to increase crop yields in a particular region. This
endoge-nous implementation of technical change (TC) is based on a surrogate measure for agricultural land-use inten-sity (DIETRICH et al., 2014). Expansion of cropland is the alternative to increase the production level.
On the biophysical side, the model is linked to the grid-based dynamic vegetation model Lund-Potsdam-Jena managed Land (LPJmL) (BONDEAU et al., 2007), which provides important biophysical inputs like crop yields under both rainfed and irrigated conditions, related ir-rigation water demand per crop, and water availability depending on climatic conditions on a 0.5 degree reso-lution. Results of the General Circulation Model (GCM) HadCM3 were supplied to LPJmL as monthly data fields
of mean temperature, precipitation, cloudiness and num-ber of wet days (HEMPEL et al., 2013). LPJmL simulations of crop yields and water availability used as input in the MAgPIE model are generated without CO2 fertilization. Although the global land- and water use model MAg-PIE is based on about 60,000 spatially explicit cells, due to computational reasons these cells have to be aggregated to a couple of hundreds aggregated units for simulations. For the adaptation of the global mod-el to the São Francisco river basin, the region was simulated based on 10 subregions with similar climat-ic characteristclimat-ics instead of embedded in one larger simulation cluster (BECK, 2013).
The ecohydrological Soil and Water Integrated Model (SWIM)
The ecohydrological Soil and Water Integrated Model(SWIM; KRYSANOVA et al., 1998, 2000) is a continu-ous-time spatially semi-distributed ecohydrological model. It is process-based and combines physics-based processes and empirical approaches. It was developed from the Soil and Water Assessment Tool (SWAT), version ‘93 (ARNOLD et al., 1993) and MATSALU, developed in Estonia for the agricultural basin of the Matsalu Bay, models (KRYSANOVA et al., 1989), primarily for climate change and land-use change impact studies. Hydrological processes, vegetation growth, erosion, and nutrient dynamics are simulat-ed at the river-basin scale. Hydrotopes or hydrolog-ical response units (HRUs) are the core elements of the model. Hydrotopes are generated by overlaying maps of land-use and land cover, soil, and sub-basins. The hydrotopes are considered as units with the same properties regarding biophysical processes. There is no lateral connection between hydrotopes in the model. All processes are calculated for hydrotopes using daily time-steps. In addition to spatial data, SWIM requires temporal input data, such as daily climate data includ-ing precipitation, air temperature (minimum, maximum, mean), radiation, or humidity. SWIM has been developed for (central) European climate conditions and has been widely used for model-supported impact assessment and decision support (HATTERMANN et al., 2011). For the application in the southern hemisphere a number of adaptations were necessary, e.g. concerning vegeta-tion dynamics that are temperature driven in (central) Europe but precipitation driven in Brazil. For the setup
of the SWIM model for the São Francisco river basin geographical data, that is, maps of land-use and soils on a 0.5 x 0.5 km grid were used. The calibration and validation of the SWIM model is described in Koch et
al. (2016). Climate data from the Integrated Project
Water and Global Change (WATCH) (http://www.eu-watch.org/; Weedon et al., 2011) were used in the cal-ibration and validation. The results from the simulations using the WATCH data are also used for comparison with simulations using data from the GCM HadCM3.
The simulations with SWIM require a reliable database for use in the whole river basin. To make the land-use scenario results of MAgPIE applicable, high-resolu-tion data about present land-use were required. From MMA (2000, 2002) high-resolution land-use data are available for the Sub-middle (Submédio) and Lower (Baixo) São Francisco river basin. According to these data, cropland covers 3.3% (year 2000) and 9.8% (year 2002) of the Sub-middle and Lower São Francisco river basin, respectively. However, high-resolution land-use data are not available for the other subregions of the river basin. Harvested areas for temporary and perma-nent crops from Instituto Brasileiro de Geografia e
Estatística (IBGE, 2014) on a municipality level were
an-alyzed for the São Francisco river basin. The areas given for temporary crops in the years 2009, 2010, and 2011 are 3,664,244 ha; 3,502,113 ha; and 3,471,131 ha, re-spectively, whereas for permanent crops 309,198 ha; 318,393 ha; and 321,773 ha, respectively, are given. The sum of temporary and permanent crops in the years 2009, 2010, and 2011 is 3,973,442 ha (share of
cropland on the total area of the São Francisco river basin 6.3 %); 3,820,506 ha (6.1 %); and 3,792,904 ha (6.0%), respectively. In the database of the
Institu-to Brasileiro de Geografia e Estatística (IBGE) (2014),
which was analyzed for different years, data for some municipalities are missing. Therefore, we do not as-sume that the agricultural area has declined from 2009 to 2011, but that the small differences in the numbers are resulting from a discrepancy in the number of mu-nicipalities included.
A comparison of different land-use data sets showed that the Moderate Resolution Imaging Spectroradiom-eter (MODIS) Land Cover product MCD12Q1 (FRIEDL et al., 2010) annual data set for the Sub-middle and Lower São Francisco river basin had the best match with the data of MMA (2000, 2002). In the MODIS data set cropland covers 2.4% and 11.6% in the Sub-mid-dle and Lower São Francisco river basin, respectively. The slightly higher value for the Lower São Francisco riv-er basin—11.6% compared to 9.8%—can be explained by a small increase in cropland area between 2002 and 2010. However, for the Sub-middle São Francisco river basin the value for 2010 is markedly below that of MMA (2000)—2.4% compared to 3.3%. It was found that large and mostly irrigated areas are not included in the MODIS data set in this region. In a previous study, irrigated ar-eas for the Sub-middle and Lower São Francisco river ba-sin were delineated uba-sing remote senba-sing (SILVA et al., 2014). By combining the MODIS data set with the data from Silva et al. (2014) a new land-use data set for the whole river basin was created. In the new data set crop-land accounts for 6.6% of the entire São Francisco river basin, a value very close to the data given by IBGE (2014) for 2009 to 2011, which ranged from 6.0% to 6.3%.
From IBGE (IBGE, n.d.; Potencial_agricola), data on po-tential agricultural land-use were available. These data, based, for example, on soil properties and topography, were combined with climate data. Areas with a dry sea-son surpassing 8 months according to Instituto
Brasile-iro de Geografia e Estatística (IBGE, n.d., Climas) were
excluded from rain fed agriculture. It was assumed that a minimum of three to four months with precipitation is required for any kind of rainfed agricultural activity. The potential for rainfed agriculture increases with de-creasing length of the dry season.
MMA data on the potential for irrigated agriculture (MMA, n.d., Terras para irrigação), based on data of Companhia de Desenvolvimento do Vale do São Francis-co (CODEVASF, 1989), were available. Using information on the location of potential large scale irrigation projects, such as those from Agência Nacional de
Águas (ANA/GEF/PNUMA/OEA, 2004b) and Com-panhia de Desenvolvimento dos Vales do São Fran-cisco e do Parnaíba (CODEVASF, n.d.), regions with
potential for irrigated agricultural use were delin-eated. It was assumed that the maximum distance for pumping water is 60 km (see CODEVASF, 1989). For both scenarios two runs were carried out with SWIM: in the first run the natural state—without con-sidering water management—is simulated (reservoir management and water withdrawals); in the second run the managed state—including water manage-ment—is simulated (reservoir management and wa-ter withdrawals). In the simulations of scenario B1 including water management, 44 irrigation projects are included. In scenario A2, the number of irrigation projects increases to 59.
RESULTS AND DISCUSSION
Model of Agricultural Production and its Impact on the Environment (MAgPIE)
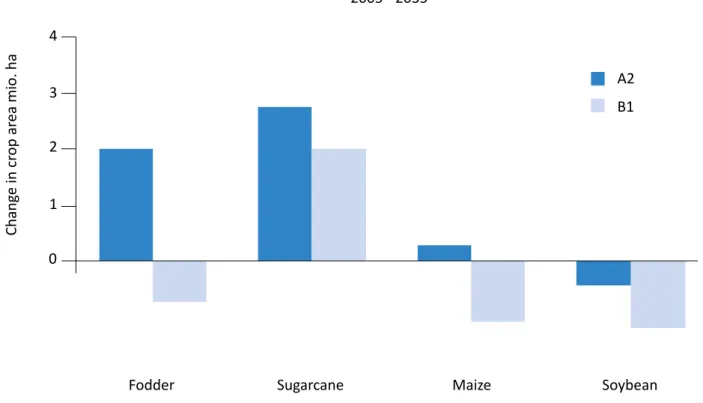
With global and regional socioeconomic changes theoverall land-use patterns are also impacted. Only in the regionalized world with little environmental awareness (A2) cropland in the São Francisco river basin does increase in 2035 compared to 2005 at the expense of natural vegetation. Overall cropland more than doubles (4.4 million ha in 2005 to 9.5 million ha in 2035), while natural vegetation area decreases by 22% (from 26.6 million ha to 20.7 million ha). Pasture
area is not influenced in either of the two scenarios. Whereas cropland area does not change in B1, the crops cultivated do change. The cultivation of maize and soybean totally cease, while fodder area de-creases by 50% in 2035 compared to 2005. The ag-ricultural area cultivated with sugar cane is in 2035 five times the size of 2005 (increase from 0.5 million ha to 2.5 million ha). In A2, soybean crop area de-creases by 31% in 2035. Sugar cane area inde-creases
15 fold, while maize and fodder areas increase by 23% and 167%, respectively (Figure 1).
The massive increase in cropland in scenario A2 in 2035 can be explained by three socioeconomic devel-opments. First, the population increases in Latin Amer-ica from 572 to 901 million people, thus increasing the overall demand for food. Second, trade is still restrict-ed, so that imports can only partly ease the pressure on the land. And third, with little environmental aware-ness natural areas are not protected and cropland ex-pansion is not restricted.
Fodder demand increases in the São Francisco river ba-sin in the wealthy B1 scenario due to a higher share of livestock based products of 30% compared to 20% in scenario A2. In the poorer A2 scenario, demand in-creases due to population growth. Since fodder trade is restricted between regions, the massive increase in fodder area in scenario A2 results from the increased demand. The decrease of fodder area in scenario B1, despite the increasing demand, is possible because of the increase in yields from 6.9 t/ha (dry matter) to 9.15 t/ha (dry matter).
Sugar cane is the only crop whose production is in-creased in scenario A2 as well as in scenario B1. This is true although sugar cane is massively imported in sce-nario B1, in which imports are 2.4 times higher than in scenario A2. This can be partly explained by an increase in demand from 2005 to 2035 by more than 200% in both scenarios. The concentration of irrigated sugar cane pro-duction in the São Francisco river basin is especially high in scenario A2 with high global warming potential, as the availability of irrigation water from surface water is in-creased in 2035 compared to 2005 in this scenario. According to the simulations, the agricultural produc-tion of maize will almost cease in the São Francisco river basin in scenario B1 over the next decades and will shift to other Latin America regions. On the one hand this is due to the relatively good yields in other parts of Latin America compared to the São Francisco river basin, which make a shift of production outside of the basin profitable. On the other hand, scenario B1 provides the possibility to import maize; consequently, imports are 1.7 times higher than in scenario A2.
Figure 1 – Changes in the agricultural land used for the different crops in million ha. 2005 - 2035
Fodder Sugarcane Soybean
A2 B1 Maize 4 Chang e in cr op ar ea mio. ha 3 2 1 0
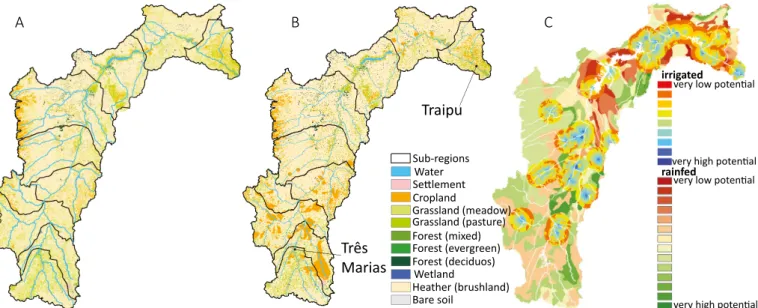
Figure 2 – Land-use in the São Francisco river basin. Traipu
Sub-regions
very low potential
very high potential very low potential
very high potential Water Settlement Cropland Grassland (meadow) Grassland (pasture) Forest (mixed) Forest (evergreen) Forest (deciduos) Wetland Heather (brushland) Bare soil Três Marias irrigated rainfed
2A: reference based on MODIS data, adapted as described in the text; 2B: scenario A2 with increased agricultural land-use; 2C: suitability of land for rain-fed and irrigated agriculture (MMA, n.d.); black lines (2A&B): delineation of 10 sub-regions.
A B C
The annual demand for soybean in Latin America is in the wealthy B1 scenario with 86 million tons dry matter more than twice as high as in the A2 scenario. The high demand results from the high demand for livestock related products and the fact
that soybean is essential for feeding livestock. The decrease of soybean area is possible through a de-crease of exports in scenario B1 and a inde-crease of yields from 1.5 t/ha (dry matter) to 2.4 t/ha (dry matter) in both scenarios.
SOIL AND WATER INTEGRATED MODEL (SWIM)
In the scenarios there is a strong (A2) and almost no change (B1) in land-use. In scenario A2, all planned and potential irrigation projects of CODEVASF are imple-mented, whereas in B1 only projects already started will be realized. The land-use change results of MAgPIE for scenario A2 were delivered for the 10 subregions shown in Figures 2A and 2B. These values, given as change sig-nal in percent, are used in a Monte Carlo based search algorithm, which is conditioned by the suitability of a specific area (grid cell) for rainfed or irrigated agricul-ture. The suitability indexes for these land use classes are shown in Figure 2C. Starting with the areas of high-est suitability in each subregion, nonagricultural land is converted into agricultural area until the percentage change as delivered by MAgPIE is reached. Settlements and water bodies cannot be converted into agricultur-al area. The irrigation projects implemented in A2 are on account of natural vegetation (Figure 2B), wherebyalso secondary vegetation is considered as natural to be discriminated from agricultural land or settlements. In the parts of the Upper, Middle and Lower São Fran-cisco river basin receiving higher precipitation volumes also large areas are converted from natural vegetation to rainfed agriculture (Figure 2B).
The effects of changed land-use on natural runoff— without considering water management—in sce-nario A2 are rather low and are not displayed here. The reason for these small effects on natural runoff is that natural vegetation is mainly converted into agri-cultural area, that is, one type of vegetation is replaced by another type of vegetation.
In Figure 3 the development of irrigation water demand in scenarios A2 and B1 for the São Francisco river basin is shown. It has to be pointed out that the dates given in Figure 3 are scenario years and are not to be
interpret-ed as calendar years, for example, scenario year 2040 shows the climate simulated around the decade 2036 – 2045. The minimum, mean, and maximum values for irrigation water demand in scenario B1 (years 2021 – 2050) are 249.1 m3/s, 267.3 m3/s, and 287.9 m3/s,
respectively. In scenario A2 (years 2021 – 2050) mini-mum, mean, and maximum values for irrigation water demand are 369.1 m3/s, 474.3 m3/s, and 559.7 m3/s,
respectively. In the simulations, a strict observation of minimum discharges, for instance, 1,300 m3/s for the
stretch between the reservoirs Sobradinho and Xingó, is assumed. This means, only water above this value can be withdrawn for irrigation or other uses.
Under consideration of reservoir releases and mini-mum discharges the simulated minimini-mum, mean, and maximum values for irrigation water withdrawals are 59.5 m3/s, 214.9 m3/s, and 265.6 m3/s in scenario B1
(years 2021 – 2050). In scenario A2 (years 2021 – 2050) simulated minimum, mean, and maximum val-ues for irrigation water withdrawals are 174.1 m3/s,
435.9 m3/s, and 523.6 m3/s. The safety of supply for
irrigation water for the whole river basin, calculated as the sum of water withdrawn divided by the sum of water demand for the whole time period (2021 – 2050), in scenarios A2 and B1 is 92% and 80%, respec-tively. In the month of lowest water availability, calcu-lated as water withdrawn divided by water demand for each month separately, only 43% and 23% of the demanded water can be supplied in scenarios A2 and B1, respectively.
In the simulations, the quantities transferred by the two axes of the transposition project (Northern axis and Eastern axis) are considered. For the North-ern axis, with a maximum capacity of 90.0 m3/s and
withdrawal from river stretch between reservoirs Sobbradinho and Itaparica, the mean withdrawal is 88.4 m3/s in scenario A2, whereas in scenario B2 a
mean withdrawal of 66.1 m3/s is simulated. For the
Eastern axis, with a maximum capacity of 24.0 m3/s
and withdrawal from reservoir Itaparica, the mean withdrawal is 18.3 m3/s in scenario A2 and 19.1 m3/s
in scenario B2 (Figure 3). Under extreme drought Figure 3 – Development of irrigation water demand and supply in scenarios A2 and B1 for
the São Francisco river basin, withdrawals for transposition project (Northern axis and Eastern axis). Demand A2 Supply A2 Northern Axis A2 Eastern Axis A2 Demand B1 Supply B1 Northern Axis B1 Eastern B1 Q [m 3 /s ] 600 450 300 150 0
Jan-21 Jan-25 Jan-29 Jan-33 Jan-37 Jan-41 Jan-45 Jan-49
conditions and under consideration of a minimum discharge of 1,300 m3/s downstream of reservoirs
So-bradinho, no water can be withdrawn for the Northern axis in both scenarios. However, this is more frequent in the drier scenario B2. For the Eastern axis, the min-imum demand of 10 m3/s from reservoir Itaparica can
be supplied in both scenarios all the time.
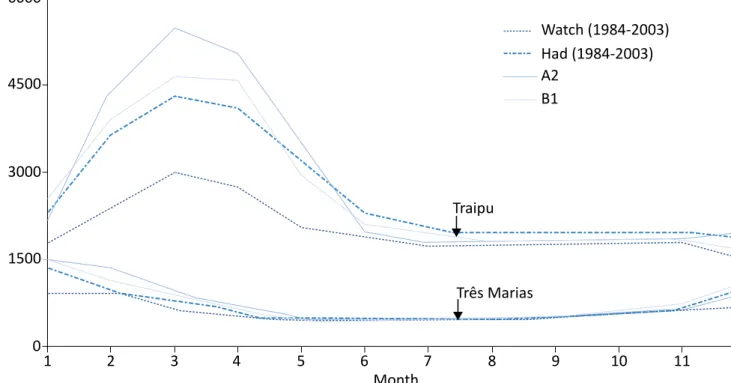
The mean outflow simulated for reservoir Três Marias, located in the Upper (Alto) São Francisco river basin, is 607 m3/s and 691 m3/s for the reference based on
WATCH climate data and on GCM HadCM3 climate data (1984 – 2003), respectively. In the scenarios A2 and B1, it is 761 m3/s and 752 m3/s, respectively (2021 – 2050).
The discharges simulated for gauge Traipu, located in the Lower (Baixo) São Francisco river basin, is 2,033 m3/s,
2,624 m3/s for the reference based on WATCH climate
data and on GCM HadCM3 climate data (1984 – 2003), respectively. In the scenarios A2 and B1 it is 2,796 m3/s,
and 2,649 m3/s, respectively (2021 – 2050). The
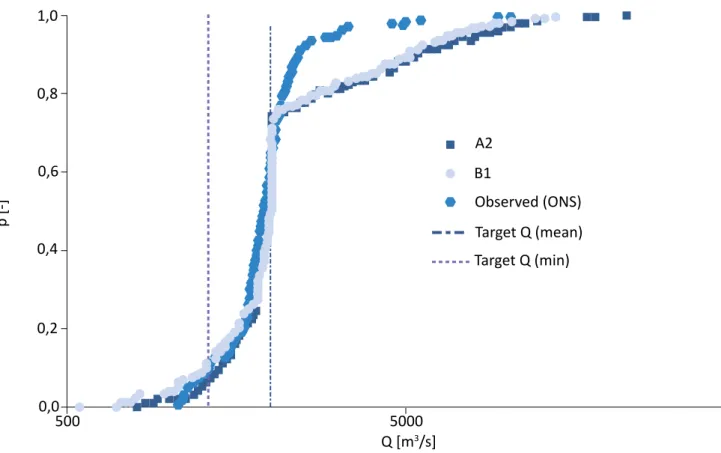
simu-lated mean monthly outflow from reservoir Três Marias and the discharge at gauge Traipu are shown in Figure 4. The mean values given allow a first assessment of climate change and land-use change effects on charges. However, the probability distribution of dis-charge values is of high interest. Inflow and outflow time series for the reservoirs Sobradinho and Itapar-ica, up to the year 2014, were delivered from
Opera-dor Nacional do Sistema Elétrico (ONS) to the
INNO-VATE project. In Figure 5, the probabilities for mean monthly outflows from reservoir Itaparica, located in the Sub-middle (Submédio) São Francisco river ba-sin upstream of gauge Traipu, for the scenarios A2 and B1 (years 2021 – 2050) are shown. Probabilities for mean monthly outflows from reservoir Itaparica calculated from the data of ONS (time period from September 1989 to August 2014, and data gap from February 2002 to December 2003) are also shown. Additionally, the normal discharge target from res-ervoir Itaparica, approximately 2,000 m3/s and the
Figure 4 – Outflow from reservoir Três Marias
and discharge at gauge Traipu ( for location see Figure 2) in scenarios A2 and B1 (2021 – 2050).
WATCH: simulation for historical period based on Integrated Project Water and Global Change (WATCH) climate data; HAD: simulation for histo-rical period based on Global Circulation Models (GCM) Hadley Centre Coupled Model, version 3 (HadCM3) climate data.
Q [m 3/s ] Watch (1984-2003) Had (1984-2003) A2 B1 Traipu Três Marias 1 2 3 4 5 6 7 8 9 10 11 12 6000 4500 3000 1500 0 Month
minimum target of 1,300 m3/s are given. From
Fig-ure 5 it can be deduced that mean discharges in the scenarios A2 and B1 are increasing because of much higher discharges in the rainy season. Discharges can decline markedly during the dry season.
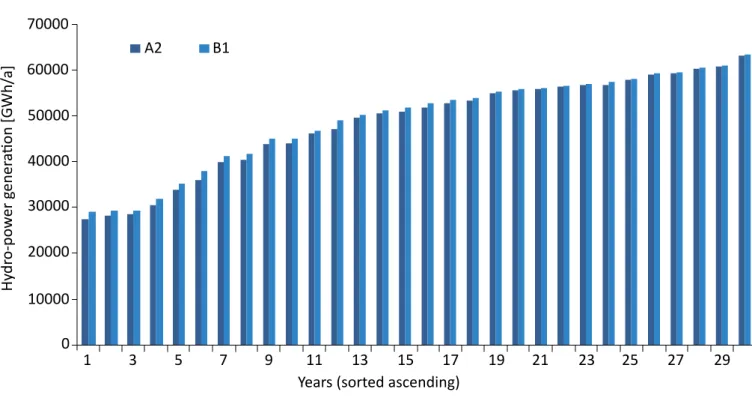
The scenarios with changed climate and land-use affect also the hydropower generation in the São Francisco river basin. For the simulation of hydropower generation, the reservoirs Três Ma-rias (installed capacity of 396 MW), Sobradinho (1,050 MW) and Itaparica (Luiz Gonzaga; 1,500 MW) are integrated into SWIM. Additionally, the large hydropower plants downstream of Itaparica res-ervoir: Moxotó (Apolônio Sales; installed capacity 400 MW), Paulo Afonso 1 (180 MW), Paulo Afonso 2 (445 MW), Paulo Afonso 3 (800 MW), Paulo Afonso 4 (2,460 MW), and Xingó (3,000 MW) are included (data according to ANA/GEF/PNUMA/OEA, 2004a). For reasons of comparability it is assumed that over the whole simulation period all hydropower plants
are operating. The simulations for the historical pe-riod (years 1984 – 2003) based on WATCH climate data give a mean annual hydropower generation of 48,053 GWh/a, whereas the simulation for historical period (years 1984 – 2003) based on GCM HadCM3 climate data give 50,098 GWh/a. For the scenarios A2 and B1 the mean annual hydropower genera-tion for the years 2021 – 2050 are 48,471 GWh/a and 49,257 GWh/a, respectively. The lowest and highest annual hydropower generation in scenar-io A2 are 27,417 GWh/a and 63,284 GWh/a, re-spectively. In scenario B1 it is 29,100 GWh/a and 63,501 GWh/a, respectively (Figure 6). The simulat-ed mean monthly hydropower generation follows the discharge at gauge Traipu shown in Figure 4. During the rainy season, especially in the months of March and April, the hydropower generation is increasing, whereas in the dry season, starting in the month of May, hydropower generation is de-creasing slightly, compared to the modeling results based on HadCM3 for the historical period.
Figure 5 – Probability distribution for monthly outflow from reservoir Itaparica in scenarios A2 and B1 (2021 – 2050). B1 A2 Observed (ONS) Target Q (min) Target Q (mean) 1,0 0,8 0,6 0,4 0,2 0,0 p [-] Q [m3/s] 500 5000 50000
ONS: calculated from data of Operador Nacional do Sistema Elétrico (09/1989 to 08/2014);
Figure 6 – Annual hydropower generation for years 2021 - 2050 in scenarios A2 and B1 for the São Francisco river basin. A2 B1 70000 60000 50000 40000 30000 20000 10000 0 Hy dr o-po w er g ener ation [G Wh/ a]
Years (sorted ascending)
1 3 5 7 9 11 13 15 17 19 21 23 25 27 29
Values sorted in ascending order of annual hydropower generation.
CONCLUSIONS
In this study, two SRES scenarios were used: A2, de-picting a regionalized world with slow economic devel-opment, high population growth, and little awareness of environmental problems, and B1, depicting a glo-balized world with low population growth, high GDP growth, and environmental sustainability. Socioeco-nomic changes are also leading to changes in land-use patterns. In the regionalized world with little environ-mental awareness (A2), cropland area in the São Fran-cisco river basin almost doubles until 2035 compared to 2005 at the expense of natural vegetation, whereas in the environmentally friendly scenario B1, with large nature conservation areas, the size of the cropland area does not change. In both scenarios, the crop mix changes, in which irrigated sugar cane increases mainly because of increased demand and favorable conditions. The simulations for the years 2021 – 2050 using the ecohydrological model SWIM for the São Francisco river basin, including the largest reservoirs and water users (agricultural irrigation), show a mean safety for irrigation water supply of 92% and 80% in scenarios A2
and B1, respectively. This means irrespectively of the socioeconomic setting, local conditions for agricultural irrigation are positive under the assumed climate con-ditions. In the month with the lowest water availability, only 43% and 23% of the demanded water can be sup-plied in scenarios A2 and B1, respectively. The simulated water availability for the two axes of the transposition project (Northern axis and Eastern axis) is high in gen-eral (Figure 3).
In both scenarios, there is a trend to wetter rainy sea-sons and drier dry seasea-sons with an increase in annual mean discharges (A2 +6.6% and B1 +1.0% at gauge Trai-pu). Very high flows are increasing (Figure 5), but these flows are surpassing the maximum capacities of the hydropower plants and therefore cannot be used to generate more electricity. Overall, for hydropower gen-eration a high bandwidth for annual gengen-eration is sim-ulated. For the rainy season an increasing hydropower generation is simulated, whereas for the dry season hydropower generation is decreasing slightly. Compared to the reference (1984 – 2003), hydropower generation
REFERENCES
ANA/GEF/PNUMA/OEA - AGÊNCIA NACIONAL DE ÁGUAS/GLOBAL ENVIRONMENT FACILITY/PROGRAMA DAS NAÇÕES UNIDAS PARA O MEIO AMBIENTE/ORGANIZAÇÃO DOS ESTADOS AMERICANOS. Projeto de Gerenciamento Integrado das
Atividades Desenvolvidas em Terra na Bacia do São Francisco. Estudo Técnico de Apoio ao PBHSF Nº 09 - Aproveitamento do Potencial Hidráulico para geração de energia elétrica. Brasília: ANA/GEF/PNUMA/OEA, 2004a.
ANA/GEF/PNUMA/OEA - AGÊNCIA NACIONAL DE ÁGUAS/GLOBAL ENVIRONMENT FACILITY/PROGRAMA DAS NAÇÕES UNIDAS PARA O MEIO AMBIENTE/ORGANIZAÇÃO DOS ESTADOS AMERICANOS. Projeto de Gerenciamento Integrado das
Atividades Desenvolvidas em Terra na Bacia do São Francisco. Estudo Técnico de Apoio ao PBHSF Nº 12. AGRICULTURA IRRIGADA. Brasília: ANA/GEF/PNUMA/OEA, 2004b.
ANA/MMA - AGÊNCIA NACIONAL DE ÁGUAS/MINISTÉRIO DO MEIO AMBIENTE. Conjuntura Recursos Hídricos Brasil. Brasília: ANA, 2013.
ANA - AGÊNCIA NACIONAL DE ÁGUAS. Resolução nº 411, de 22 de setembro de 2005. Brasília: ANA, 2005. Disponível em: <http://arquivos.ana.gov.br/resolucoes/2005/411-2005>.pdf. Acesso em: 07 mar. 2014.
ANA - AGÊNCIA NACIONAL DE ÁGUAS. Resolução nº 442, de 8 de abril de 2013. Brasília: ANA, 2013. Disponível em: <http://arquivos.ana.gov.br/resolucoes/2013/442-2013.pdf>. Acesso em: 02 jul. 2015.
ANA - AGÊNCIA NACIONAL DE ÁGUAS. Resolução nº 713, de 29 de junho de 2015. Brasília-DF, 2015. Disponível em: <http://arquivos.ana.gov.br/resolucoes/2015/713-2015.pdf>. Acesso em: 02 jul. 2015.
ARNOLD, J. G.; ALLEN, P. M.; BERNHARDT, G. A comprehensive surface-groundwater flow model. Journal of Hydrology, v. 142, n. 1-4, p. 47-69, 1993.
ASSAD, E. D.; PINTO, H. S. (Coords.). Aquecimento global e cenários futuros da agricultura brasileira. São Paulo: EMBRAPA/UNICAMP, 2008. 84p.
BECK, F. Modelling land-use change in the catchment area of the São Francisco River in Brazil. 2013. Master thesis – Potsdam Institute for Climate Impact Research, Humboldt University, Berlin, 2013.
is declining by 3.2% (A2) and 1.7% (B1). This decline is lower than given in Schaeffer et al. (2008) with -4.3% (SRES scenario A2) and -7.7% (B2). However, the re-sults given by Schaeffer et al. (2008) are for the time period 2071 – 2100.
The climate scenarios based on the GCM HadCM3 used are rather wet (compare also simulated discharges using the WATCH climate data set and GCM HadCM3 for the historical period in Figure 4), whereas other GCMs, for example, MIROC, simulate a rather dry future. Therefore, the results given for irrigation wa-ter availability and hydropower generation should be seen as rather optimistic. Also the most recent drought in the São Francisco river basin, starting in the year 2012, points to the necessity to include rather dry
cli-mate scenarios in further impact studies. A strict ob-servation of minimum discharge of 1,300 m3/s for the
stretch between the reservoirs Sobradinho and Xingó is assumed in the simulations. It is known to the authors that since April 2013 the minimum discharge for the Sub-middle São Francisco river basin has been reduced to 1,100 m3/s (ANA, 2013), and in the year 2015 a
fur-ther reduction to 900 m3/s was approved (ANA, 2015).
However, the topic of this paper is the description of an ap-proach on how to downscale global land-use scenarios to the São Francisco river basin using local information. In fur-ther simulation studies, the effects of changed legislation such as different settings for minimum discharges can be carried out. Furthermore, the management of the two axes of the transposition project is still under discussion and the results presented here can give only a first estimate.
BELLARBY, J.; WATTENBACH, M.; TUCK, G.; GLENDINING, M. J.; SMITH, P. The potential distribution of bioenergy crops in the UK under present and future climate. Biomass and Bioenergy, v. 34, n. 12, p. 1935-1945, 2010.
BIEWALD, A.; ROLINSKI, S.; LOTZE-CAMPEN, H.; SCHMITZ, C.; DIETRICH, J. P. Valuing the Impact of Trade on Local Blue Water. Ecological Economics, v. 101, p. 43-53, 2014.
BIRKEL, C.; TETZLAFF, D.; SOULSBY, C. Modelling the impacts of land-cover change on streamflow dynamics of a tropical rainforest headwater catchment. Hydrological Sciences Journal, v. 57, n. 8, p. 1543-1561, 2012.
BONDEAU, A.; SMITH, P. C.; ZAEHLE, S.; SCHAPHOFF, S.; LUCHT, W.; CRAMER, W.; GERTEN, D.; LOTZE-CAMPEN, H.; MÜLLER, C.; REICHSTEIN, M.; SMITH, B. Modelling the role of agriculture for the 20th century global terrestrial carbon balance. Global Change Biology, v. 13, n. 3, p. 679-706, 2007.
BRAGA, B. P. F.; FLECHA, R.; PENA, D. S.; KELMAN, J. Pacto federativo e gestão de águas. Estudos Avançados, v. 22, n. 63, p. 17-42, 2008.
BRONSTERT, A.; KOLOKOTRONIS, V.; SCHWANDT, D.; STRAUB, H. Comparison and evaluation of regional climate scenarios for hydrological impact analysis: General scheme and application example. International Journal of
Climatology, v. 27, n. 12, p. 1579-1594, 2007.
CALDER, I. R. Hydrologic effects of land use change. In: MAIDMENT, D. R. (ed.) Handbook of Hydrology. New York: McGraw-Hill, 1992.
CBHSF - COMITÊ DA BACIA HIDROGRÁFICA DO RIO SÃO FRANCISCO. Plano Decenal de Recursos Hídricos da Bacia
Hidrográfica do Rio São Francisco – PBHSF (2004-2013) – Resumo Executivo. Salvador: CBHSF, 2004. 337p.
CHASE, T. N.; PIELKE, R. A.; KITTEL, T. G. F.; NEMANI, R. R.; RUNNING, S. W. Simulated impacts of historical land cover changes on global climate in northern winter. Climate Dynamics, v. 16, n. 2, p. 93-105, 2000.
CODEVASF - COMPANHIA DE DESENVOLVIMENTO DOS VALES DO SÃO FRANCISCO E PARNAÍBA. Plano diretor para o
desenvolvimento do Vale do São Francisco - PLANVASF: Programa para o Desenvolvimento da Irrigação (1989-2000).
Brasília: CODEVASF, 1989.
CODEVASF - COMPANHIA DE DESENVOLVIMENTO DOS VALES DO SÃO FRANCISCO E PARNAÍBA. Elenco de projetos. n.d. Disponível em: http://www.codevasf.gov.br/principal/perimetros-irrigados/elenco-de-projetos. Acesso em: 29 jun. 2013. CONRADT, T.; KUNDZEWICZ, Z. W.; HATTERMANN, F. ; WECHSUNG, F. Measured effects of new lake surfaces on regional precipitation. Hydrological Sciences Journal, v. 52, n. 5, p. 936-955, 2007.
DA CUNHA, D. A.; COELHO, A. B.; FÉRES; J. G. Irrigation as an adaptive strategy to climate change: an economic perspective on Brazilian agriculture. Environment and Development Economics, v. 20, n. 1, p. 57-79, 2015.
DA SILVA, T. G. F.; DE MOURA, M. S. B.; ZOLNIER, S.; SOARES, J. M.; VIEIRA, V. J. DE S.; JÚNIOR, W. G. F. Requerimento hídrico e coeficiente de cultura da cana-de-açúcar irrigada no semiárido brasileiro. Revista Brasileira de Engenharia
Agrícola e Ambiental, v. 16, n. 1, p. 64-71, 2012.
DA SILVA, G. N. S.; DE MORAES, M. M. G. A.; DA SILVA, A. C. S. Delimitação das áreas irrigadas no trecho do sub-médio do rio São Francisco. In: SIMPÓSIO DE RECURSOS HIDRÍCOS DO NORDESTE, 12., 2014, Natal. Anais... Natal: ABRH, 2014. DALRI, A. B.; CRUZ, R. L. Produtividade da cana-de-açúcar fertirrigada com N e K via gotejamento subsuperficial.
Engenharia Agrícola, Jaboticabal, v. 28, n. 3, p. 516-524, 2008.
DEFRIES, R.; ESHLEMAN, N. K. Land-use change and hydrologic processes: a major focus for the future. Hydrological
DELGADO, C. L. Rising consumption of meat and milk in developing countries has created a new food revolution. The
Journal of Nutrition, v. 133, n. 11, p. 3907S-3910S, 2003.
DIETRICH, J. P.; POPP, A.; LOTZE-CAMPEN, H. Reducing the loss of information and gaining accuracy with clustering methods in a global land-use model. Ecological Modelling, v. 263, p. 233-43, 2013.
DIETRICH, J. P.; SCHMITZ, C.; LOTZE-CAMPEN, H.; POPP, A.; MÜLLER, C. Forecasting technological change in agriculture—An endogenous implementation in a global land use model. Technological Forecasting and Social Change, v. 81, p. 236-49, 2014. FADER, M.; GERTEN, D.; THAMMER, M.; HEINKE, J.; LOTZE-CAMPEN, H.; LUCHT, W.; CRAMER, W. Internal and external green-blue agricultural water footprints of nations, and related water and land savings through trade. Hydrology and
Earth System Sciences, v. 15, n. 5, p. 1641-1660, 2011.
FALKENMARK, M.; LUNDQVIST, J.; WIDSTRAND, C. Macro-Scale Water Scarcity Requires Micro-Scale Approaches. Aspects of Vulnerability in Semi-Arid Development. Natural Resources Forum, v. 13, n. 4, p. 258-267, 1989.
FARIA, W. R. Modelagem e avaliação de fenômenos relacionados ao uso da terra no Brasil. Tese (PhD) – Faculdade de Economia, Administração e Contabilidade da Universidade de São Paulo, São Paulo, 2012. 275p.
FERRAZ, R. P. D.; Simões, M.; DUBREUIL, V. Avaliação da sustentabilidade hídrica da cultura canavieira através do uso de indicadores extraídos de modelos espaciais. Revista Brasileira de Ciências Ambientais, n. 29, p. 63-75, 2013.
FOHRER, N.; HAVERKAMP, S.; ECKHARDT, K.; FREDE, H. G. Hydrologic response to land use changes on the catchment scale. Physics and Chemistry of the Earth, Part B: Hydrology, Oceans and Atmosphere, v. 26, n. 7-8, p. 577-582, 2001. FRIEDL, M. A.; SULLA-MENASHE, D.; TAN, B.; SCHNEIDER, A.; RAMANKUTTY, N.; SIBLEY, A.; HUANG, X. MODIS Collection 5 global land cover: Algorithm refinements and characterization of new datasets. Remote Sensing of
Environment, v. 114, n. 1, p. 168-182, 2010.
GODFRAY, H. C. J.; BEDDINGTON, J. R.; CRUTE, I. R.; HADDAD, L.; LAWRENCE, D.; MUIR, J. F.; PRETTY, J.; ROBINSON, S.; THOMAS, S. M.; TOULMIN, C. Food Security: The Challenge of Feeding 9 Billion People. Science, v. 327, n. 5967, p. 812-818, 2010. GRAFTON, R. Q.; HUSSEY, K. (eds.). Water Resources Planning and Management. 1th edition. Cambridge: Cambridge University Press, 2011.
HABERL, H.; ERB, K.-H.; KRAUSMANN, F.; BONDEAU, A.; LAUK, C.; MÜLLER, C.; PLUTZAR, C.; STEINBERGER, J. K. Global bioenergy potentials from agricultural land in 2050: Sensitivity to climate change, diets and yields. Biomass and
Bioenergy, v. 35, n. 12, p. 4753-4769, 2011.
HANASAKI, N.; INUSUKA, T.; KANAE, S.; OKI, T. An estimation of global virtual water flow and sources of water withdrawal for major crops and livestock products using a global hydrological model. Journal of Hydrology, v. 384, n. 3-4, p. 232-244, 2010. HATTERMANN, F.F.; WEILAND, M.; HUANG, S.; KRYSANOVA, V.; KUNDZEWICZ, Z.W. Model-supported impact assessment for the water sector in Central Germany under climate change – a case study. Water Resources Management, v. 25, n. 13, p. 3113-3134, 2011.
HEMPEL, S.; FRIELER, K.; WARSZAWSKI, L.; SCHEWE, J.; PIONTEK, F. A trend-preserving bias correction - the ISI-MIP Approach. Earth System Dynamics, V. 4, n. 2, p. 219-236, 2013.
HOEKSTRA, A.; CHAPAGAIN, A.K. Water footprints of nations: water use by people as a function of their consumption pattern. Water Resources Management, v. 21, n. 1, p. 35-48, 2007.
HOEKSTRA, A.Y.; HUNG, P. Q. Virtual Water Trade: A Quantification of Virtual Water Flows between Nations in Relation
IBGE - INSTITUTO BRASILEIRO DE GEOGRAFIA E ESTATÍSTICA. Statistical data of the Brazilian Institute of Geography and
Statistics. Disponível em: <http://www.ibge.gov.br/webcart/>. Acesso em: 23 sep. 2013.
IBGE - INSTITUTO BRASILEIRO DE GEOGRAFIA E ESTATÍSTICA. Potencial agrícola. Disponível em: http://mapasinterativos. ibge.gov.br/arcgis/rest/services/AGRICOLA/MapServer. Acesso em: 21 nov. 2011.
IBGE - INSTITUTO BRASILEIRO DE GEOGRAFIA E ESTATÍSTICA. Climas. n.d. Disponível em: http://mapasinterativos.ibge. gov.br/arcgis/rest/services/CLIMAS/MapServer. Acesso em: 21 nov. 2011.
KRAUSE, M.; LOTZE-CAMPEN, H.; POPP, A.; DIETRICH, J. P.; BONSCH, M. Conservation of undisturbed natural forests and economic impacts on agriculture. Land-use Policy, v. 30, n. 1, p. 344-354, 2013.
KRYSANOVA, V.; MEINER, A.; ROOSAARE, J.; VASILYEV, A. Simulation modelling of the coastal waters pollution from agricultural watershed. Ecological Modelling, v. 49, n. 1-2, p. 7-29, 1989.
KRYSANOVA, V.; MÜLLER-WOHLFEIL, D. I.; BECKER, A. Development and test of a spatially distributed hydrological/ water quality model for mesoscale watersheds. Ecological Modelling, v. 106, n. 2-3, p. 261-289, 1998.
KRYSANOVA, V.; WECHSUNG, F.; ARNOLD, J.; SRINIVASAN, R.; WILLIAMS, J. SWIM (Soil and Water Integrated Model)
User Manual. PIK Report 69. Potsdam: Potsdam Institute for Climate Impact Research, 2000. 243p.
LÁZARO, Y. M. C.; DA SILVA SILVEIRA, C.; DE SOUZA FILHO, F. DE A.; LEMOS, W. E. D. Projeções de precipitação para o século XXI utilizando sistema de classificação hierárquica de modelos: aplicação para o nordeste setentrional brasileiro. Revista Brasileira de Ciências Ambientais, n. 32, p. 1-11, 2014.
LAHMER, W.; PFÜTZNER, B.; BECKER, A. Assessment of land-use and climate change impacts on the mesoscale.
Physics and Chemistry of the Earth, Part B: Hydrology, Oceans and Atmosphere, v. 26, n. 7-8, p. 565-575, 2001.
LERNER, G. L. S.; CARPIO, L. G. T. Estudo de impactos na geração hidroelétrica ao longo do rio São Francisco devido à transposição de suas águas utilizando modelo matemático de fluxos em rede Acquanet. In: SIMPÓSIO BRASILEIRO DE PESQUISA OPERACIONAL, 38., 2006, Goiânia. Anais… Goiânia: Sociedade Brasileira de Pesquisa Operacional, 2006. p. 533-544.
LOTZE-CAMPEN, H.; MUELLER, C.; BONDEAU, A.; ROST, S.; POPP, A.; LUCHT, W. Global food demand, productivity growth, and the scarcity of land and water resources: a spatially explicit mathematical programming approach. Agricultural
Economics, v. 39, n. 3, p. 325-338, 2008.
MANETA, M. P.; TORRES, M.; WALLENDER, W. W.; VOSTI, S.; KIRBY, M.; BASSOI, L. H.; RODRIGUES, L. N. Water demand and flows in the São Francisco River Basin (Brazil) with increased irrigation. Agricultural Water Management, v. 96, n. 8, p. 1191-1200, 2009.
MARTINS, S. R.; SCHLINDWEIN, S. L.; D’AGOSTINI, L. R.; BONATTI, M.; DE VASCONCELOS, A. C. F.; HOFFMAN, A. F.; FANTINI, A.C. Mudanças climáticas e vulnerabilidade na agricultura: desafios para desenvolvimento de estratégias de mitigação e adaptação. Revista Brasileira de Ciências Ambientais, n. 17, p. 17-27, 2010.
MASSAGARDI, M. A.; FERNANDES, V.; DE VASCONCELOS, E. C.; JANISSEK, P. Análise crítica do Plano Decenal de Expansão de Energia – PDEE 2021 - Questões socioeconômicas e ambientais decorrentes das estratégias brasileiras para o etanol combustível. Revista Brasileira de Ciências Ambientais, n. 29, p. 139-151, 2013.
MEDEIROS, Y. D. P.; FREITAS, I. M. P.; STIFELMAN, G. M.; FREIRE, R. R.; O´KEEFFE, J. Social participation in the environmental flow assessment: the são francisco river case study. Gesta - Revista Eletrônica de Gestão e Tecnologias
MMA - MINISTÉRIO DO MEIO AMBIENTE. uso_baixosf. 2002. Disponível em: http://mapas.mma.gov.br/i3geo/ datadownload.htm. Acesso em: 12 mar. 2014.
MMA - MINISTÉRIO DO MEIO AMBIENTE. uso_smsf. 2000. Disponível em: http://mapas.mma.gov.br/i3geo/ datadownload.htm. Acesso em: 12 mar. 2014.
MMA - MINISTÉRIO DO MEIO AMBIENTE. Terras para irrigação. n.d. Disponível em: http://mapas.mma.gov.br/i3geo/ datadownload.htm. Acesso em: 12 mar. 2014.
MONTENEGRO, A.; RAGAB, R. Hydrological response of a Brazilian semi-arid catchment to different land use and climate change scenarios: a modelling study. Hydrological Processes, v. 24, n. 19, p. 2705-2723, 2010.
MONTENEGRO, S.; RAGAB, R. Impact of possible climate and land use changes in the semi arid regions: A case study from North Eastern Brazil. Journal of Hydrology, v. 434-435, p. 55-68, 2012.
MÖLDERS, N. Similarity of microclimate as simulated in response to landscapes of the 1930s and the 1980s. Journal of
Hydrometeorology, v. 1, n. 4, p. 330-352, 2000.
MOSCRIP, A. L.; MONTGOMERY, D. R. Urbanization, flood frequency, and salmon abundance in Puget Lowland streams.
Journal of the American Water Resources Association, v. 33, n. 6, p. 1289-1297, 1997.
NAKICENOVIC, N.; SWART, R. (eds.). Special Report on Emissions Scenarios: A Special Report of Working Group III of the
Intergovernmental Panel on Climate Change. 1st edition. Cambridge: Cambridge University Press, 2000.
NARAYANAN, B.; WALMSLEY, T. (eds.). Global Trade, Assistance. and Production: The GTAP 7 Data Base. Indiana: Center for Global Trade Analysis - Purdue University, 2008.
OKI, T.; KANAE, S. Virtual water trade and world water resources. Water Science and Technology, v. 49, n. 7, p. 203-209, 2004. PIELKE, R. A. S. Land use and Climate Change. Science, v. 310, n. 5754, p. 1625-1626, 2005.
PINGALI, P. Westernization of Asian diets and the transformation of food systems: Implications for research and policy.
Food Policy, v. 32, n. 3, p. 281-298, 2007.
ROSEGRANT, M. W. & CLINE, S. A. Global Food Security: Challenges and Policies. Science, v. 302, n. 5652, p. 1917-1919, 2003. RÖTTER, R.; VAN DE GEIJN, S. C. Climate change effects on plant growth, crop yield and livestock. Climatic Change, v. 43, n. 4, p.651-681, 1999.
ROUNSEVELL, M.; REAY, D. S. Land use and climate change in the UK. Land use Policy, v. 26, S160-S169, 2009.
SAHIN, V.; HALL, M. J. The effects of afforestation and deforestation on water yields. Journal of Hydrology, v. 178, n. 1-4, p. 293-309, 1996.
SCHAEFFER, R.; SZKLO, A. S.; DE LUCENA, A. F. P.; DE SOUZA, R. R.; BORBA, B. S. M. C.; DA COSTA, I. V. L.; JÚNIOR, A. O. P.; DA CUNHA, S. H. F. Mudanças climáticas e segurança energética no Brasil. Rio de Janeiro: Nova Brasileira, 2008. 35p. SEIBERT, J.; MCDONNELL, J. J. Land-cover impacts on streamflow: a change-detection modelling approach that incorporates parameter uncertainty. Hydrological Sciences Journal, v. 55, n. 3, p. 316-332, 2010.
SIEGMUND-SCHULTZE, M; KÖPPEL, J; DO CARMO SOBRAL, M. Balancing ecosystem services and societal demands in a highly managed watershed: Setup and progress of a comprehensive research project. Revista Brasileira de Ciências
SILVA, M. DE A.; ARANTES, M. T.; RHEIN, A. F. DE L.; GAVA, G. J. C.; KOLLN, O. T. Potencial produtivo da cana-de-açúcar sob irrigação por gotejamento em função de variedades e ciclos. Revista Brasileira de Engenharia Agrícola e
Ambiental, v. 18, n. 3, p. 241-249, 2014.
TUCK, G.; GLENDINING, M. J.; SMITH, P.; HOUSE, J. I.; WATTENBACH, M. The potential distribution of bioenergy crops in Europe under present and future climate. Biomass and Bioenergy, v. 30, n. 3, p. 183-197, 2006.
VALIN, H.; SANDS, R. D.; VAN DER MENSBRUGGHE, D.; NELSON, G. C.; AHAMMAD, H.; BLANC, E.; BODIRSKY, B.; FUJIMORI, S.; HASEGAWA, T.; HAVLIK, P.; HEYHOE, E.; KYLE, P.; MASON-D’CROZ, D.; PALTSEV, S.; ROLINSKI, S.; TABEAU, A.; VAN MEIJL, H.; VON LAMPE, M.; WILLENBOCKEL, D. The future of food demand: understanding differences in global economic models. Agricultural Economics. v. 45, p. 51-67, 2014.
VORÖSMARTY, C. J.; GREEN, P.; SALISBURY, J.; LAMMERS, R. B. Global Water Resources: Vulnerability from Climate Change and Population Growth. Science, v. 289, n. 5477, p. 284-88, 2000.
WEEDON, G. P.; GOMES, S.; VITERBO, P.; SHUTTLEWORTH, W. J.; BLYTH, E.; ÖSTERLE, H.; ADAM, J. C.; BELLOUIN, N.; BOUCHER, O.; BEST, M. Creation of the WATCH Forcing Data and Its Use to Assess Global and Regional Reference Crop Evaporation over Land during the Twentieth Century. Journal of Hydrometeorology, v. 12, n. 5, p. 823-848, 2011. WENKEL, K. O.; BERG, M.; MIRSCHEL, W.; WIELAND, R.; NENDEL, C.; KÖSTNER, B. LandCaRe DSS - An interactive decision support system for climate change impact assessment and the analysis of potential agricultural land use adaptation strategies. Journal of Environmental Management, v. 127, Supplement, p. S168-S183, 2013.