Recebido para publicação: Janeiro de 2010 • Aceite para publicação: Março de 2011 Received for publication: January 2010 • Accepted for publication: March 2011
551
Características diagnósticas dos testes:
sensibilidade, especificidade, valores
preditivos e likelihood ratios
[43]
ANTÓNIOVAZCARNEIRO
Centro de Estudos de Medicina Baseada na Evidência Faculdade de Medicina da Universidade de Lisboa Centro Académico de Medicina de Lisboa, Lisboa, Portugal
Rev Port Cardiol 2011; 30 (05): 551-558
RESUMO O processo diagnóstico envolve sempre dois passos sequenciais: o primeiro avalia a situação clínica do doente através dos dados da história e exame objectivo e o segundo obtém testes de confirmação da(s) hipótese(s) diagnóstica(s) colocada(s). O primeiro passo releva da psicologia cognitiva e tem os seus viéses próprios, com métodos de aprendizagem específicos. O segundo baseia-se em dados científicos que definem as propriedades discriminatórias dos testes, obtidas em estudos comparando o novo teste (também designado como teste índex) e o teste considerado como
gold-standard na definição da doença.
Neste artigo descrevemos um quadro de classificação das características diagnósticas de um teste, através da clássica tabela de contingência 2x2. Esta informação pode servir de base à utilização racional dos testes diagnósticos na clínica prática.
Palavra-chave:
Características diagnósticas dos testes; Sensibilidade; Especificidade; Valores preditivos; Likelihood ratios; Medicina baseada na evidência
Diagnostic characteristics of tests: sen-sitivity, specificity, predictive values and likelihood ratios
ABSTRACT
The diagnostic process always involves two sequential steps: the first assesses the patient’s clinical situation through data obtained from the history and physical examination, and the second requests tests to confirm the diagnostic hypothesis. The first step belongs to cognitive psychology and has its own biases and learning meth-ods. The second is based on scientific data that defines the discriminatory power of tests from studies comparing a new test (the so-called index test) and the gold standard for diagnosing the disease.
In this article we present a classification of the diagnostic characteristics of tests using a 2x2 contingency table. This information can be used to support the rational use of diagnostic tests.
K
Keeyy wwoorrddss
Diagnostic characteristics of tests; Sensitivity; Specificity; Predictive values; Likelihood ratios; Evidence-based medicine.
INTRODUÇÃO
O
processo diagnóstico envolve inicial-mente uma estimativa probabilística de doença, que se consegue definir através de dois passos fundamentais: 1. uma avaliação clínica da situação, através da história e do exame físico, que fornece uma probabilidade pré-teste- a prevalência da doença(1,2). 2. are-quisição dos testes diagnósticos que enten-demos como necessários e cujos resultados nos permitem fazer variar essa mesma proba-bilidade, até atingirmos um limiar em que excluímos ou inferimos um diagnóstico(3).
A primeira parte do processo diagnóstico (quando não se trata de um diagnóstico por padrões, mas sim por raciocínio probabilís-tico) consiste na identificação de grupos de sinais e sintomas. O clínico experiente organi-za de seguida mentalmente uma lista de doenças prováveis (lista probabilística), ou que possam ter consequências graves se não tratadas (lista prognóstica) ou ainda que sejam mais sensíveis ou tratamento (lista pragmá-tica), seleccionando a melhor explicação para os problemas do doente – a chamada hipótese principal, também designada como o diagnós-tico provisório. Este define-se, na nomencla-tura da teoria dos limiares diagnósticos, como a probabilidade pré-teste e obtém-se através da experiência clínica ou, melhor ainda, de informação científica publicada(4).
As indicações para se requisitar um teste diagnóstico são principalmente de duas ordens de razões(5):
• Validade no contexto clínico (o teste ajuda a distinguir entre o doente e o saudá-vel?)
• Alteração da estratégia clínica pela determinação daprobabilidade de doença (os resultados do teste mudam o plano de trata-mento?).
Uma análise do processo de decisão no uso de testes diagnósticos pode basear-se no cha-mado limiar de decisão (threshold approach)(6).
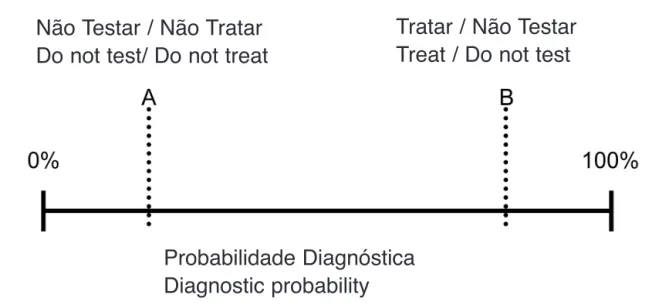
A Figura 1 representa esta abordagem: a probabilidade de doença está representada num segmento de recta, variando entre 0% (ausência de doença) e 100% (presença de
552
INTRODUCTION
T
he diagnostic process initially involves estimating the probability of disease, which is arrived at through two essential steps: a clinical assessment of the situation through data obtained from the history and physical examination, which provides a pretest probability (corresponding to the prevalence of the disease)(1, 2); a request for thediagnostic tests that are deemed necessary and on the basis of the results this probabili-ty changes, until a threshold is reached that includes or excludes the clinical diagnosis(3).
The first part of the diagnostic process (when the diagnosis is not through patterns but by probabilistic reasoning) consists of identifying groups of signs and symptoms. The experienced clinician then makes a men-tal list of likely disorders (a probabilistic list) that may have serious consequences if left untreated (a prognostic list) or that are more responsive to treatment (a pragmatic list) and selects the best explanation for the patient’s problems. This is the principal hypothesis, also known as a provisional diagnosis, and in the vocabulary of diagnostic threshold theory is termed the pretest probability; it is arrived at through clinical experience or, better, from published data(4).
There are two main reasons for requesting a diagnostic test(5):
- to provide validity in the clinical context (does the test help distinguish between a sick and a healthy individual?);
- to modify the clinical approach by deter-mining the probability of disease (do the test results change the treatment plan?).
One way to analyze the decision-making process for diagnostic testing is the so-called threshold approach(6).
Figure 1 represents this approach. The disease probability is represented as a straight line and ranges between 0% (absence of disease) and 100% (presence of disease), according to the available diagnostic informa-tion. Two limits, A and B, are marked on this line, which represent the testing threshold (the signs and symptoms do not suggest that
the disease is present) and the test-treatment threshold (the signs and symptoms are pathog-nomic of the disease). The probability of either being the case is determined by the information obtained in the history and physi-cal examination.
If, after taking the history and performing a physical examination, one of the limits is crossed – below A (high probability of the dis-ease not being present) or above B (high prob-ability of the disease being present), the diag-nosis is considered to be unlikely and is aban-doned, or it is considered to be highly likely and the patient is treated, respectively. For example, chest pain in a healthy 22-year-old woman who does not smoke, has no family his-tory of coronary artery disease (CAD) and who does not take drugs, including cocaine, will be seen in a very different light from chest pain in a 65-year-old man who smokes and has dia-betes, hypercholesterolemia and known CAD. In the first case the likelihood of myocardial infarction is negligible, since the prevalence of CAD in this age-group is <1%, while in the second case the likelihood of an acute coro-nary event is very high (CAD prevalence in this age-group being >80%). Tests are in fact of little use in this situation, since an abnor-mal troponin level in the woman would proba-bly be considered a false positive, while even
553
Rev Port Cardiol 2011; 05: 551-558
doença), de acordo com a informação diagnóstica obtida. Sobre este segmento marcam-se dois limites - A e B - que representam respectivamente o limiar de exclusão (os sinais e sintomas não sugerem a patologia em causa) e o limiar de actuação (os sinais e sintomas são patognomónicos da patologia em causa), sendo esta probabilidade modulada pela informação obtida na história e exame objectivo.
Se no final da colheita anamnéstica se ultrapassar com confiança um dos limites (para baixo de A – alta probabilidade de não se estar em presença de doença - ou para cima de B – alta probabilidade de se estar em presença de doença), então decide-se respectivamente abandonar o diagnóstico (por pouco provável) ou tratar directamente (por altamente provável). Por exemplo: uma dor retroesternal (DRE) numa jovem saudável de 22 anos, não fumadora, sem história familiar de doença coronária (DC) e que não consome drogas (especialmente cocaína) é encarada de maneira radicalmente diferente de uma DRE num homem de 65 anos, diabético, com hipercolesterolémia, fumador e com DC conhecida. No 1.º caso a probabilidade de enfarte agudo de miocárdio é negligenciável (já que a prevalência de DC é <1% neste grupo etário), enquanto que no 2.º caso existe
Figura 1. Limiar de decisão na requisição de testes diagnósticos Figure 1. Decision thresholds for requesting diagnostic tests.
Não Testar / Não Tratar
Do not test/ Do not treat
Tratar / Não Testar
Treat / Do not test
Probabilidade Diagnóstica
Diagnostic probability
uma probabilidade muito elevada de se estar perante um evento coronário agudo (neste grupo a prevalência de DC é > 80%). Em bom rigor, os testes não ajudam grande coisa aqui, já que se se obtivesse uma troponina anormal na mulher pensaríamos estar perante um re-sultado falso positivo, enquanto no caso do homem, mesmo que a troponina fosse normal, internávamo-lo para exames ulteriores de ex-clusão de enfarte agudo.
Como foi visto, os testes são especialmente úteis se a probabilidade diagnóstica após a história e o exame físico se situar entre os dois limites anteriormente referidos: A (baixa pro-babilidade de doença) e B (alta propro-babilidade de doença). A obtenção ulterior de testes dia-gnósticos permite-nos, dependendo dos seus resultados, fazer pender o diagnóstico num sentido ou noutro, que é como quem diz no sentido da ausência ou da presença provável de doença(3).
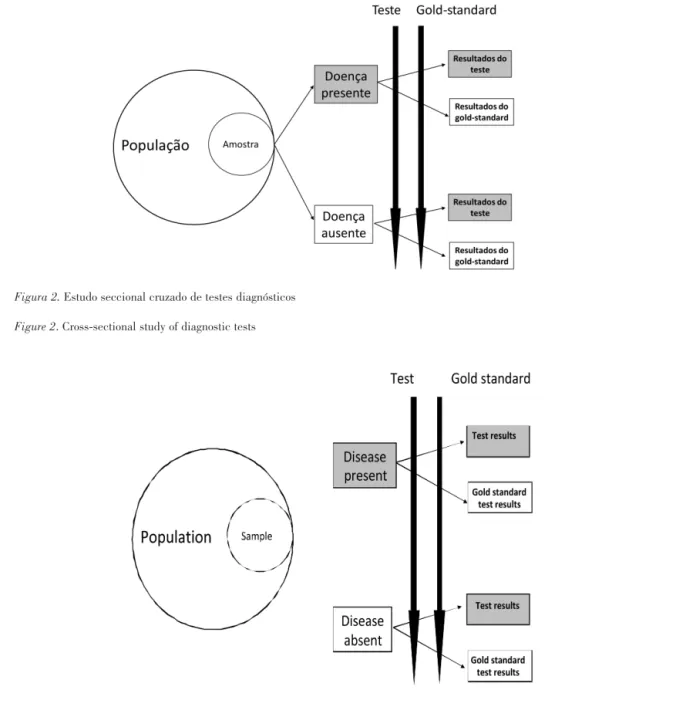
Como é óbvio, quando falamos de um teste ele pode ser bioquímico plasmático (por ex. um factor natriurético auricular), uma prova funcional (prova de esforço) ou de imagem (um ecocardiograma) - os princípios são os mesmos. Os estudos mais utilizados para conseguir definir as características diagnósticas de um novo teste designam-se como seccionais cruzados (Figura 2) e comparam o teste em estudo (também chamado teste índex) com o chamado gold-standard numa série de doen-tes.
Este tipo de estudos fornece um conjunto de resultados que permitem a construção de uma tabela com as características discrimi-natórias/diagnósticas do teste índex(7).
CONCLUSÕES
A determinação das características discri-minativas de um novo teste diagnóstico obtém-se através de estudos seccionais cru-zados, em amostras com gamas de gravidade de doença previamente definidas. A cha-mada STARD Initiative(11) define regras
práticas de reportar estudos definindo a exactidão diagnóstica de um teste (que se
if troponin levels were normal in the man, he would be admitted for further exams to exclude infarction.
As we have seen, tests are particularly use-ful when the diagnostic probability after the history and physical examination is between A (low probability of disease) and B (high prob-ability of disease). The results of diagnostic tests will clarify the situation one way or the other, i.e. whether the disease is likely to be present or not(3).
Obviously, whether the test is a laboratory reading of plasma biochemistry (e.g. atrial natriuretic peptides), a functional test (e.g. exercise testing), or an imaging study (such as an echocardiogram), the principles are the same.
The studies mainly used to define the diag-nostic characteristics of a new test are cross-sectional studies (Figure 2). These studies compare the new test – the index test – with the gold standard test in a series of patients.
Using the results of such a study, a table can be constructed to show the discriminatory and diagnostic characteristics of the index test(7).
CONCLUSIONS
The discriminatory characteristics of a new diagnostic test are determined by cross-sec-tional studies of population samples with a defined range of disease severity. The STARD Initiative(11) aimed to develop a checklist of
items that should be included in the report of a study of the diagnostic accuracy of a test, which can be defined as the degree of agree-ment between the gold standard and index tests.
The measures of association of a study to determine the diagnostic characteristics of a test usually include sensitivity and specificity, positive and negative predictive values, posi-tive and negaposi-tive likelihood ratios, diagnostic odds ratios and diagnostic accuracy1.
In this article we have presented a table with a larger than usual number of definitions, based on a variety of sources, which we hope will prove useful in clinical practice.
pode definir como a dimensão da concor-dância entre o teste gold-standard e o teste índex).
As medidas de associação de um estudo determinando as características diagnósticas de um teste incluem habitualmente a sensibilidade e a especificidade, os valores preditivos positivos e negativos, os likelihood
ratios positivos e negativos, os odds ratios
dia-gnósticos e a exactidão diagnóstica.
Neste artigo apresentámos, baseados em
fontes variadas, um exemplo de tabela com um número alargado de definições, que esperamos sejam úteis na prática clínica.
Pedido de Separatas Address for reprints: António Vaz Carneiro
Faculdade de Medicina de Lisboa 1649-035 Lisboa
e-mail: ave@fm.ul.pt 555
Rev Port Cardiol 2011; 05: 551-558
Figura 2. Estudo seccional cruzado de testes diagnósticos Figure 2. Cross-sectional study of diagnostic tests
Figura 2. Estudo seccional cruzado de testes diagnósticos Figure 2. Cross-sectional study of diagnostic tests
556
1 Existem outras metodologias de avaliação das características diagnósticas dos testes, nomeadamente as ReceiverOperating Curves
(curvas ROC), que serão apresentadas em artigo ulterior.
Condição da doença na população
Resultado do teste Doentes com a doença Doentes sem doença Totais
Positivo a b a + b
Negativo c d c + d
Totais a + c b + d a + b + c + d
a Casos verdadeiros positivos
b Casos falsos positivos
c Casos falsos negativos
d Casos verdadeiros negativos
a + b Todos os testes positivos
a + c Todos os doentes
b + d Todos os saudáveis
c + d Todos os testes negativos a + b + c + d Dimensão da amostra
(b+d)/(a+b+c+d) Percentagem de saudáveis (1-prevalência) b/(a+b) Percentagem de testes positivos incorrectos (1-VPP) c/(c+d) Percentagem de testes negativos incorrectos (1-VPN)
b/a Índice de falsos positivos (rácio de falsos vs. verdadeiros positivos) c/d Índice de falsos negativos (rácio de falsos vs. verdadeiros
negativos)
a/(a+c) Sensibilidade= percentagem de verdadeiros positivos (doentes que apresentam testes positivos)
d/(b+d) Especificidade=percentagem de verdadeiros negativos (saudáveis que apresentam testes negativos)
b/(b+d) = 1-especificidade Taxa de erros falsos positivos= percentagem de saudáveis com testes positivos
c/(a+c) = 1 - sensibilidade Taxa de erros falsos negativos= percentagem de doentes com testes negativos
(a+c)/(a+b+c+d) Prevalência= percentagem da população com a doença a/(a+b) = (prevalência x sensibilidade)/[(prevalência x Valor preditivo positivo (VPP) = percentagem dos que apresentam sensibilidade) + (1-prevalência) x (1-especificidade)] um teste positivo e que têm de facto doença
d/(c+d) = (1-prevalência) x
especificidade/[(1-prevalência) x Valor preditivo negativo (VPN)= percentagem dos que apresentam especificidade + prevalência x (1-sensibilidade)] um teste negativo e que não têm de facto doença
(a+d)/(a+b+c+d) Exactidão diagnóstica= percentagem de resultados correctos [a/(a+c)]/[b/(b+d)] = sensibilidade/(1-especificidade) Likelihood ratio positivo
[c/(a+c)]/[d/(b+d)] = (1-sensibilidade)/ especificidade Likelihood ratio negativo [a/(a+b)]/[c/(c+d)] Rácio de riscos (risco relativo) (a/c)/(b/d) = (a x d) / (b x c) Odds ratio diagnóstico
Adaptado de 7,4,8,9,10,5
NOTA: Esta tabela é consideravelmente mais desenvolvida nas suas análises do que é habitual, mas tem o grande mérito de extrair dos dados obtidos num estudo comparando um teste de referência (gold-standard) com um teste inovador, toda a informação neles contida.
Tabela – Características diagnósticas de testes
NOTA: a verdadeira prevalência da doença está presente na amostra utilizada para derivar a tabela e o sujeito é considerado ter a doença se o teste gold-standard for positivo
557
Rev Port Cardiol 2011; 05: 551-558
State of the disease in the population
Test results Patients with disease Patients without disease Total
Positive a b a + b Negative c d c + d Total a + c b + d a + b + c + d a True positives b False positives c False negatives d True negatives a + b All positives
a + c All individuals with disease b + d All healthy individuals
c + d All negative tests
a + b + c + d Sample size
(b+d)/(a+b+c+d) Percentage of healthy individuals (1-prevalence) b/(a+b) Percentage of false positives (1-PPV)
c/(c+d) Percentage of false negatives (1-NPV)
b/a False positive index (ratio of false to true positives) c/d False negative index (ratio of false to true negatives)
a/(a+c) Sensitivity == percentage of true positives (individuals with disease with positive tests)
d/(b+d) Specificity == percentage of true negatives (healthy individuals with negative tests)
b/(b+d) = 1-specificity False positive error rate= percentage of healthy individuals with positive tests
c/(a+c) = 1-sensitivity False negative error rate = percentage of individuals with disease with negative tests
(a+c)/(a+b+c+d) Prevalence= percentage of the population with disease
a/(a+b) = (prevalence x sensitivity)/ Positive predictive value (PPV)= percentage of those with a positive [( prevalence x sensitivity) + (1-prevalence) x (1-specificity)] test who have the disease
d/(c+d) = (1-prevalence) x specificity/[(1-prevalence)
x specificity + prevalence x (1-sensitivity)] Negative predictive value (NPV)= percentage of those with a nega-tive test who do not have the disease
(a+d)/(a+b+c+d) Diagnostic accuracy= percentage of correct results [a/(a+c)]/[b/(b+d)] = sensitivity/(1-specificity) Positive likelihood ratio
[c/(a+c)]/[d/(b+d)] = (1-sensitivity)/ specificity Negative likelihood ratio [a/(a+b)]/[c/(c+d)] Risk ratio (relative risk) (a/c)/(b/d) = (a x d) / (b x c) Diagnostic odds ratio Table I. Diagnostic characteristics of tests
Note: the true prevalence of the disease is that found in the sample used to derive the table, in which an individual is considered to have the disease if the gold standard test is positive.
Adapted from(7, 4, 8-10, 5)
Note: This table is considerably more comprehensive in its formulas than most, but it has the advantage of enabling all the relevant information to be extracted from a study comparing a gold standard test with a new test.
1There are other methods for assessing the diagnostic characteristics of tests, including receiver operating characteristic (ROC)
558
BIBLIOGRAFIA / REFERENCES
1. Klein JG. Five pitfalls in decisions about diagnosis and pre-scribing. BMJ 2005;330:781-783.
2. Carneiro AV. O raciocínio clínico. Qual a sua natureza? Pode ensinar-se? Rev Port Cardiol 2003;22:433-443.
3. Paulo S, Mendes S, Vizinho R, Carneiro AV. Testes diagnósti-cos, probabilidades pré-teste e pós-teste e a sua utilização na prática clínica. Rev Port Cardiol 2004;23:1187-1198.
4. User’s Guides to the Medical Literature. 2nd. New York: McGraw-Hill; 2008
5. Mayer D. Essential evidence-based medicine. 1st. Cambridge: Cambridge University Press; 2004
6. Pauker SG, Kassirer JP. The threshold approach to clinical decision making. N Engl J Med 1980;302:1109-1117.
7. Katz DL. Clinical epidemiology & evidence-based medicine. 1st. Thousand Oaks: Sage Publications; 2001
8. Wulff HR, Gotzsche PC. Rational Diagnosis and Treatment. Evidence-Based Clinical Decision Making. 1st. Oxford: Blackwell Science; 2000
9. Ebell MH. Evidence-based diagnosis. 1st. New York: Springer; 2001
10. Newman TB, Kohn MA. Evidence-based diagnosis. 1st. Cambridge: Cambridge University Press; 2009
11. Bossuyt PMM, Reitsma JB, Bruns DE, Gatsonis CA, Glasziou P, Irwig LM, et al., for the STARD Group. Towards complete and accurate reporting of studies of diagnostic accuracy: the STARD initiative. Ann Int Med 2003;138:40-44.