93
GROWTH OF THE COMMON BEAN SUBMITTED TO DIFFERENT LEVELS OF WATER DEFICIT IN THE SOIL
Camila Aparecida da Silva Martins1, Edvaldo Fialho dos Reis1, Giovanni de Oliveira Garcia1
1Universidade Federal do Espírito Santo. E-mail: [email protected]; [email protected]; [email protected]
ABSTRACT
The objective of this study was to evaluate the effect of water deficit on the growth of common bean cultivated in medium and clayey soil. Two experiments were developed in factorial scheme of 2 x 4 with tension for the determination of field capacity on two levels and soil water deficit on four levels in a completely randomized design with three replicates for each soil. Growth analyzes were performed in two phenological stage of crop and the data were submitted to an analysis of variance (p ≤ 0.05). When significant, the F Test (p ≤ 0.05) was used for the tension factor and regression analysis for the water deficit factor. The water content in the soil of 40 and 60% of available water exerted negative effects on leaf water potential, leaf area and total dry matter of the common bean, independent of the voltage adopted in determining the field capacity.
Keywords: Field capacity, water tension, irrigation
CRESCIMENTO DO FEIJOEIRO COMUM SUBMETIDO A DIFERENTES NÍVEIS DE DÉFICIT HÍDRICO NO SOLO
RESUMO
Objetivou-se avaliar o efeito do déficit hídrico no crescimento do feijoeiro comum cultivado em solo de textura média e argilosa. Foram desenvolvidos dois experimentos no esquema fatorial 2 x 4, sendo a tensão para determinação da capacidade de campo em dois níveis e déficit hídrico no solo em quatro níveis, em um delineamento inteiramente casualizado, com três repetições para cada solo. As análises de crescimento foram realizadas em duas fases fenológicas da cultura e os dados foram submetidos à análise de variância (p ≤ 0,05). Quando significativos, utilizou-se o teste F (p ≤0,05) para
o fator tensão e a análise de regressão para o fator déficit hídrico. O conteúdo de água no solo de 40 e 60% da água disponível exerceram efeitos negativos sobre o potencial hídrico foliar, área foliar e matéria seca total do feijoeiro comum, independente da tensão adotada na determinação da capacidade de campo.
Palavras-chave: Capacidade de campo, tensão de água, irrigação
INTRODUCTION
Common bean (Phaseolus vulgaris L.) is one of the main products of Brazilian family agriculture, cultivated in diversified production systems and in all regions of the country, with Brazil being the second largest producer in the world and the main consumer of this crop (LOPES et al. 2011), with production of 3.2 million tons in the 2014/2015 harvest and cultivated area of 3 million hectares (CONAB, 2016).
The cultivation of common bean in areas of tropical climate causes the plants to be exposed to the occurrence of high temperatures, at least in some phenological phase of the crop (GUIMARÃES et al., 2011). In this context, the increase in respiratory activity, reduction in the rate of assimilation of carbon dioxide, increase of biomass, reduction of cycle and reduction in grain yield are some effects caused by high temperatures associated to a period of water deficit (PINHEIRO & CHAVES, 2011).
The reduction of grain yield due to high temperatures has been related to pollen grain sterility, reduction in the rate of flowers’ fertilization and abortion of flowers and pods (GUIMARÃES et al., 2011). Furthermore, physiological processes of importance to the plant, such as transpiration, photosynthesis, respiration, growth, and productivity are influenced by changes in the water content of leaves (ENDRES et al., 2010).
The availability of water in the soil is one of the main limiting factors for common bean productivity, because crop yield is affected by the soil water condition, since the deficit or excess of water in the soil, in the different phenological phases of the crop causes reduction in productivity in different proportions (MIORINI et al., 2011).
The effect of water restriction on plant development has been the subject of researches carried out by Endres et al. (2010), Nascimento et al. (2011) and Catuchi et al. (2012). Data from the literature show that the evaluation of the degree of hydration of the plants when submitted to the water deficit in
95
different phenological phases evidences the occurrence of significant reductions in leaf water potential, stomatal conductance and leaf transpiration, with consequent increase in leaf temperature (ENDRES et al., 2010).
But regarding the soil water availability, leaf water potential and common bean growth, research is incipient and there is a lack of information, mainly for the Ouro Negro cultivar. Despite the existence of a considerable number of studies in the literature on the influence of water deficit on leaf water potential, growth and on the production components of cowpea plants (NASCIMENTO et al. 2011).
In this sense, it is necessary to intensify studies on crop response capacity to soil water deficit levels, the efficiency of crop water use and the amount of water that provides better crop performance without compromising production costs. The objective of this study was to evaluate the effect of soil water availability on leaf water potential in the morning and the growth of common bean grown on two soils (Oxisol and Ultisol) in greenhouse.
MATERIALS AND METHODS
The experiment was conducted in the greenhouse at the Center of Agrarian Sciences and Engineering, Federal University of Espírito Santo (CCAE - UFES) in Alegre, state of Espírito Santo, Brazil, situated at an altitude of 119 m, with geographical coordinates 20º 45’ 2,3” South latitude and 41º 29’ 17,7” West longitude. The predominant climate in the region is the Cwa type (subtropical, hot and humid in summer and dry in winter), according to Köppen classification, with an annual average rainfall of 1200 mm and a mean annual temperature of 23ºC.
For the accomplishment of this work, two experiments were installed, in factorial scheme of 2 x
4, being the tension for the determination of field capacity on two levels (T1 = 0.010 MPa e
T2 = 0.033 MPa) and soil water deficit on four levels (WD1 = 0%, WD2 = 20%, WD3 = 40% e
WD4 = 60% of available soil water) in a completely randomized design, with three replicates and
evaluations in two phenological stages of crop (V4 - third trifoliolate sheet expanded and R5 – pre-flowering), for each experiment, totaling 96 experimental units.
Experiment 1 was installed in pots using an Oxisol and experiment 2 was installed in pots using a Ultisol.
Surface samples of Oxisol and Ultisol were collected in areas cultivated in agroforestry system (Conilon coffee plantation between eucalyptus) and pasture, respectively, in the city of Alegre-ES. The soil was air-dried, prepared and passed through a 2.0 mm sieve to the obtaining of air-dried soil samples and carried out its physical and chemical characterization (Tables 1 and 2).
Table 1. Physical attributes of Oxisol and Ultisol (Alegre-ES, 2012).
Soil Granulometric
(1)
Ds(2) Dp(3) PT(4)
Sand Silt Clay
--- g kg-1 --- --- kg dm-3 --- -- m3 m-3 --
Oxisol 432 172 396 1.22 2.21 0.448
Ultisol 633 67 298 1.26 2.40 0.475
(1) Pipette Method (Slow Agitation): Sand (⌀> 0.05 mm); Silt (⌀ de 0.05 – 0.002 mm); Clay (⌀< 0.002 mm); (2) Ds = Soil density: Test tube; (3) Dp = Particles density: Volumetric Flask Method; (4) P
T = Total Porosity: 1 - (Ds/Dp) (EMBRAPA, 1997).
Table 2. Chemical attributes of Oxisol and Ultisol (Alegre-ES, 2012).
Soil pH MO P K Ca Mg H + Al SB CTC V
(g kg-1) (mg dm-3) --- cmolc dm-3 --- (%)
Oxisol 5.03 19.4 13.77 96.00 1.29 0.80 1.65 2.33 3.98 58.54 Ultisol 4.78 16.3 4.86 41.00 0.75 0.59 2.23 1.45 3.67 39.51 Extration and determination: pH in water (1:2,5);MO: Potassium dichromate (1 mol L-1) and Titration by ferrous sulfate (0,5 mol L-1);P: Mehlich-1 and colorimetry; K: Mehlich-1 and flame spectrophotometry;Ca and Mg: KCl (1 mol L-1)and atomic absorption spectrometry; Al: KCl (1 mol L-1) and Titrimetry; H + Al: Calcium Acetate (0,5 mol L-1) (EMBRAPA, 1997).
After soils analysis, the same were separated in 7 dm³ samples and packaged in plastic sacks where they were incubated for 28 days with the application of 2 and 5 grams of dolomitic limestone
(PRNT = 96%) in the Oxisol and Ultisol, respectively, according to the methodology proposed by
Prezotti et al. (2007). During the incubation of the soil samples were maintained at 60% moisture of the total volume of pores (VTP), according to Freire et al. (1980). Daily weighings were performed to replacement soil water losses.
After the incubation period, the samples were dried in the shade and homogenized in a 2 mm mesh sieve, to perform the fertilization of planting and conduction (coverage) according to the methodology proposed by Novais et al. (1991).
Then, soil samples were placed in plastic pots with a capacity of 8 dm3 and fertilization was carried out one week before planting with the application of 4 g of ammonium sulphate (21%), 13 g of superphosphate (19%) and 2 g of potassium chloride (58%) in each pot.
97
Posteriorly, the seeds of common bean were cultivated, cultivar Ouro Negro, belonging to the commercial group of the black type, with habit of indeterminate growth III, prostrate size, cycle of 80 - 100 days, that excels in the irrigated crop of Autumn-Winter.
Afterwards, the treatments and the cultivated plants were defined for a period of 85 days (08/07/2012 to 09/30/2012), totaling 95 days. At 30 and 60 days after sowing, a cover fertilization with 4 g per pot of ammonium sulphate and 2 g per pot of potassium chloride was applied to each soil.
Initially, the soil, plant and soil matter standardization of all pots were performed after sowing the seeds. After the period to establish the plants, soil sample was removed from the pots to determine the moisture by the thermogravimetric method (EMBRAPA, 1997), and the same amount of soil was recovered from the pot. Posteriorly, the soil moisture content (UGA) was increased to the field capacity
determined at the tension of 0.010 MPa by the Richards extractor, with subsequent weighing of the pots.
Irrigation depth (LI) were multiplied by the mean area of the pot (Āv) determined by the following expression: Āv = h. (B + b) / 2, where h is height, B the largest base and b the lowest vessel base (Āv = 0.045 m²), to be expressed in volume (L pot-1). In addition, the establishment and control of
the moisture content of the plots were carried out daily in the interval from 7 to 8 h, by monitoring the matter of each experimental unit, including soil, plant and moisture.
After establishing the matter of each experimental unit and corresponding soil moisture in the field capacity determined by T1 (0.010 MPa), the pot matteres were determined in the field capacity determined by T2 (0.033 MPa), and the water deficits of 20, 40 and 60% of the water available for all stress levels used in determining the field capacity of the soils under study. In order to obtain the moisture content of each experimental unit, soil moisture monitoring and vessel weighing were carried out every 12 hours.
Soils water retention curves, obtained by drying, were determined from previously sieved samples, as recommended by Embrapa (1997). After the saturation period of 12 h, the samples were placed in the Richards extractor with porous plate for stabilization, adopting a time not less than three days and later determination of the gravimetric humidity (Ug), corresponding to the voltages of: 0.006, 0.010, 0.033, 0.08, 0.10, 0.30, 0.50, 1.0, and 1.5 MPa, with three replicates.
The soil volumetric moisture (θ) for each of the tensions was obtained by the product of gravimetric moisture by soil density (θ = Ug * Ds). The mean values of volumetric moisture of the
retention curve points of each soil were adjusted using the mathematical model proposed by Van Genuchten (1980).
The values of volumetric moisture observed in the water retention curve of each soil for the field capacity (Cc) determined at the tensions of 0.010 MPa (T1) and 0.033 MPa (T2), and at the
permanent wilting point (Pm) at the values of 1.5 MPa were used to determine the available water, according to the methodology recommended by Bernardo et al. (2009). Then, the water deficit levels of 20, 40 and 60% of the available water (WD = 20, 40 and 60%) were determined for the calculation of the ir rigation depths for the soils under study.
In the absence of water deficit (WD = 0%), soil moisture was maintained close to the field capacity and the irrigation depth (LI) was determined by the following expression: LI = AW * Vs, where AW is available water in the soil and Vs the soil volume of the pot (0.007 m³).
However, irrigation depths to be applied to raise the soil moisture content (Ua) to field capacity in the 20, 40 and 60% AW deficits were determined by the following equation: LI = [(Cc - Ua) / 10] x Ds x Z (MANTOVANI et al., 2009), where: LI - Irrigation depths, in mm; Cc -
moisture in the field capacity, % by weight; Ua - current soil moisture, % by weight; Ds - soil density, in g cm-3; and Z - effective depth of the crop root system, in cm.
Water replacements were performed manually by pot weighing difference, to maintain soil moisture in the Cc determined in the stress levels used in the determination of Cc and water deficits under study. The adjustment of the matteres of the pots to the gravimetric humidity estimated for the tension levels to determine the field capacity and water deficits was performed every 20 days, due to the increase caused by the growth of the plants.
Growth analyzes were carried out in the phenological phases of culture V4 and R5, which corresponds to approximately 25 and 45 days after emergence (DAE). Preliminary leaf water potential (ψam), leaf area (LA) and total dry matter (DMT) were evaluated.
Preliminary leaf water potential measurements (ψam) were carried out in two phenological
phases of the crop: 1st stage - third expanded trifoliolate leaf - V4; and phase 2 - pre-flowering - R5 at 4 h and 30 min, using a pressure pump constructed according to Scholander et al. (1965), for the study of sap tension in the xylem.
The choice of timetable is due to the fact that the plants present greater efficiency in the carbon fixation in the morning, accentuating their responses according to the availability of water in the soil and to the fact that the leaf water potential measured in the morning is an indicative of the water status
99
of the plants (LARCHER, 2006). For the accomplishment of the measurements of the water potential beforehand, the central leaflet of the fourth trifoliolate leaf was completely expanded of the main stem, of three plants per treatment.
The leaf of the common bean, after being detached from the branch, was inserted into the pump chamber leaving the base of the apparent petiole and a pressure was applied increasing and gradual until the xylem sap began to appear on the surface of the petiole, whose observation was made with the aid of artificial light and magnifying glass (magnifying glass). At that moment, the manometer was read and the observed pressure corresponded to the water potential of the xylem sap.
For each evaluation, 24 readings (3 leaves plant-1) were performed on the same day for each experiment, using an average per treatment, totaling two days for this evaluation. The leaf area was determined from a leaf area meter (model LI-3100, LI-COR), and to obtain the total dry matter the plants were dried in an oven at 70 ºC until reaching a constant matter.
The data were submitted to the preliminary tests to verify the normality and homogeneity of variance of the same, to the tests of Lilliefors and test of Bartlett, respectively. Subsequently, the data were submitted to analysis of variance (p ≤ 0.05). When significant, the F test (p ≤ 0.05) was used for the tension factor, which although it is a quantitative factor, does not have enough degree of freedom to perform the regression analysis, because it presents only two levels and the analysis regression for the water deficit factor. The models were chosen based on the significance of the regression coefficients, using Student's t-test, at a 5% probability level and by the coefficient of determination.
RESULTS AND DISCUSSION
It is verified that the moisture content of the field capacity varies with the tension adopted in its determination with the aid of the Richards extractor (Table 3).
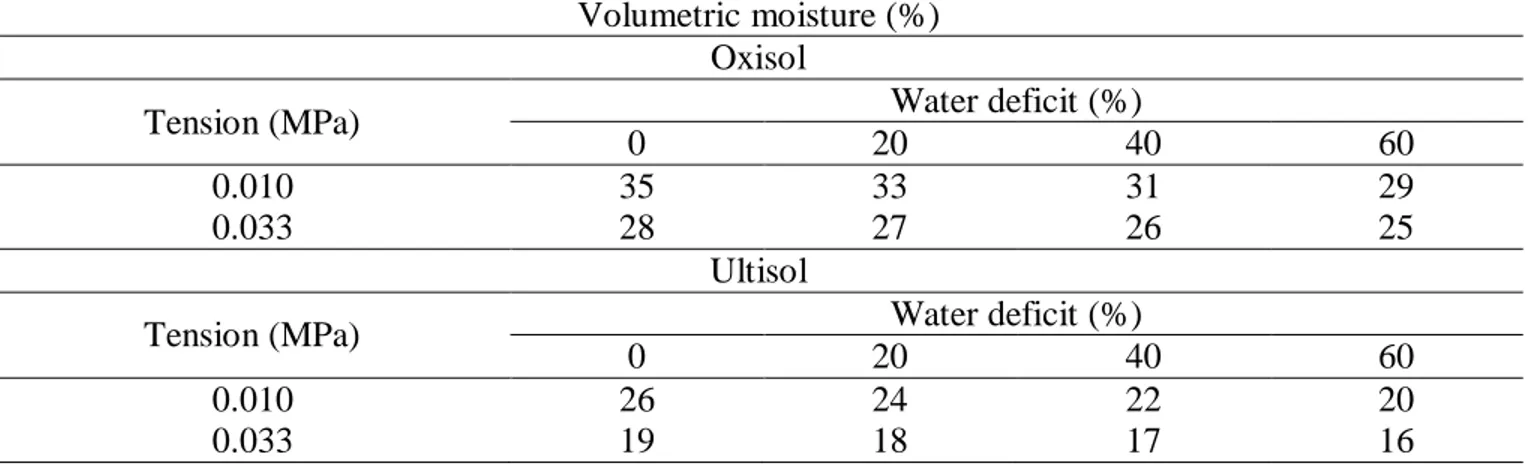
In addition, the volumetric moisture obtained at 1.5 MPa tension was 19% for Oxisol and 11% for Ultisol, respectively. With these results, different values of available water were established in the soil, and, from this, different levels of water deficit, translated into different irrigation slides for the soils under study (Table 4).
It is observed that the volume of water applied (L pot-1) to maintain soil water contents in the
soil (WD = 0, 20, 40 and 60% of AW), during the development of the crop, varied from one soil to the other on the basis of their physical attributes, such as: texture, soil density and the tension used to
determine the field capacity for Oxisol and Ultisol, for authors of various authors such as common bean cultivation.
Table 3. Volumetric moisture values in the tension levels (T1 = 0.010 MPa and T2 = 0.033 MPa) and water deficits (WD1 = 0%, WD2 = 20%, WD3 = 40%, and WD4 = 60%) in Oxisol and Ultisol (Alegre-ES, 2012).
Volumetric moisture (%) Oxisol
Tension (MPa) Water deficit (%)
0 20 40 60
0.010 35 33 31 29
0.033 28 27 26 25
Ultisol
Tension (MPa) Water deficit (%)
0 20 40 60
0.010 26 24 22 20
0.033 19 18 17 16
Table 4. Water deficit values in the tension levels (T1 = 0.010 MPa and T2 = 0.033 MPa) and available
water (AW = 100%, AW = 80%, AW = 60% and AW = 40%) in Oxisol and Ultisol (Alegre-ES, 2012).
Water Deficit (L pot-1) Oxisol
Tension (MPa) Available water - AW (%)
100 80 60 40
0.010 0 0.22 0.44 0.66
0.033 0 0.13 0.26 0.38
Ultisol
Tension (MPa) Available water - AW (%)
100 80 60 40
0.010 0 0,21 0,42 0,64
0.033 0 0,13 0,24 0,35
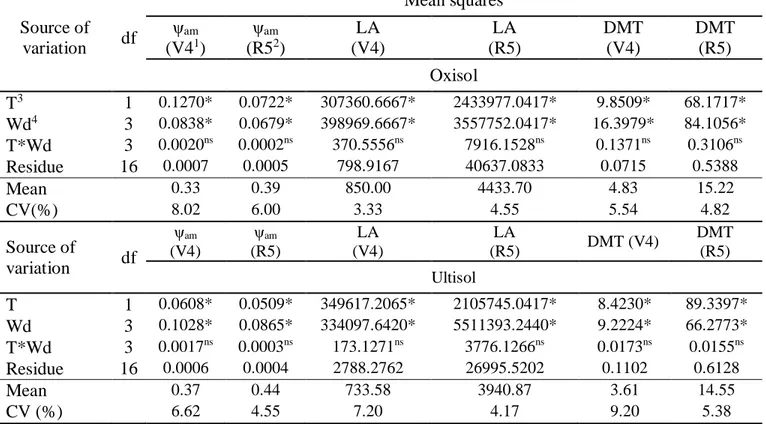
The analysis of variances (Table 5) shows that there was no interaction between stress and water deficit levels for all the variables evaluated (p > 0.05) in the phenological phases V4 and R5 of the common bean cultivated in Oxisol and Ultisol. Thus, the effect of the factors under study (water stress and water deficit) on predawn leaf water potential (ψam), leaf area (LA) and total dry matter
(DMT) was evaluated separately.
There was a significant effect of the tension used to define the field capacity on the ψam, LA and
101
In relation to the effect of soil water deficit, a significant response was observed for all the growth variables evaluated (p < 0.05) in each phenological stage of the crop and soils under study.
Significant differences were observed for predawn leaf water potential(ψam), leaf area (LA) and
total dry matter (DMT), at the 5% probability level, in the phenological phases V4 and R5 of the common bean cultivated in an Oxisol and Ultisol (Table 6) and subjected to tension levels under study.
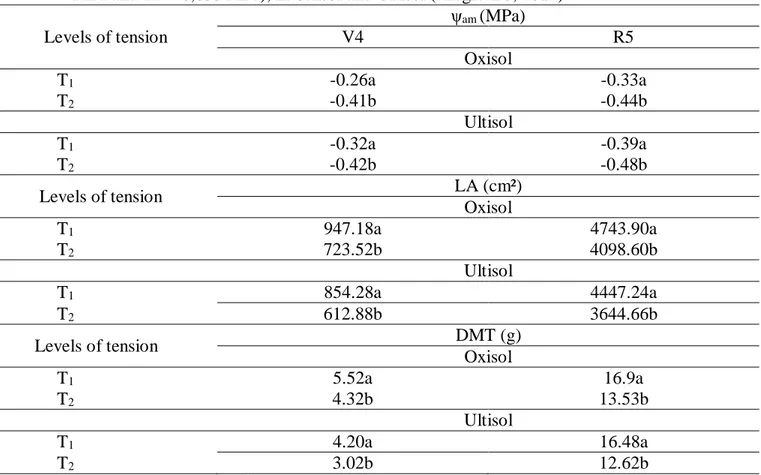
In the phenological phase V4, that is, when the plants presented the third expanded trifoliolate leaf, the water tension equal to 0.010 MPa (T1) adopted to determine the field capacity (Cc) gave a higher value of ψam (35.5%), LA (30.7%) and DMT (28%) of the plants cultivated in the Oxisol (Table 6), in relation to plants submitted to field capacity (Cc) determined by T2 (0.033 MPa). This is
due to the fact that the higher water contents in the soil are related to the lower values of tensions, that is, higher values of soil matrix potential.
Table 5. Analysis of variance summary of predawn leaf water potential (ψam), leaf area (LA), total dry
matter (DMT) of the common bean, in the phenological phases V41 and R52, cultivated in Oxisol and Ultisol (Alegre-ES, 2012).
Source of variation df Mean squares ψam (V41) ψam (R52) LA (V4) LA (R5) DMT (V4) DMT (R5) Oxisol T3 1 0.1270* 0.0722* 307360.6667* 2433977.0417* 9.8509* 68.1717* Wd4 3 0.0838* 0.0679* 398969.6667* 3557752.0417* 16.3979* 84.1056* T*Wd 3 0.0020ns 0.0002ns 370.5556ns 7916.1528ns 0.1371ns 0.3106ns Residue 16 0.0007 0.0005 798.9167 40637.0833 0.0715 0.5388 Mean 0.33 0.39 850.00 4433.70 4.83 15.22 CV(%) 8.02 6.00 3.33 4.55 5.54 4.82 Source of variation df ψam (V4) ψam (R5) LA (V4) LA (R5) DMT (V4) DMT (R5) Ultisol T 1 0.0608* 0.0509* 349617.2065* 2105745.0417* 8.4230* 89.3397* Wd 3 0.1028* 0.0865* 334097.6420* 5511393.2440* 9.2224* 66.2773* T*Wd 3 0.0017ns 0.0003ns 173.1271ns 3776.1266ns 0.0173ns 0.0155ns Residue 16 0.0006 0.0004 2788.2762 26995.5202 0.1102 0.6128 Mean 0.37 0.44 733.58 3940.87 3.61 14.55 CV (%) 6.62 4.55 7.20 4.17 9.20 5.38
1V4 – Third trifoliolate sheet expanded; 2R5 – Pre-flowering; 3T – Tension; 4Wd – Water déficit. *Significant at 5% probability; e nsnot significant by the F test.
The water deficit reduces the multiplication and the cellular expansion, which results in a lower growth of the aerial part of the plants, as a defense mechanism of the plants to the beginning of the
water restriction, due to the decrease of the leaf expansion and the photosynthetic efficiency. In general, plant growth is affected by soil water content due to the reduction of photosynthetically active leaf area when exposed to water deficit (TAIZ & ZEIGER, 2004).
Table 6. Mean values obtained for predawn leaf water potential (ψam), in MPa, leaf area (LA), in cm², dry matter (DM), in g, in the phenological phases V41 and R52 of the common bean in function to the tension levels considered for soil humidity in the field capacity (T1 = 0,010 MPa and T2 = 0,033 MPa), in Oxisol and Ultisol (Alegre-ES, 2012).
Levels of tension ψam (MPa) V4 R5 Oxisol T1 -0.26a -0.33a T2 -0.41b -0.44b Ultisol T1 -0.32a -0.39a T2 -0.42b -0.48b Levels of tension LA (cm²) Oxisol T1 947.18a 4743.90a T2 723.52b 4098.60b Ultisol T1 854.28a 4447.24a T2 612.88b 3644.66b Levels of tension DMT (g) Oxisol T1 5.52a 16.9a T2 4.32b 13.53b Ultisol T1 4.20a 16.48a T2 3.02b 12.62b
1V4 – Third trifoliolate sheet expanded; 2R5 – Pre-flowering;
*Means followed by the same letter, lowercase in columns, do not differ by the F test (p<0.05).
In the expanded third trifoliolate leaf stage, total dry matter accumulation was small, since this phase comprises the period when the rate of absorption of water and nutrients is insufficient to activate the physiological processes of growth, which require accelerated metabolic activities.
For plants cultivated in Ultisol (Table 6), T1 used to determine Cc also provided higher values
of ψam (23.8%), LA (39.4%) and DMT (39.3%) compared to plants submitted to Cc defined by T2, due
to the soil moisture content in the Cc, which varies according to the physical attributes of the soil, soil cultivation system and the tension adopted in its determination, which results in different levels of available in the soil that influence the degree of hydration of the plants.
103
The values of ψam, LA and DMT found in the third expanded leaf trifoliolate (V4) phase of
common bean cultivated in clayey texture soil (Oxisol) and medium texture (Ultisol) soil decreased with the reduction of available water level in the soil. Similar results were obtained by Mendes et al. (2007) when analyzing the leaf water potential in string bean plants submitted to water stress in the vegetative phase.
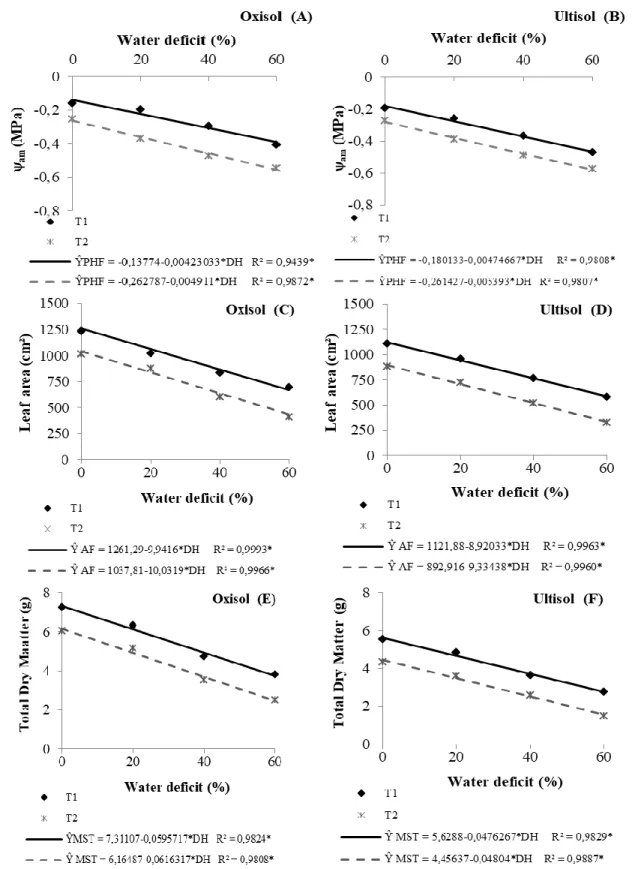
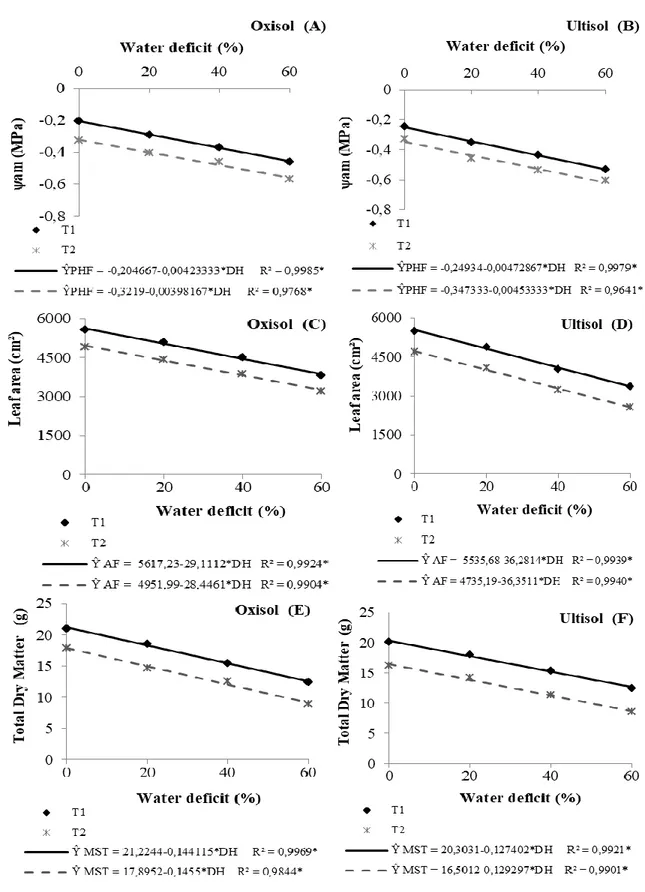
It is observed that the water deficit levels applied in the soil significantly influence the ψam, the
LA and the DMT in the phenological phase V4 of the common bean cultivated in Oxisol and Ultisol (Figure 1). All variables analyzed in the V4 phase of the common bean cultivated in the Oxisol (Figures 1A, 1C and 1E) were linearly reduced in response to the increase in soil water deficit level (p < 0.05). From the results estimated by the equations, reductions of approximately 8, 17 and 25% in T1
and 10, 20 and 29% in T2 were observed for the ψam of the plants submitted to levels of 20, 40 and 60%
of water deficit in the soil, respectively, in relation to plants not submitted to water deficit (WD = 0%). There were decreases in the order of 15, 31 and 47% in T1 and 19, 39 and 58% in T2, for the LA
of the plants cultivated in Oxisol and submitted to levels of 20, 40 and 60% of soil water deficit, respectively, compared to plants not submitted to water deficit. For the DMT, the reduction was approximately 16, 33 and 49% in T1 and 20, 40 and 60% in T2 for plants submitted to levels of 20, 40
and 60% of soil water deficit, respectively, in relation to plants not submitted to water deficit in Oxisol. In the plants grown in Ultisol, linear behavior of ψam, LA and DMT (Figures 1B, 1D and 1F)
was verified, in the results obtained, there were decreases of approximately 9, 19 and 28% in T1 and 11,
22 and 32% in T2 for ψam of the plants submitted to levels of 20, 40 and 60% of soil water deficit,
respectively, in relation to plants not submitted to water deficit.
There were reductions of 16, 32 and 48% in T1 and 21, 42 and 63% in T2 for the LA of the
plants cultivated in Ultisol and submitted to levels of 20, 40 and 60% of soil water deficit, respectively, in relation to the control. For DMT, decreases of approximately 17, 34 and 51% in T1 and 22, 43 and
65% in T2 of plants submitted to levels of 20, 40 and 60% of soil water deficit, respectively, compared
Figure 1. Predawn leaf water potential – ψam (A and B), leaf area (C and D), total dry matter (E and F)
of the common bean, in the phenological phase V4, in function to diferente levels of water déficit in Oxisol and Ultisol (Alegre-ES, 2012).
105
In the Oxisol plants, the difference between the ψam of the common bean in the absence of water
deficit (WD = 0%) and in the water deficit levels of 20, 40 and 60% reflects the soil water status, since the water was retained at an average matrix potential of -0.010 MPa, -0.015 MPa, -0.020 MPa and -0.033 MPa in the T1 used to define the Cc of the Oxisol and -0.033 MPa,
-0.044 MPa, -0.055 MPa and -0.080 MPa in the T2, for the water deficit levels under study.
In this context, the best water status of the plants in the expanded third trifoliolate leaf phase (V4) was observed in the absence of soil water deficit at T1 (ψam = -0.16 MPa) at a mean matrix
potential of -0.010 MPa at Oxisol and the lowest degree of hydration occurred in the plants submitted to the water deficit of 60% of AW at T2 (ψam = 0.55 MPa), whose average soil matrix potential is
-0.080 MPa.
In the same way as observed in the Oxisol in the Ultisol plants, the difference between the ψam
of the common bean in the absence of water deficit and in the water deficit levels of 20, 40 and 60% of the available water in the Ultisol reflected the water status The water retained at a mean matrix potential of -0.010 MPa, -0.013 MPa, -0.020 MPa, and -0.036 MPa at the T1 used to define the Cc of
the Ultisol and 0.033 MPa, -0.046 MPa, -0.056 MPa and -0.066 MPa in T2, for the water deficit levels
under study.
Thus, the best water status was observed in the absence of soil water deficit in T1 (ψam = -0.19
MPa) at a matrix potential of -0.010 MPa in the Oxisol and the lowest hydration occurred in the plants submitted to the 60% water deficit at T2 (ψam = -0.57 MPa), whose mean matrix potential soil is -0.066
MPa. This indicates that the variation of ψam is associated with soil matrix potential (ψm) and soil
moisture.
In the plants grown in the Ultisol, linear behavior for ψam, LA and DMT (Figures 1B, 1D and
1F) is verified, in the results obtained, there were decreases of approximately 9, 19 and 28% in T1 and
11, 22 and 32% in T2 for the ψam of the plants submitted to levels of 20, 40 and 60% of soil water
deficit, respectively, in relation to plants not submitted to water deficit.
There were reductions of 16, 32 and 48% in T1 and 21, 42 and 63% in T2 for the LA of the
plants cultivated in Ultisol and submitted to levels of 20, 40 and 60% of soil water deficit, respectively, in relation to the control. For the DMT variable, there was a decrease in the order of 17, 34 and 51% in T1 and 22, 43 and 65% in T2 for plants submitted to levels of 20, 40 and 60% of soil water deficit,
In this context, it is noticed that the higher water availability of the Oxisol provided to the common bean the highest values of ψam and of LA and DMT, being superior to the results obtained in
the plants cultivated in the Ultisol, in all levels of tension and of water deficit. According to Mendes et al. (2007) the values of these physiological and morphological parameters can vary according to the phenological phase of the crop, the variety, the water availability of the soil, the air pressure deficit and the time at which they are evaluated.
In the phenological phase of prefloration (R5) of the common bean cultivated in the Oxisol and Ultisol (Table 6) under the stress levels under study, significant differences were also observed for the variables ψam, LA and DMT (Figure 2), at the 5% probability level.
In this phase T1 used to determine Cc provided higher values of ψam (24.8%), LA (15.7%) and
DMT (24.9%) of the plants grown in the Oxisol (Table 6), compared to plants submitted to Cc determined by T2. In this context, it is verified that the ψam is smaller and that the accumulation of
DMT is greater, because in this phase (pre-flowering), transpiration of photoassimilates occurs, since the main stem, lateral branches and The trifoliolate leaves, as well as the triads of buds in the armpit of the leaves.
For the plants cultivated in the Ultisol (Table 6), the T1 used to define the Cc also provided
higher values of ψam (19.1%), LA (22%) and DMT (30.6%), when compared to plants submitted to Cc
defined by T2. In this context, it is verified that the values of ψam, LA and DMT found in the
phenological phase R5 of the common bean cultivated in an Oxisol and Ultisol decrease with the reduction of water availability in the soil. Similar results were obtained by Endres et al. (2010) when analyzing the gaseous changes in the reproductive phase of the bean. For Larcher (2006), ψam is
indicative of soil water storage. Thus, the measurement of this variable is the effective way of evaluating the water status of the plants, because in the morning there is a tendency of balance between the water potential in the leaf and in the soil.
It is observed that the soil water deficit levels significantly influenced the variables evaluated (ψam, LA and DMT) in the R5 phenological phase of the common bean, cultivated in an Oxisol and
Ultisol (Figure 2). The variables ψam (Figures 2A and 2B), LA (Figure 2C and 2D) and DMT (Figure
2E and 2F) of the plants grown in the Oxisol were linearly reduced in response to an increase in the level of soil water deficit (p < 0.05). In the results obtained, there were decreases of approximately 9, 16 and 25% in T1 and of 8, 16 and 24% in T2, for the ψam of the plants submitted to levels of 20, 40 and
107
There were reductions in the order of 10, 21 and 31% in T1 and 11, 23 and 34% in T2, for the
LA of the plants cultivated in the Oxisol and submitted to levels of 20, 40 and 60% of soil water deficit, respectively, when compared to the control (WD = 0%). For DMT (Figure 2), the decrease is approximately 14, 27 and 41% in T1 and 16, 33 and 49% in T2 for DMT of the plants submitted to
levels of 20, 40 and 60% of water deficit in the soil, respectively, in relation to plants not submitted to water deficit.
The main effects of soil water deficit on plant growth are related to the reduction of leaf expansion, which is found for other species of agricultural importance, such as corn (COSTA et al., 2008), conilon coffee (DARDENGO et al., 2009), among others.
In pre-flowering (R5), the difference between ψam of the common bean in the absence of water
deficit (WD = 0%) and in the water deficit levels of 20, 40 and 60% the water state was retained at a mean matrix potential of -0.010 MPa, -0.018 MPa, -0.021 MPa and -0.034 MPa at the T1 used to define
the Cc of the Oxisol and -0.033 MPa, -0.047 MPa, -0.058 MPa and -0.083 MPa at T2, for the water
deficit levels under study.
The best water status of the plants in the phase of prefloration (R5) can be observed in the absence of soil water deficit at T1 (ψam = -0.20 MPa) at a mean matrix potential of -0,010 MPa in the
Oxisol and the lowest degree of hydration occurred in the plants submitted to the 60% water deficit of the AW in T2 (ψam = -0.57 MPa), whose average soil matrix potential is -0.083 MPa.
As observed in the Oxisol, for plants cultivated in Ultisol, the difference between the ψam of the
common bean in the absence of water deficit and in the water deficit levels of 20, 40 and 60% of the available water in the Ultisol reflected the state and the water retained at an average matrix potential of -0.010 MPa, -0.016 MPa, -0.023 MPa and -0.040 MPa at the T1 used to define the Cc of the Ultisol and
-0.033 MPa, -0.048 MPa, -0.058 MPa and -0.069 MPa at T2, for the water deficit levels under study.
Therefore, the highest degree of hydration can be observed in the absence of water deficit in the soil at T1 (ψam = -0.25 MPa) at a potential matrix of -0,010 MPa in the Oxisol and the lower hydration
occurred in the plants submitted to the water deficit of 60% at T2 (ψam = -0.61 MPa), whose mean soil
matrix potential is -0.069 MPa. It is verified that the variation of the ψam is associated to the matricial
Figure 2. Predawn leaf water potential – ψam (A and B), leaf area (C and D), total dry matter (E and F)
of the common bean, in the phenological phase R5 (Pre-flowering), in function to diferente levels of water déficit in Oxisol and Ultisol (Alegre-ES, 2012).
109
In this context, it is observed that the higher water availability of Oxisol gave the common bean in the prefloration phase (R5) the highest values of ψam, being higher than the results obtained in the
Ultisol, in all levels of tension and water deficit. Moreover, the decreases of ψam, LA and DMT were
greater in magnitude in the level of water deficit in the soil equal to 60%, that is, with 40% of the available water in the Oxisol (Figure 2A, 2C and 2E) and Ultisol (Figure 2B, 2D and 2F). Similar results were obtained by Oliveira et al. (2009) when evaluating the effect of different soil water levels on the physiological behavior of the coffee tree.
According to Castro et al. (2009) in environments with lower water availability, there is a reduction in the size of the stomata in order to reduce the loss of water from the plant to the atmosphere and increase its density to contribute to the balance of gas exchange. For Mendes et al. (2007), these alterations can compensate for the reduction of leaf area and leaf water potential that occurs in plants submitted to water deficit.
It is verified by means of the regression equations analyzed for predawn leaf water potential, leaf area and total dry matter of the bean in each phenological phase evaluated, a wide difference in the physiological and morphological behavior of the cultivar Ouro Negro, in front of the attributed water restrictions by treatments, with significant reductions as soil water availability was reduced. Moreover, these results allow to affirm that the levels of 40 and 60% of the available water in the soil are critical for this cultivar.
For the common bean, the water deficit levels in the soil of 40 and 60% of the available water had negative effects on the predawn leaf water potential, which reduces the gas exchange and consequently the growth of the crop. In turn, Mendes et al. (2007) evaluated leaf water potential in leaf bean plants submitted to water deficit in the vegetative and reproductive phases, and found significant reductions in leaf water potential, stomatal conductance and leaf transpiration, with a consequent increase in leaf temperature.
The results obtained in the phenological phases V4 - third expanded trifoliolate leaf and R5 – pre-flowering (Figures 1 and 2) show that the effect of soil water deficit level on bean growth is related to the reduction of leaf water potential and area thus demonstrating that the growth analysis is important in the evaluation of the vegetative development of the crop submitted to the water deficit.
CONCLUSIONS
The plants submitted to the field capacity determined by the 0.010 MPa present higher turgescence and growth in both soils.
The soil water content of 40 and 60% of the available water exert negative effects on leaf water potential, leaf area and total dry matter accumulation in the third phase of the expanded trifoliolate leaf (V4) and in the pre-flowering (R5) of the common bean, independent of the voltage adopted in the field capacity determination.
The growth of common bean grown on Oxisol and Ultisol decreases linearly as the level of water deficit in the soil increases.
ACKNOWLEDGEMENTS
To the Coordination for the Improvement of Higher Education Personnel (CAPES) for granting a doctoral scholarship to the first author.
REFERENCES
BERNARDO, S.; SOARES, A. A.; MANTOVANI, E. C. 2009. Manual de irrigação. 8. ed. atual. e ampl. Viçosa, MG: UFV. 625p.
CASTRO, E. M.; PEREIRA, F. J.; PAIVA, R. 2009. Histologia Vegetal: estrutura e função de órgãos vegetativos. Lavras, MG: UFLA. 234p.
CATUCHI, T. A.; GUIDORIZZI, F. V. C.; GUIDORIZZI, K. A.; BARBOSA, A. de M.; SOUZA, G. M. 2012. Respostas fisiológicas de cultivares de soja à adubação potássica sob diferentes regimes hídricos. Pesquisa Agropecuária Brasileira, Brasília, DF, v. 47, n. 4, p. 519-527.
CONAB - Companhia Nacionalde Abastecimento. 2016. Acompanhamento da safra brasileira de grãos: Safra 2015/2016 décimo primeiro levantamento, agosto/2016/Companhia Nacional de Abastecimento. Brasília, DF: Conab. 176p.COSTA, J. R. da.; PINHO, J. L. N. de.; PARRY, M. M. 2008. Produção de matéria seca de cultivares de milho sob diferentes níveis de estresse hídrico. Revista Brasileira de Engenharia Agrícola e Ambiental, Campina Grande, PB, v. 12, n. 5, p. 443-450.
DARDENGO, M. C. J. D.; REIS, E. F.; PASSOS, R. R. 2009. Influência da disponibilidade hídrica no crescimento inicial do cafeeiro Conilon. Bioscience Journal, Uberlândia, MG, v. 25, n. 6, p. 1-14. EMBRAPA - Empresa Brasileira de Pesquisa Agropecuária. 1997. Manual de métodos de análises de
solo. 2. ed. Rio de Janeiro, RJ: Ministério da Agricultura e do Abastecimento. 212p.
ENDRES, L.; SOUZA, J. L.; TEODORO, L.; MARROQUIM, P. M. G.; SANTOS, C. M.; BRITO, J. E. D. 2010. Gas exchange alteration caused by water deficit during the bean reproductive stage. Revista Brasileira de Engenharia Agrícola e Ambiental, Campina Grande, PB, v.14, n. 1, p. 11-16.
FREIRE, J. C.; RIBEIRO, M. A. V.; BAHIA, V. G.; LOPES, A. S.; AQUINO, L. H. de. 1980. Resposta do milho cultivado em casa de vegetação a níveis de água em solos da região de Lavras-MG. Revista Brasileira de Ciência do Solo, Campinas, SP, v. 4, n. 1, p. 5-8.
111
GUIMARÃES, C. M.; STONE, L. F.; DEL PELOSO, M. J.; OLIVEIRA, J. P. de. 2011. Genótipos de feijoeiro comum sob deficiência hídrica. Revista Brasileira de Engenharia Agrícola e
Ambiental, Campina Grande, PB, v.15, n.7, p. 649-656.
LARCHER, W. 2006. Ecofisiologia Vegetal. São Carlos, SP: Rima, 550p.
LOPES, A. DA S.; OLIVEIRA, G. Q. de.; SOUTO FILHO, S. N.; GOES, R. J.; CAMACHO, M. A. 2011. Manejo de irrigação e nitrogênio no feijoeiro comum cultivado em sistema plantio direto. Revista Ciência Agronômica, Fortaleza, CE, v. 42, n. 1, p. 51-56.
MANTOVANI, E. C.; BERNARDO, S.; PALARETTI, L. F. 2009. Irrigação: princípios e métodos. 3. ed., atual. e ampl. Viçosa, MG: UFV. 355p.
MENDES, R. M. S.; TÁVORA, F. J. A. F.; PINHO, J. L. N.; PITOMBEIRA, J. B. 2007. Relações fonte-dreno em feijão-de-corda submetido à deficiência hídrica. Revista Ciência Agronômica, Fortaleza, CE, v. 38, n. 1, p. 95-103.
MIORINI, T. J. J.; SAAD, J. C.; MENEGALE, M. L. 2011. Supressão de água em diferentes fases fenológicas do feijoeiro comum (Phaseolus vulgaris L.). Irriga, Botucatu, SP, v. 16, n. 4, p. 360-368.
NASCIMENTO, S. P. do.; BASTOS, E. A.; ARAÚJO, E. C. E.; FREIRE FILHO, F. R.; SILVA, E. M. da. 2011. Tolerância ao déficit hídrico em genótipos de feijão-caupi. Revista Brasileira de
Engenharia Agrícola e Ambiental, Campina Grande, PB, v. 15, n. 8, p. 853–860. NOVAIS, R.F.; NEVES, J.C.L.; BARROS, N.F. 1991. Ensaio em ambiente controlado. In:
OLIVEIRA, A.J.; GARRIDO, W.E.; ARAÚJO, J.D.; LOURENÇO, S. (Coord.). Métodos de pesquisa em fertilidade do solo. Brasília, DF: Embrapa-SEA. p. 189-253.
OLIVEIRA, L. F. C. de.; OLIVEIRA, R. Z.; PORTES, E.; CASTRO, T. DE A. 2009. Comportamento fisiológico de cafeeiros submetidos a diferentes disponibilidades de água no solo. Bioscience Journal, Uberlândia, MG, v. 25, n. 3, p. 83-91.
PINHEIRO, C.; CHAVES, M. 2011. Photosynthesis and drought: can we make metabolic connections from available data? Journal of Experimental Botany, Lancaster, PA, v. 62, n. 3, p. 869‑882. PREZOTTI, L. C.; GOMES, J. A.; DADALTO, G. G.; OLIVEIRA, J. A. 2007. Manual de
recomendação de calagem e adubação para o Estado do Espírito Santo: 5ª aproximação. Vitória, ES: SEEA/INCAPER/CEDAGRO. 305p.
SAEG. 2007. Sistema para Análises Estatísticas, versão 9.1. Viçosa, MG: Fundação Arthur Bernardes. CD-ROM.
SCHOLANDER, P. F.; HAMMEL, H. T.; HEMMINGSEN, E. A.; BRADSTREET, E. D. 1965. Sap pressure in vascular plants. Science, Washington, DC, v. 148, n. 3668, p. 339-346.
TAIZ, L.; ZEIGER, E. 2004. Fisiologia Vegetal. 3. ed. Porto Alegre, RS: Artmed, 719p.
VAN GENUCHTEN, M. T. 1980. A closed-form equation for predicting the hidraulic conductivity of unsaturated soils. Soil Science Society of America Journal, Washington, WA, v. 44, n. 1, p. 892-898.
Received in: November 28, 2016 Accepted in: March 23, 2018