METODOLOGY FOR LATERÍTICS CU-‐BEARING CLAY MINERALS CHARACTERIZATION
E. S. MANO1*, L. CANER2 and A. P. CHAVES 31*Universidade de São Paulo (USP), Escola Politécnica – Dep. de Engenharia de Minas e de Petróleo. 2Université de Poitiers (França), CNRS IC2MP-‐HydrASA UMR 7285.
3Instituto Tecnológico Vale – ITV-‐ Mineração.
eliana.mano2014@gmail.com*
Article received in October/2015 and accepted in November/2015 DOI: 10.15628/holos.2015.3531
ABSTRACT
Lateritic material lies over nearly 75% of the Brazilian surface area; but not more than 30% of this material is exploited. The expressive volume of clay minerals associated to the ores is the main reason of this low figure, especially because clay minerals are very complex, most of the time, impossible to concentrate. Under this circumstance, a proper mineral identification and the knowledge of the clay mineral structure are essential for the best mineral processing route choice.
This study describes an optimized methodology to characterize a Cu-‐lateritic ore, mainly composed of Cu-‐ bearing clay minerals. Cations saturations and particle sizes separation, combined with X-‐ray diffraction, mid infrared spectroscopy and scanning electron microscopy allow concluding that this Cu-‐lateritic ore is mainly composed of smectites, micas and kaolinite; furthermore, the copper is especially associated to mica and secondarily to smectite.
KEYWORDS: Use até 05 (cinco) palavras chave, separando-‐as por vírgula.
1 INTRODUCTION
Properly identifying minerals is fundamental for the mining processing route choice, especially for lateritic ores. Langer (1979) determined that the SiO2/MgO ratio is essential for the
metallurgical process. Low Si contents should be processed by hydrometallurgical routes; on the other hand high Si and Mg amounts (>12% of Mg) require pyrometallurgical routes. For Ni-‐ lateritic ores, Richter (2009) explains that high Si contents also require high amounts of lime or dolomite to slag it, resulting in a high volume of slag, a high-‐energy consumption and an especially significant volume of material into the oven, therefore affecting the capacity of the furnace. For the Caron process, this sort of ore is also unsuitable, since its acid character requires large amounts of ammonia. Due to all these characteristics, the acid leaching is more adequate to process this sort of ore. Nevertheless, high Mg contents exhibit high consumption of acid; in this case, Richter (2009) recommends the Caron process.
For this reason, the proper mineralogical characterization is essential for the metallurgical route choice. The chemical analysis is not enough to control the metallurgical process, especially if the ore is composed of clay minerals that can exhibit similar chemical composition but different crystal structure. Different structures can show different behaviors during the metallurgical process. Mano (2013) shows these differences for Ni-‐bearing smectites from Niquelândia.
Proper clay minerals identification can be considered a complex task that involves many specific procedures, such as cations saturations (Moore and Reynolds, 1989) and particle size separation. A conventional methodology for identifying clay mineral is described in detail in this study in order to characterize a Cu-‐lateritic ore. The X-‐ray diffraction (XRD), scanning electron microscopy (SEM), coupled to a dispersion energy spectroscopy (EDS) and finally, mid infrared spectroscopy (MIR) were used to characterize the clay minerals present.
2 MATERIAL AND METHODS
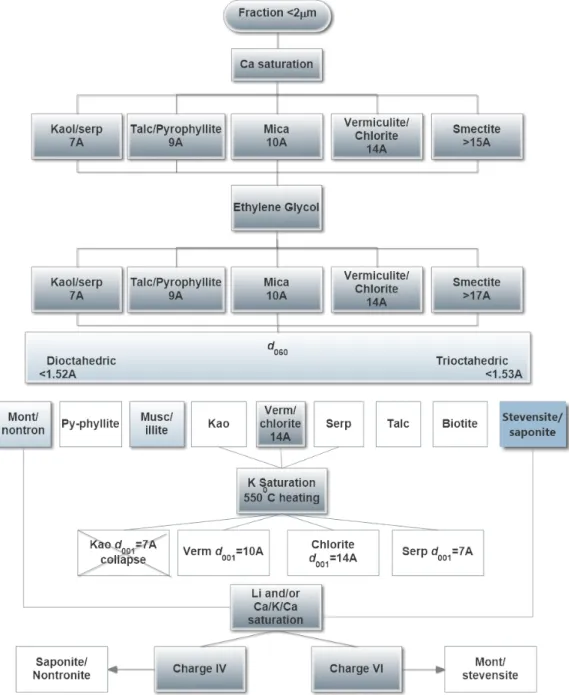
The clay mineral identification methodology is based on cation saturations, such as calcium, potassium, lithium and others, which can change clay mineral structures and behavior in the XRD analysis (Moore and Reynolds, 1989). Figure 1 shows a schematic flux based on studies performed by Moore and Reynolds (1898), Grauby et al. (1994), Petit et al. (2002) and Mano et
al. (2014) created to assist clay minerals identification.
The sample studied is a Cu-‐bearing lateritic ore from the P118 deposit – Carajás, Brazil. It is composed essentially of quartz and clay minerals, secondarily by goethite. Clay minerals content represents at least 40% of the sample.
The clay mineral fraction was separated from the bulk sample by wet sieving (<50 µm). The fine fraction (< 50µm) was saturated with NaCl 1 mol. L-‐1, in order to deflocculate the
particles. Finally, successive centrifugation steps were performed to concentrate particles smaller lower than 2 µm (Moore and Reynolds, 1989; Mano et al., 2014).
The fraction smaller than 2 µm was saturated with CaCl2 0.5 mol. L-‐1; this cation allows to observe d001 = 14 to 15 Å for smectites which displaces to d001 = 16 to 17 Å after ethylene glycol
treatment (Decarreau et al., 1987).
Figure 1 . Clay minerals identification scheme based on Moore and Reynolds (1989); Grauby et.al. (1994); Petit et al. (2002); Mano et. al. (2014). The white squares represent the minerals already identified.
Kaolinite (d001 of 7.2 Å) disappears after thermal treatment at 550 °C, while serpentine
remains at d001 = 7.3 Å. Furthermore, the thermal treatment also displaces d001 of smectites and
vermiculite from 15 and 14 Å (respectively) to 10 Å. However, chlorites and micas remains their
d001 at 14 and 10 Å, respectively (Brindley and Brown, 1980; Christidis and Eberl, 2003).
The 060 reflection (Figure 1) allows distinguishing between di and trioctahedral types, since the b cell dimension is very sensitive to the size of the cation which occupies the octahedral sheets. Thereby, kaolinite, a dioctahedral clay mineral can be distinguished from serpentine, a trioctahedral one, by the 060 reflection. Furthermore, talc (tri) and pyrophillite (di), biotite (tri) and muscovite (di) and finally, smectites can be distinguished.
Different sorts of smectites can be distinguished by lithium or Ca/K/Ca saturations which determine the layer charge distribution (Petit et al., 1998). Montmorillonite and stevensite exhibit an octahedral charge, whereas beidellite, saponite and nontronite exhibit a tetrahedral charge.
The sample selected for this study represents a clay mineral mixture. In order to study these sorts of clay minerals in detail, particle size separations were performed, since smectites usually remain into the finest fractions, whereas micas and vermiculite, are into the coarser fractions.
Centrifugation steps with various time and acceleration (RCF or g) allow to concentrate the clay minerals <0.05 µm, between 0.05 to 0.1 µm, 0.1 to 0.2 µm, 0.2 to 1 µm and finally, between 1 to 2 µm (Figure 2).
3 RESULTS AND DISCUSSIONS
Figure 2. Schematic flux for detailed clay minerals study.
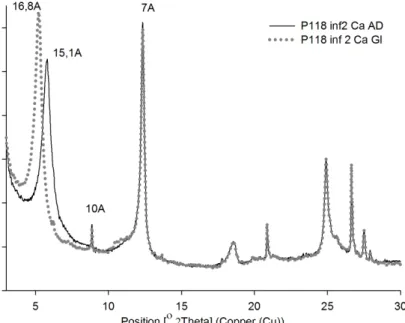
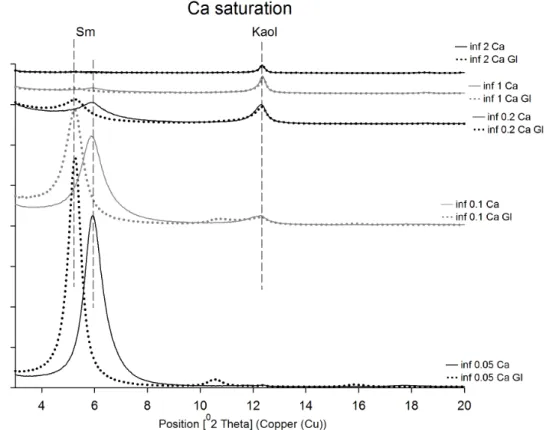
The XRD pattern (Figure 3) for Ca saturation, exhibits a d001 at 15.1 Å, which is displaced to 16.8 Å after ethylene glycol solvation. This behavior is typical of smectites. Furthermore, kaolinite is observed with peaks at d001 = 7.2 Å and d002 = 3.57 Å and micas, at d001 =10 Å and d002 = 5 Å. The d001 = 7.3 Å can also be attributed to serpentine. In order to properly identify these minerals, a heating treatment at 550 °C was performed. The d001 = 7.2 Å disappeared at 550 °C heating treatment, confirming the kaolinite presence (Figure 4). At the same time, smectite peak partially displaced from d001 = 12 Å to 10 Å after heating treatment and a small reflection at 11.4 Å can be observed, assigned to mica/smectite interstratified.
Figure 3. XRD pattern for Ca-‐saturation treatment. Smectite displaces d001 from 15.1 Å to 16.8 Å after ethylene glycol treatment. Mica and kaolinite remain (10 Å and 7 Å, respectively).
Figure 4. XRD pattern for K-‐saturated sample. After 550 ºC heating treatment the d001 (7 Å) of kaolinite collapse. Smectite peak displaced to 11.4 Å and mica remains.
The particle size separation results are shown in Figure 5. Kaolinite and micas are concentrated in the coarser fractions (>0.01 µm), whereas smectite is essentially present in the fine fractions (<0.2 µm).
Scanning electron microscopy analysis (SEM) and mid infrared spectroscopy (MIR) were performed from the products of particle sizes separations.
Figure 5. XRD patterns for all fractions (<0.05 µm, >0.05 to <0.1 µm, >0.1 to <0.2 µm, >0.2 to <1 µm and >1 to <2
µm). Smectites are observed in fractions <0.2 µm, whereas kaolinite is concentrated in fractions >0.2 µm.
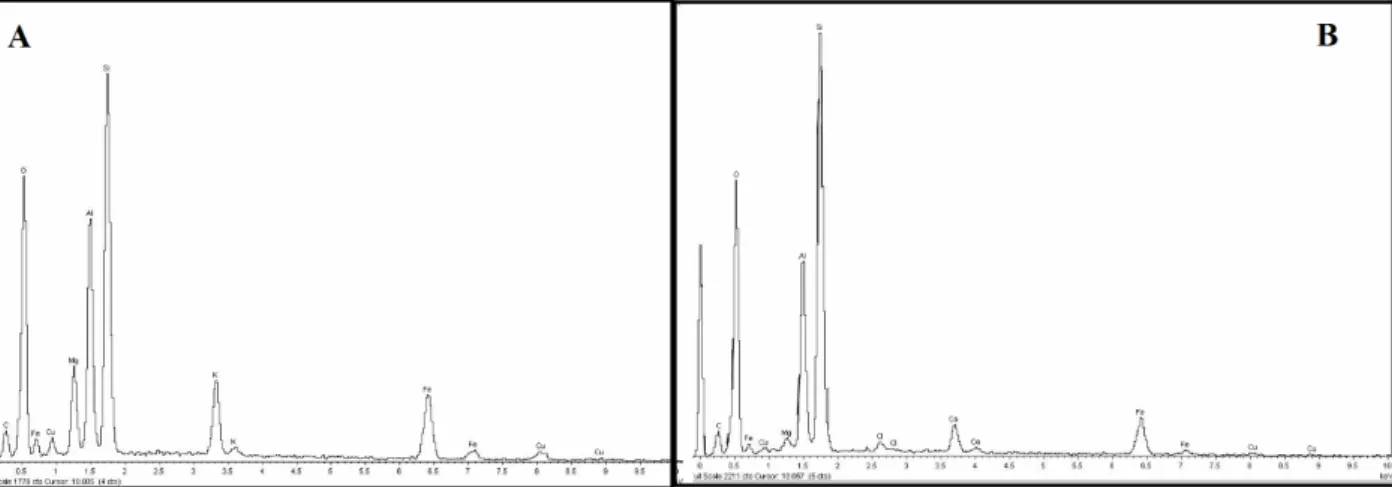
Energy dispersion spectroscopy (EDS) analysis coupled to SEM determined that copper is essentially associated to micas and partially associated to smectite, as shown in Figures 6A and 6B.
Figure 6. EDS. A-‐ Mica, copper is mainly associated to this mineral. B-‐ Smectite, Cu is secondarily associated to
smectite.
The mid infrared spectroscopy analysis was performed at different sizes fractions: < 0.05 µm, >0.05 to <0.1 µm, >0.1 to <0.2 µm, >0.2 to <1 µm and >1 to <2 µm (Figure 7). The absorption bands at 3695 cm-‐1, 3669 cm-‐1, 3653 cm-‐1 and 3620 cm-‐1 are typical of kaolinite OH-‐stretching
vibrations (Madejová et al., 2011). These absorption bands are remarkable for the fraction higher than 0.05 µm, confirming that kaolinite is concentrated in the coarser fractions. Furthermore, the absorption bands at 935 and 913 cm-‐1 are attributed to Al
2OH bending vibration of kaolinite
(Madejová et al., 2011). Wilson (1994) also attributes the absorption bands at 795 and 758 cm-‐1
about equal intensity to kaolinite.
The absorption band at 3623 cm-‐1, typical of montmorillonite (Madejová et al., 2011),
usually overlaps the kaolinite OH-‐stretching vibration at 3620 cm-‐1. Considering this, only the
absorption bands assigned to OH-‐bending vibrations were taken into account to distinguish smectites. The absorption band at 915 cm-‐1 is assigned to δAl
2OH of montmorillonites.
The bands at 870 cm-‐1 is remarkable for fractions smaller than 0.1 µm, confirming the
presence of smectite, which exhibits Al partially replaced for Fe (δAlFe3+OH), i.e. Fe-‐
montmorillonite as already observed by Petit et al. (2002) and Mano et al. (2014).
Figure 7. MIR spectra for all fractions. Fractions lower than 0.1 µm exhibit smectite with absorption bands at 870
cm-‐1 assign to δAlFe3+OH. The other fractions exhibit high amounts of kaolinite, with typical absorption bands at 3695 cm-‐1, 3669 cm-‐1, 3653 cm-‐1 e 3620 cm-‐1.
4 CONCLUSIONS
Sample P118 is essentially composed of quartz and clay minerals. Concerning the clay minerals, Ca-‐saturations treatment identified kaolinite, micas and smectite. Serpentine was discarded, since the reflection d001= 7.2 Å disappeared after 550 °C heating treatment. Mid
infrared analysis (MIR) on particles smaller than 2 µm verified that the coarse fractions (>0.2 µm) are mainly composed of micas and kaolinite, whereas fine fractions (<0.1 µm) are essentially composed of smectite. Furthermore, MIR identified Fe-‐montmorillonite as smectite, with Al replaced by Fe in octahedral sheets. Petit et al. (1992) also found a Fe-‐rich dioctahedral smectite at the Salobo deposit (Carajás, Brazil). They suggested that Salobo smectites are composed of a mixture of particles of two compositions, the first one, essentially ferric and second one with Al and Mg in the octahedral sheets. Toledo-‐Groke et al. (1987) also observed a Cu-‐rich dioctahedral smectite at the same deposit.
K-‐saturations treatment followed by heating treatment at 550° C showed a narrow peak at 11.4 Å, which suggests the presence of mica/smectite interstratified clay mineral. Ildefonse et
al. (1986) described a regular biotite/chlorite or vermiculite at 11.7 Å; however, in their study,
smectite was not observed.
Finally, EDS analysis showed that the element Cu is specially associated to micas and secondarily to smectite. Ildefonse et al. (1986) and Toledo-‐Groke et al. (1985) had already found Cu associated to biotite at Salobo. In the smectites, Cu can possibly replace Al or Mg in the octahedral sites, as already described by Mosser et al. (1990). However due to small contents in Cu, it was not possible to observe specific vibration bands.
To summarize, the coarser fraction (>2µm) of the sample, composed by quartz that can be discarded, once copper is essentially associated to clay minerals.
It is worth highlighting to remember that the methodology applied to this study works well for pure clays minerals. For interstratified clay minerals, the behavior and the d-‐spacings measured by XRD can change with the cations saturations, ethylene glycol and heating treatments, depending on the clay mineral species present, as described by Walker (1957) and Bailey (1982).
5 ACKNOWLEDGMENTS
This study has been supported by CNPq (Conselho Nacional de Desenvolvimento Científico e Tecnológico -‐ Brasil) -‐ Project Ciências Sem Fronteiras: 249132/2013-‐3. The authors also thank Instituto Tecnológico Vale for the samples and all supports.
Conflicts of interest
The authors declare no conflicts of interest.
6 REFERENCES
1. Bailey, S.W. Nomenclature for regular interstratifications. American Mineralogist. 67, 394-‐ 398. 1982.
2. Brindley, G. W. and Brown, G. Crystal structures of clay minerals and their X-‐ray identification. Mineralogical Society -‐ Monograph, n. 5, 495 p. 1980.
3. Christidis G. E., Eberl D.D. Determination of layer-‐charge characteristics of smectites. Clays and Clay Minerals. 51 (6); 644-‐655. 2003.
4. Decarreau, A., Colin, F., Herbillon, A., Manceau, A., Nahon, D., Paquet, H., Trauth-‐Badaud, D. and Trescases, J. J. Domain segregation in Ni-‐Fe-‐Mg-‐smectites. Clays and Clay Minerals. 35, 1, 1-‐10. 1987.
5. Grauby O., Petit S., Decarreau A. and Baronnet A. The nontronite-‐saponite series : An experimental approach. European Journal of Mineralogy; 6; 99-‐112. 1994.
6. Ildefonse, P., Manceau, A., Prost, D. and Toledo-‐Groke, M.C. Hydroxy-‐Cu-‐vermiculite formed by the weathering of Fe-‐biotites at Salobo, Carajas, Brazil. Clays and Clay Minerals. 34, 3, 338-‐345. 1986.
7. Langer, E. Ferronickel production at Morro do Nickel, Minas Gerais, Brazil. In: International Laterite Symposium. [Proceedings]; 1979, New Orleans, Louisiana; ed. by D.J.I. Evans; R.S. Shoemaker and H. Veltman. New York. p. 397-‐411. 1979.
8. Madejová, J., Balan, E. and Petit, S. Application of vibrational spectrocopy to the characterization of phyllosilicates and other industrial minerals. In: Christidis, G. E. (Ed.). Advances in the characterization of industrial minerals. Middlesex: European Mineralogical Union/Mineralogical Society of Great Britain and Ireland (EMU Notes in Mineralogy). 9, 6, 171-‐226. 2011.
9. Mano E.S., Caner L., Petit S., Chaves A.P. and Mexias A.S. Mineralogical characterization of Ni-‐bearing smectites from Niquelândia, Brazil. Clays and Clay Minerals. 62 (4); 324-‐335. 2014. 10. Mano E.S. Influência dos argilominerais dos minérios de níquel lateríticos na recuperação deste metal. São Paulo, 2013. Tese de Doutorado-‐Escola Politécnica da Universidade de São Paulo, São Paulo. 2013.
11. Moore D.M. and Reynolds R.C.Jr. X-‐ray diffraction and the identification and analysis of clay minerals. 2nd. ed. Oxford: University Press. 1989.
12. Mosser, C., Mestdagh, M., Decarreau, A. and Herbillon, A. J. Spectroscopic (ESR, EXAFS) evidence of Cu for (Al-‐Mg) substitution in octahedral sheets of smectites. Clay Minerals. 25, 271-‐282. 1990.
13. Petit, S., Caillaud, J., Righi D., Madejová, J., Elsass, F. and Köster, H.M. Characterization and crystal chemistry of an Fe-‐rich montmorillonite from Ölberg, Germany. Clay Minerals, 37, 283-‐297. 2002.
14. Petit, S., Righi, D., Madejova, J. and Decarreau, A. Layer charge estimation of smectites using infrared spectroscopy. Clay Minerals. 33,579-‐591. 1998.
15. Petit S., Prot T., Decarreau A., Mosser C. and Toledo-‐Groke M.C. Crystallochemical study of a population of particles in smectites from a lateritic weathering profile. Clays and Clay Minerals. 40 (4); 436-‐445. 1992.
16. Richter, D. Uma rota de recuperação de metal a partir de escória secundária da produção de ferroníquel. São Paulo, 2009. Dissertação Mestrado-‐Escola Politécnica da Universidade de São Paulo, São Paulo. 2009.
17. Toledo-‐Groke, M.C.; Melfi, A.J and Parisot, J.C. Comportamento do cobre durante o intemperismo das rochas xistosas cupríferas do Salobo 3α, Serra dos Carajás. Geochimica Brasiliensis, 1 (2), 187-‐200 p. 1987.
18. Toledo-‐Groke, M. C.,: Prost, D., Ildefonse, P., Melfi, A. J., Delvigne, J. and Parisot, J. C. Alteração dos minerais na zona supérgena da formação cuprífera do Salobo 3a (Serra dos Carajás) -‐ localização do cobre nos produtos secundários. Revista Brasileira de Geociências. 15, 4, 293-‐299. 1985.
19. Walker. G.F. On the differentiation of vermiculites and smectites in clays. Clay Mineralogy Bulletin, 3, 154-‐163. 1957.
20. Wilson, M. Clay mineralogy: spectroscopic and chemical determinative methods. Chapman and Hall: London. 1994.