CERNE
Historic: Received 30/01/2018 Accepted 22/05/2018
Keywords: Growing space Reineke Silviculture Stand density Stocking
1 Kastamonu University - Kastamonu, Kastamonu Province, Turkey - ORCID: 0000-0001-7107-3176 +
Correspondence:
DOI: 10.1590/01047760201824022513
Ferhat Kara1+
THE GROWING SPACE UTILIZATION OF MAIN TREE SPECIES IN NORTHERN TURKEY
KARA, F.; The growing space utilization of main tree species in northern Turkey. CERNE, v. 24, n. 2, p. 133-139, 2018.
HIGHLIGHTS
Maximum size density relationships varied among tree species.
Size density relationships among species was attributed to their shade tolerance.
Species-specifi c size density relationships is needed for more appropriate stand development approaches.
ABSTRACT
INTRODUCTION
Growth and productivity of an individual tree are generally associated with the available growing space, which can be described in terms of stand density (Krajicek et al., 1961; Zeide, 2005). A general relationship between the number of trees and their average size is often described in forestry, average individual tree size decreases when the number of trees per hectare increases (Zeide 1995). The relationship between tree size and their spatial density (i.e., MSDRs) is crucial to describe stand growing space utilization (Lhotka and Loewenstein, 2008), and it has been a topic of research in forestry throughout the history (Cao et al., 2000). Understanding MSDRs helps silviculturists and forest managers manipulate available growing space, and consequently, enhance tree survival and growth (Lhotka and Loewenstein, 2008). Several stand density measures, including stand basal area (m2.ha-1), stand volume (m3.ha-1)
and number of trees per unit area, have been widely used to help allocating growing space during forestry practices (Kara et al., 2017). However, it has also been recommended that MSDRs should be taken into account in estimating the degree of site occupancy and growing space allocation (Comeau et al., 2010).
The model introduced by Reineke (1933) has been one of the most commonly used methods to assess MSDRs in forestry (Newton 1997; del Rio et al. 2001). MSDRs for a tree species, which are frequently used as indication of competition among trees (Gingrich, 1967), are defined using the average maximum stand density (DAM) attainable by the species (Reineke, 1933). Reineke (1933) suggested that the slope of these relationships is universal (i.e., -1.605) across all tree species regardless of site quality. However, several studies have revealed that both slope and intercept are species-specific, and may vary in different regions (Solomon and Zhang, 2002; Pretzsch and Biber, 2005; Weiskittel et al., 2009; Comeau et al., 2010; Reyes-Hernández et al., 2013; Bravo-Oviedo et al., 2018). The slope is important because it explains the self-thinning behavior of a tree species (Lhotka and Loewenstein, 2008). Therefore, some scientists have stated that the use of Reineke’s (1933) universal slope for every tree species may cause inaccuracy in estimating and controlling stand density (Bazzaz and Grace, 1997; Pretzsch and Biber, 2005). As a consequence, species-specific local observations regarding the MSDRs have been recommended (Comeau et al., 2010).
Oriental beech (Fagus orientalis Lipsky), Trojan fir (Abies nordmanniana subsp.equi-trojani), black pine (Pinus nigra Arnold) and Scots pine (Pinus sylvestris L.) are
four of the main tree species in Turkey, and native to the northern part of the country. These tree species have economic and ecological importance in Turkish forestry since they provide high-quality timber and represent rich biodiversity (Ertekin and Özel, 2010; Sevik, 2012; Atik, 2013). Approximately 8,800.000 ha are occupied by these tree species, which roughly represents 40% of the total forested land in Turkey (General Directorate of Forestry, 2014). Oriental beech, Trojan fir, black pine and Scots pine have been usually managed using similar silvicultural prescriptions in Turkey, especially using shelter-wood method. However, it has been stated that they represent different crown architecture, growth rate and shade tolerance (Odabaşı et al., 2004). It is unknown whether the MSDRs differ among these tree species.
Several studies have explored the MSDRs for different tree species around the world (Cao et al., 2000; Lhotka and Loewenstein, 2008; Cameau et al., 2010), but, to our knowledge, these relationships have not been studied for the main tree species in northern Turkey. For example; Hynynen (1993) developed MSDRs for Scots pine forests in Finland, but, he stated that this MSDRs may vary for Scots pine stands in different regions. For these reasons, the objectives of this study are to (i) determine the relationships between tree size and stand density for Oriental beech, Trojan fir, black pine and Scots pine trees, and (ii) compare the DAM slopes among the species, (iii) compare their DAM slopes with the Reineke’s (1933) universal slope of -1.605.
MATERIAL AND METHODS
The DAM, in which trees have minimum necessary growing space to survive, has to be estimated from fully-stocked stands (Gingrich, 1967), which are undisturbed stands that are at or near maximum density for their age. To determine the DAM for Oriental beech, Trojan fir, black pine and Scots pine forests, a database from the Regional Forest Directorate in Kastamonu, Turkey was used (Figure 1). The database was generated from the temporary inventory plots in the region for years 2008 through 2011. Plot sizes are 400 or 600 m2 depending on the stand density
(i.e., larger plots were used to measure stands with less tree density). In the plots, diameter at breast height (DBH) of all trees taller than 1.3 m in height were recorded for each plot. For each species in the database, plots from pure stands in which target species’ basal area was ≥ 90% were selected. Table 1 shows the number of plots selected, and their descriptive statistics by species.
FIGURE 1 Plot locations and boundary of Kastamonu Regional Forest Directorate in Turkey. Plots are located in Ayancık, Azdavay,
Cide, İnebolu, Küre, Sinop, Türkeli, Araç, İhsangazi, Karadere, Samatlar regions.
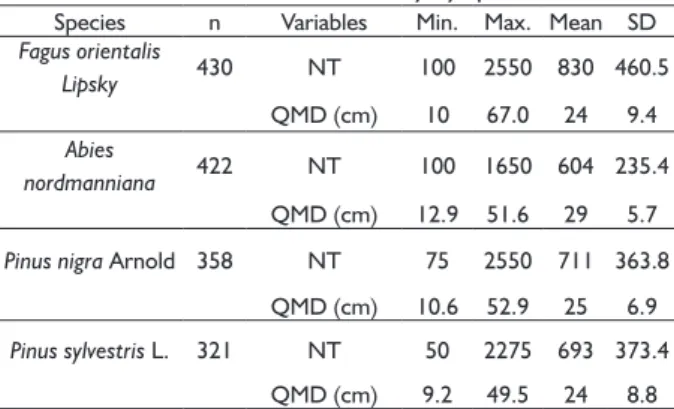
TABLE 1 Summary of data from all the inventory plots that were available for this study by species.
Species n Variables Min. Max. Mean SD Fagus orientalis
Lipsky 430 NT 100 2550 830 460.5 QMD (cm) 10 67.0 24 9.4 Abies
nordmanniana 422 NT 100 1650 604 235.4 QMD (cm) 12.9 51.6 29 5.7
Pinus nigra Arnold 358 NT 75 2550 711 363.8
QMD (cm) 10.6 52.9 25 6.9
Pinus sylvestris L. 321 NT 50 2275 693 373.4
QMD (cm) 9.2 49.5 24 8.8
where n is number of plots, and NT= total density (trees ha -1).
Further, stand density index - SDI ( Reineke, 1933) was calculated with [1], where NT is the number of trees per hectare, and QMD is the quadratic mean diameter. Then, the relative stand density -RSD for each plot was calculated with [2] (Drew and Flewelling, 1979).
[1]
[2]
Plots with a relative stand density higher than 0.7 were selected for further analysis, as suggested by Solomon and Zhang (2002). Another reason for choosing the relative stand density higher than 0.7 is to obtain adequate number of plots to defi ne the (DAM) (Solomon and Zhang, 2002). Following the selection of fully-stocked plots for each species, DAM patterns for Oriental beech, Trojan fi r, black pine and Scots pine were quantifi ed using Reineke’s (1933) model (3). It should be noted that the regression models were fi t using only the plots that were fully-stocked, where b0 and b1 are the model coeffi cients.
[3]
As the fi nal step, NT and their associated QMD obtained from fully-stocked plots were plotted on a log– log scale to estimate the coeffi cients of the DAM models for Oriental beech, Trojan fi r, black pine and Scots pine forests. In order to fi t the DAM models, ordinary least square (OLS) regression and reduced major axis (RMA) regression (VanderSchaaf and Burkhart, 2007; Lhotka and Loewenstein, 2008; Comeau et al. 2010) have been commonly used. However, in recent research, it has been suggested that these regression methods may produce inappropriate slopes of DAM (Zhang et al., 2005). Zhang et al. (2013) stated that quantile regression (QR) gives less biased and more effi cient estimates than OLS and RMA when fi tting MSDRs. For this reason, QR was used to fi t the DAM models. In order to compare the DAM slopes of each species with the Reineke’s (1933) universal slope of -1.605, a t test was used as suggested by Lhotka and Loewenstein (2008). The “rq” function and “lm” function for fi tting the DAM models and comparing the DAM slopes of the species, respectively, were utilized in R-Statistical software (R Development Core Team, 2010).
RESULTS AND DISCUSSION
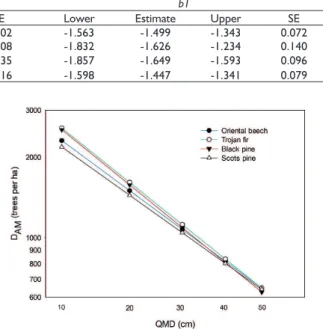
The DAM model parameters for each species are summarized in Table 3. For black pine and Trojan fir, the slopes were -1.649 and -1.626, respectively, which are steeper than the value -1.605 proposed by Reineke (1933). The slopes for Oriental beech and Scots pine were -1.499 and -1.447, respectively, which are smoother than the Reineke’s (1933) universal slope (Table 3). As mentioned before, Reineke (1933) stated that the slope of MSDRs are universal (i.e., -1.605), which means it is species-independent. However, several studies have rejected the idea that the slope and intercept of these models are species independent, and they stated that many factors can influence MSDRs (Solomon and Zhang, 2002; Prethz and Biber, 2005; Weiskittel et al., 2009; Comeau et al., 2010; Reyes-Hernández et al., 2013; Bravo-Oviedo et al., 2018). Our findings also agree with the statement that the slope of size-density models is species-specific (Table 3). In this study, the slopes for Oriental beech, Trojan fir, black pine and Scots pine MSDRs were significantly different from Reineke’s (1933) universal slope of -1.605 (α=0.05). The self-thinning in a stand can be explained with the slope of size-density models created for that species (Lhotka and Loewenstein, 2008). The use of a universal slope may result in unsuitable formulation of thinning regimes (Pretzsch and Biber, 2005).
The DAM trends across a range of QMD for Oriental beech, Trojan fir, black pine and Scots pine are illustrated in Figure 3, showing variation for the selected species (Figure 3). When comparing the four species analyzed, the slopes of DAM are statistically significant across all species (α=0.05) (Figure 3); but, there was not statistically significant differences between black pine and Trojan fir (α=0.05) (Figure 3).
Black pine had the steepest slope of the three species analyzed (Table 3). Comparisons among species included in this study highlighted that the slopes of DAM vary among tree species of northern Turkey. It has been suggested that differences of slopes among species can be attributed to their shade tolerance (Petzsch and Biber, 2005). Oriental beech and Trojan fir are known to be shade tolerant tree species, while black pine and Scots pine are considered semi-tolerant and intolerant to shade, respectively (Odabaşı et al., 2004). Petzsch and Biber (2005) argue that shade-tolerant species present a steeper slope, but, in this study, black pine has the steepest slope although it is considered a semi-tolerant species (Odabaşı et al., 2004). This can be attributed to black pine’s tolerance to shade at young ages. It has been suggested that black pine is more tolerant to shade when young, and they become more intolerant of shade with
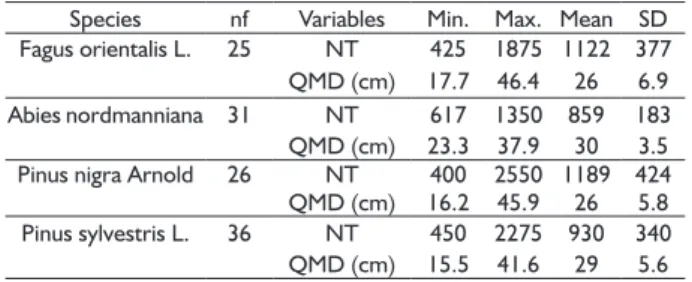
TABLE 2 Descriptive statistics of the fully-stocked stands selected to develop the average maximum stand density (DAM) equations.
Species nf Variables Min. Max. Mean SD Fagus orientalis L. 25 NT 425 1875 1122 377 QMD (cm) 17.7 46.4 26 6.9 Abies nordmanniana 31 NT 617 1350 859 183 QMD (cm) 23.3 37.9 30 3.5 Pinus nigra Arnold 26 NT 400 2550 1189 424 QMD (cm) 16.2 45.9 26 5.8 Pinus sylvestris L. 36 NT 450 2275 930 340 QMD (cm) 15.5 41.6 29 5.6
Where nf is number of fully-stocked plots, NT is the number of trees per hectare, SD is standard deviation.
The data utilized to fit the DAM models for Oriental beech, Trojan fir, black pine and Scots pine are illustrated in Figure 2. As stated before, the relationship between number of trees per unit area and QMD is linear on logarithmic scale as we observed in this study (Figure 2). Stands with a relative density lower than 0.7 appear to be more dispersed for black pine and Scots pine than for the other two species (Figure 2). We believe that this might be the result of their growth behavior, since black pine and Scots pine forests are more shade-intolerant tree species than Oriental beech and Trojan fir. Another reason might be that, the possibility of obtaining pure black pine and Scots pine stands with lower density is higher in northern Turkey (Odabaşı et al., 2004). Although the relationship between number of trees per unit area and QMD is commonly reported with a straight line on logarithmic scale, it should be noted that the shape of the self-thinning line displays a curvilinear trend (Tang et al., 1994; Charru et al., 2012; Fonseca et al., 2017). Zeide (1987) stated that a deviance from the straight line should occur at both ends is expected.
increasing age (Odabaşı et al., 2004). Another reason for the differences of DAM among the tree species can be associated with their foliage type, since Vospernik and Sterba (2014) found out that differences between broadleaf and conifer species exist in terms of DAM.
It should be noted differences of DAM among the tree species is also variable for small and large stand QMDs (Figure 3), this is, for small stand QMD (i.e., 10 cm), a black pine tree occupies less growing space (i.e., higher DAM) while a Scots pine tree occupies more growing space for the same QMD (Figure 3). This indicates that black pine is able to “pack” relatively more trees of a small QMD in the same available growing space. In another words, young black pine trees contributes less crown area and species composition than other tree species as suggested by Hasenauer (1997). However, the amount of growing space occupied by each tree species seems to be similar for large stand QMDs suggesting that the tree species occupy similar amount of growing space when stand QMD is larger than 40 cm (Figure 3).
It has been previously suggested that tree age and site characteristics have negligible effects on slope and intercept of MSDRs (Lhotka and Loewenstein, 2008); however, recent studies have indicated that these relationships may vary depending on regions for a given species (Pretzsch, 2002; Comeau et al., 2010). Our findings also support this statement. Pretzsch and Biber (2005) examined MSDRs for Scots pine forests in Germany, finding that the slope of DAM was -1.593 which is steeper than the value that what we obtained in our study for the same species (i.e., -1.447). The same authors reported a slope of -1.789 for beech in Germany, which is also steeper than the slope for Oriental beech (-1.626) that we obtained. Moreover, the intercepts for Scots pine and Oriental beech obtained in this study are considerably lower than that observed by Pretzsch and Biber (2005) suggesting the intercept of DAM is also region specific. This indicates that much smaller basal areas and therefore less dense stands are observed for the same species in Turkey. These support the fact that the slope of the MSDRs might be region specific. As a consequence, results from this study are valid for the species analyzed and constrained within the region where the data were obtained, since it has been also suggested that environment characteristics
may influence the MSDRs for a tree species (Bi, 2001; Weiskittel et al., 2009; Comeau et al., 2010).
In addition to the effects of region on the slope and intercept of MSDRs, recent studies have revealed that many other factors can influence the MSDRs (Weiskittel et al., 2009; Comeau et al., 2010; Reyes-Hernández et al., 2013; Bravo-Oviedo et al, 2018). Weiskittel et al. (2009) found that site index, stand origin and site aspect influenced the slope of MSDRs for Douglas-fir (Pseudotsuga menziesii var. menziesii [Mirb.] Franco), western hemlock (Tsuga heterophvlla), and red alder (Alnus rubra Bong.). In another study, Reyes-Hernandez et al. (2013) observed MSDRs of pure and mixed stands of trembling aspen (Populus tremuloides Michx.) and white spruce (Picea glauca (Moench) Voss.) in Canada, and stated that MSDRs can be affected by site quality, stand composition and soil nutrients. Shade tolerance and drought tolerance of tree species are also known to have significant influence on the slope of MSDRs (Pretzsch and Biber, 2005; Bravo-Oviedo et al., 2018).
On the other hand, relationships reported here for pure stands, should not be used and applied in mixed stands, or be cautiously applied if needed. In addition to pure Oriental beech, Trojan fir, black pine and Scots pine forests mixtures of the same species are common in northern Turkey (Odabaşı et al., 2004). In this regard, Lhotka and Loewenstein (2008) suggested that a mixed stand can be treated as a single-species stand if the species are functionally similar, but also that, relative density metrics
TABLE 3 Model coefficients for average maximum stand density (DAM) equations using fully-stocked plots. b0 and b1 are model
coefficients, and SE is standard error of estimates.
Species b0 b1
Lower Estimate Upper SE Lower Estimate Upper SE
F. orientalis L. 4.907 5.127 5.220 0.102 -1.563 -1.499 -1.343 0.072
A. nordmanniana 4.738 5.323 5.628 0.208 -1.832 -1.626 -1.234 0.140
P. nigra Arnold. 5.264 5.344 5.684 0.135 -1.857 -1.649 -1.593 0.096
P. sylvestris L. 4.911 5.042 5.266 0.116 -1.598 -1.447 -1.341 0.079
are needed when the mixtures contain dissimilar species. Therefore, the application of MSDRs reported here will depend on the specific mixture of species that is found.
Weller (1990) suggested two different thinning lines; static and dynamic thinning lines. The static thinning line is defined using observations from many different stands of a species regardless of age and other factors, while the dynamic thinning line is determined using observations in an individual crowded stand (Weller, 1990; Reyes-Hernandez et al., 2013). Some factors such as site quality, climate, and stand composition can influence dynamic thinning line, but, static thinning line is proposed to be constant for all stands of a given species (VanderSchaaf and Burkhart, 2007). In this study, the analysis of MSDRs have been based on the a static thinning line, thus, determination of dynamic thinning lines for the species examined are recommended in future studies.
CONCLUSION
Four economically important tree species of northern Turkey were compared in terms of their growing space utilization. Our results suggest that the MSDRs vary among tree species, and that the slope of these relationships is different from the universal slope of -1.605 suggested by Reineke (1933). Findings of this study highlighted the necessity of developing species-specific size density relationships for more appropriate stand development approaches. These results should not be utilized for the subject species located in other regions, since environment and other factors may influence MSDRs. The DAM models reported here can be utilized to create stand density management tools, such as stocking charts and density management diagrams. Due to the importance of MSDRs for mixed stands, we recommend the development of DAM models for mixed stands of Oriental beech, Trojan fir, black pine and Scots.
ACKNOWLEDGEMENTS
The author would like to acknowledge Kastamonu Regional Forest Directorate (KRFD) in Turkey for providing the long-term datasets.
REFERENCES
ATIK, A. Effects of planting density and treatment with vermicompost on the morphological characteristics of Oriental beech (Fagus orientalis Lipsky). Compost Science and Utilization. v. 21, p. 87 98, 2013.
BAZZAZ, F. A.; GRACE, J. Plant resource allocation. Academic Press, CA, USA, 1997. 303 p.
BI, H. The self-thinning surface. Forest Science. v. 47, p. 361-370, 2001.
BRAVO-OVIEDO, A.; CONDÉS, S.; del RÍO, M.; PRETZSCH, H.; DUCEY, M. J. Maximum stand density strongly depends
on species-specific wood stability, shade and drought
tolerance. Forestry: An International Journal of Forest Research. 2018.
CAO, Q. V.; DEAN, T. J.; BALDWIN, J. Modeling the size– density relationship in direct-seeded slash pine stands.
Forest Science. v. 46, n. 3, p. 317-321, 2000.
CHARRU, M.; SEYNAVE, I.; MORNEAU, F.; RIVOIRE, M.; BONTEMPS, J. Significant differences and curvilinearity in the self-thinning relationships of 11 temperate tree species assessed from forest inventory data. Annals of Forest Science. v. 69, n. 2, p. 195–205, 2012.
CHISMAN, H. H.; SCHUMACHER, F. X. On the tree-area ratio and certain of its applications. Journal of Forestry. v. 38, n. 4, p. 311–317, 1940.
COMEAU, P. G.; WHITE, M.; KERR, G.; HALE, S. E. Maximum density–size relationships for sitka spruce and coastal
Douglas-fir in Britain and Canada. Forestry. v. 83(5), p. 461-468, 2010.
ÇOLAK, A. H.; TOKCAN, M.; ROTHERHAM, I. D.; ATICI, E. The amount of coarse dead wood and associated decay rates in forest reserves and managed forests, northwest Turkey. Investigación Agraria: Sistemas y Recursos Forestales. v. 18, n. 3, p. 350-359, 2009.
DEL RÍO, M.; MONTERO, G.; BRAVO, F. Analysis of diameter– density relationships and self-thinning in non-thinned even-aged Scots pine stands. Forest Ecology and Management. v. 142, n. 1, p. 79-87, 2001.
ERTEKIN, M.; ÖZEL, H. B. Çorum yöresi erozyonla mücadele
kapsamında yapılan karaçam (Pinus nigra Arnold.) ve sedir (Cedrus libani A. Rich.) ağaçlandırmaları. Journal of Bartın
Forestry Faculty. v. 12, p. 77-85, 2010.
FONSECA, T.; MONTEIRO, L.; ENES, T.; CERVEIRA, A. Self-thinning dynamics in cork oak woodlands: providing a baseline for managing density. Forest Systems. v. 26, n. 1, p. e006, 2017.
GENERAL DIRECTORATE OF FORESTRY. Forest atlas.
Publications of General Directorate of Forestry. Available at: https://www.ogm.gov.tr/ekutuphane/Yayinlar/ Orman%20Atlasi.pdf. Accessed in: 10 November 2017.
GINGRICH, S. F. Measuring and evaluating stocking and stand density in upland hardwood forests in the central states.
Forest Science. v. 13, p. 38-53, 1967.
HYNYNEN, J. Self-thinning models for even-aged stands of Pinus sylvestris, Picea abies and Betula pendula. Scandinavian Journal of Forest Research. v. 8, p. 326-336, 1993.
KRAJICEK, J. E.; BRINKMAN, K. A.; GINGRICH, S. F. Crown competition a measure of density. Forest Science. v. 7, p. 35-42, 1961.
LARSEN, D. R.; DEY, D. C.; FAUST, T. A stocking diagram for Midwestern eastern cotton wood-silver maple-American sycamore bottomland forests. Northern Journal of Applied Forestry. v. 27, p. 132–139, 2010.
LHOTKA, J. M.; LOEWENSTEIN, E. F. An examination of
species-specific growing space utilization. Canadian Journal of Forest Research. v. 38, n. 3, p. 470-479, 2008.
NEWTON, P. F. Stand density management diagrams: review of their development and utility in stand-level management planning. Forest Ecology and Management. v. 98, n. 3, p. 251-265, 1997.
ODABAŞI, T; CALIŞKAN, A; BOZKUŞ, H. F. Silvikültür
tekniği. İstanbul Üniversitesi Yayınları, Publication no: 4459, 2004. 314 p.
PRETZSCH, H. A unified law of spatial allometry for woody and herbaceous plants. Plant Biology. v. 4, p. 159–166, 2002.
PRETZSCH, H.; BIBER, P. A re-evaluation of Reineke’s rule and stand density index. Forest Science. v. 51, n. 4, p. 304-320, 2005.
R Development Core Team. R: A language and environment for statistical computing. R Foundation for Statistical Computing, Vienna, Austria, 2010.
REINEKE, L. Perfecting a stand-density index for even-aged forests. Journal of Agricultural Research. v. 46, p. 627-638, 1933.
REYES-HERNANDEZ, V.; COMEAU, P. G.; BOKALO, M. Static and dynamic maximum size–density relationships for mixed trembling aspen and white spruce stands in western Canada. Forest Ecology and Management. v. 289, p. 300-311, 2013.
SEVIK, H. Variation in seedling morphology of Turkish fir (Abies Trojaniana subsp. bornmulleriana Mattf). African Journal of Biotechnology. v. 11, n. 23, p. 6389-6395, 2012.
SOLOMON, D. S.; ZHANG, L. Maximum size-density relationships for mixed in the northeastern USA.
Forest Ecology and Management. v. 155, p. 163-170, 2002.
TANG, S.; MENG, C. H.; MENG, F.; WANG, Y. H. A growth and self-thinning model for pure even-age stands: theory and applications. Forest Ecology and Management. v. 70(1), p. 67–73, 1994.
VANDERSCHAAF, C. L.; BURKHART, H. E. Comparison of methods to estimate Reineke’s maximum size-density relationship species boundary line. Forest Science. v. 53, p. 435–442, 2007.
VOSPERNIK, S.; STERBA, H. Do competition-density rule and self-thinning rule agree? Annals of Forest Science. v. 72(3), p. 379-390, 2014.
WEISKITTEL, A.; GOULD, P.; TEMESGEN, H. Sources of variation in the self-thinning boundary line for three species with varying levels of shade tolerance. Forest Science. v. 55, p. 84-93, 2009.
WELLER, D. E. Will the real self-thinning rule please stand up?--A reply to Osawa and Sugita. Ecology. v. 71(3), p. 1204-1207, 1990.
ZEIDE, B. Analysis of the 3/2 Power law of self-thinning. Forest Science. v. 33, p. 517–537, 1987
ZEIDE, B. A relationship between size of trees and their number. Forest Ecology and Management. v. 72, p. 265- 272, 1995.
ZEIDE, B. How to measure stand density? Trees. v. 19, p. 1-14, 2005.
ZHANG, L.; BI, H.; GOVE, J. H.; HEALTH, L. S. A comparison of alternative methods for estimating the self-thinning boundary line. Canadian Journal of Forest Research. v.35, p.1507-1514, 2005.