Acta Scientiarum
http://www.uem.br/acta ISSN printed: 1679-9275 ISSN on-line: 1807-8621
Doi: 10.4025/actasciagron.v39i3.32776
Resistance to
Enneothrips flavens
Moulton and genetic parameters
estimation in interspecific genotypes of peanut
Melina Zacarelli Pirotta1*, Fabiana Mota da Silva1, Marcos Doniseti Michelotto2, Alessandra Pereira Fávero3, Ignácio José de Godoy4 and Sandra Helena Unêda-Trevisoli1
1
Departamento de Produção Vegetal, Universidade Estadual Paulista, Via de Acesso Prof. Paulo Donato Castellane, s/n., 14884-900, Jaboticabal, São Paulo, Brazil. 2Agência Paulista de Tecnologia dos Agronegócios, Polo Regional Centro Norte, Pindorama, São Paulo, Brazil. 3Empresa Brasileira de Pesquisa Agropecuária, Embrapa Pecuária Sudeste, São Carlos, São Paulo, Brazil. 4Instituto Agronômico de Campinas, Campinas, São Paulo, Brazil. *Author for correspondence. E-mail: [email protected]
ABSTRACT. Peanut is an oilseed crop of great importance for Brazilian agribusiness. A major factor affecting its production is pest incidence, mainly thrips. This study aimed to evaluate the potential for resistance to
Enneothrips flavens in genotypes derived from the cross between IAC 503 and the amphidiploid (A. magna x A.
cardenasii)4x and to estimate the genetic and phenotype parameters in these genotypes, allowing for better targeting
in the selection. The experiments were conducted in a Federer augmented block design with additional checks in two generations (F3 and F4). Resistance to thrips was evaluated by its natural infestation and the symptoms of attacks by the insect. They were also evaluated using agronomic trait indicators of interspecific segregating with cultivated species. The results indicated that the selected progeny exhibited high resistance to thrips compared to commercial genotypes, and they had the amphidiploid as the insect resistance source. Some progenies selected as resistant also had good production traits, but with the degree of suitability to the A. hypogaea L. genotypes still low, the use of a backcross as an alternative for the introgression of resistance genes and the consequent recovery of adapted genotypes of superior recurring parents is suggested.
Keywords:Arachis hypogaea L., thrips, resistance to insects, REML/BLUP.
Resistência a
Enneothrips flavens
Moulton e estimativa de parâmetros genéticos em
genótipos interespecíficos de amendoim
RESUMO. O amendoim é uma cultura de grande importância para o agronegócio brasileiro. Um dos principais fatores que afetam sua produção é a incidência de pragas como o tripes-do-prateamento. O objetivo deste trabalho foi avaliar o potencial de resistência ao tripes, em genótipos derivados do cruzamento entre a cultivar IAC 503 e o anfidiploide (A. magna x A. cardenasii)4x, assim como estimar os parâmetros genéticos e fenotípicos em tais genótipos, como auxiliares no processo de seleção. Os experimentos foram conduzidos no esquema de blocos aumentados com testemunhas intercalares em duas gerações (F3 e F4). A resistência ao tripes foi avaliada pela sua infestação natural e pelos sintomas de injúrias causadas pelo inseto. Foram avaliados também, caracteres agronômicos como indicadores da proximidade dos genótipos segregantes ao cultivado. Com base nos resultados, observou-se que as progênies selecionadas apresentaram maior resistência ao tripes quando comparadas aos genótipos cultivados, tendo o anfidiploide como fonte de resistência ao inseto. Algumas progênies selecionadas como resistentes, também apresentaram bons componentes de produção, porém, com grau de adequação aos genótipos A. hypogaea L. ainda pequeno, o que sugere o uso de retrocruzamentos como alternativa na introgressão de genes de resistência e consequente recuperação dos genótipos adaptados dos genitores recorrentes.
Palavras-chave: Arachis hypogaea L., tripes, resistência a insetos, REML/BLUP.
Introduction
Peanut crop (Arachis hypogaea L.) has great importance for Brazilian agribusiness, particularly for export, generating dividends for the country. Thus, the expansion and sustainability of the crop depends on its technological development. Brazilian production is concentrated in the Southeast states and Central South regions, especially the state of Sao Paulo, which is the largest peanut producer of the first crop and accounts
for approximately 90% of the country’s supply (Companhia Nacional de Abastecimento [CONAB], 2015).
Among the pests occurring in Brazil, thrips,
Enneothrips flavens, Moulton, 1941 (Thysanoptera:
Thripidae), is considered a key pest of the crop (Gallo et al., 2002). Some studies on current commercial cultivars have suggested that there is limited variability for resistance or tolerance to this insect (Boiça Júnior, Chagas Filho, Godoy, Lourenção, & Souza, 2012; Perozini, Silva, & Goussain, 2014), which can restrict the selection of superior genotypes.
Thus, it has been suggested that a more effective genetic resistance can be found in other species of the genus Arachis L. (Wynne & Halward, 1989). However, the use of wild species in breeding has been constrained by sterility barriers, mostly due to differences in the genome constitution and ploidy (Fávero, Godoy, & Suassuna, 2011).
The cultivated allotetraploid species has two genomes (A and B), while wild diploid species have, alternatively, genomes A or B. The cross between species of these two groups results in sterile diploid hybrid AB. To overcome this incompatibility, Simpson (1991) suggested the use of an amphidiploid, resulting from a cross between diploid species with genomes A and B, followed by chromosome doubling with the use of colchicine and then a cross between the tetraploidized amphidiploid with a cultivated peanut.
Pre-breeding research on crossings of A. hypogaea
L. with wild germplasm has been conducted in Brazil with the aim of identifying sources of resistance to major pests and foliar diseases (Fávero, Simpson, Valls, & Vello, 2006; Fávero, Moraes, Garcia, Valls, & Vello, 2009; Janini, Boiça Júnior, Godoy, Michelotto, & Fávero, 2010; Michelotto et al., 2015; Santos et al., 2011; Santos, Godoy, Michelotto, & Fávero, 2013). One of the crosses made involved an elite cultivar from the Instituto Agronômico de Campinas (IAC 503) and the amphidiploid (A. magna x A. cardenasii)4x. This
amphidiploid has been studied as a source of resistance to thrips for having A. cardenasii as one of its wild progenitors, and this species is cited in the literature as a source of resistance to various biotic agents, representing an important source of germplasm to use in peanut breeding (Holbrook & Stalker, 2003).
There are few studies on the inheritance of resistance to pests in peanuts, and for thrips, no studies are known. Thus, segregating populations in the early generations of this cross can result in valuable material for the study of the genetic parameters related to pest resistance.
In studies of early generations, heritability estimates, variance components and genetic gains are
important to defining the genetic or environmental origin of the observed variability and to contributing to the correct direction of the breeding program for the advancement of future generations and the selection of superior genotypes (Ramalho, Abreu, Santos, & Nunes, 2012).
This study aimed to (i) assess the early segregating populations of the cross involving the cultivar IAC 503 and the amphidiploid (A. magna x
A. cardenasii)4x as a source of resistance to thrips, (ii)
estimate the genetic and phenotypic population parameters, and (iii) monitor the agronomic traits of interspecific segregating genotypes of the cultivated species.
Material and methods
The experiments were conducted in two growing seasons (2013/2014 and 2014/2015) in the experimental area of Agência Paulista de Tecnologia dos Agronegócios (Apta), Polo Regional Centro Norte, in Pindorama, São Paulo State, under a natural insect infestation.
We evaluated 92 progenies in F3 (2013/2014) and F4
(2014/2015) generations that were derived from the cross between the commercial cultivar IAC 503 (A.
hypogaea L., female parent) with the synthetic
amphidiploid (A. magna x A. cardenasii)4x and advanced
by the pedigree method.
In addition to segregating progenies, additional checks were used, namely, cultivar Runner IAC 886, IAC 503, line 335 of the IAC breeding program, amphidiploid An.8 (A. magna x A. cardenasii)4x and
progenitors of the amphidiploid (A. magna - V 13751
and A. cardenasii - GKP 10017), all seeded in an
augmented block design by Federer (1956). Controls were chosen to cover a wide variability with respect to thrips resistance, according to prior knowledge of the behavior of such genotypes.
At first, seeds were left to germinate in plastic cups (200 mL) containing substrate Bioflora® and then placed in a greenhouse until the seedlings were approximately 15 cm high, after approximately 30 days, and then transplanted in the field.
Segregating populations and the genotypes of parents and controls were transplanted in 10 m-individual rows, spaced 1 m in the plant row and 1.80 m between the rows, to allow maximum individualization of each plant with no interference of one plant on the other. The experimental area was previously fertilized with NPK (8:28:16) at 250 kg ha-1,
according to the soil chemical analysis.
and 138 days after seeding (DAS) in the F3
generation, and at 54, 63, 79, and 107 DAS in the F4
generation. Analyses were conducted on the occurrence of thrips: (a) counting the number of insects (nymphs and adults) on 5 young leaflets, still closed, randomly sampled per plant; and (b) visual symptomology of a thrips attack: an application of visual symptoms scoring, ranging from 1 - leaf without symptoms to 5 - totally attacked leaves, in 5 newly opened leaves, also randomly sampled per plant (Moraes, Lourenção, Godoy, & Teixeira, 2005). The visual symptom scoring scale was applied 6 days after the infestation evaluation since, according to previous knowledge, this refers to the average opening time of leaflets and allows easy viewing of any symptoms.
Agronomic characterization was made after the manual harvest of each plant and pods were subjected to oven drying at 30°C for 72 hours, reducing moisture to the standard 13%, where the following traits were evaluated: (a) production of pods per plant (grams); (b) production of grains per plant (grams); (c) number of pods per plant; (d) number of grains per plant; and (e) percentage of pods with two locules per plant (%).
Individual and combined analyses of variance were performed. In the combined analysis, we used adjusted means for the progenies in each year, where the effects of block and generation were considered fixed and the progenies were considered random. Genetic gains in percentage for each trait in each generation were estimated by taking into account a 20% selection pressure, based on the average behavior of the controls.
Estimates of genetic parameters were based on the mixed models theory (Henderson, Kempthorne, Searle, & Krosigk, 1959), completing the estimation of the variance components with the restricted maximum likelihood method (REML) developed by Patterson and Thompson (1971). The BLUP method (best linear unbiased prediction) was used for the prediction of genetic values (Henderson, 1973).
Statistical analyses were performed using Statistical Analysis System software (SAS® 9.3,
2011). Raw data on the number of insects were transformed into (x+0.5)1/2 to fit the data to a
normal distribution. In turn, data from the production of pods, the production of grains, and the number of pods and number of grains were transformed according to the Box-Cox method (Box & Cox, 1964), whereas the percentage of pods with two seeds was subjected to arcsine transformation (percentage/100)1/2.
For a better interpretation of the genetic gain obtained for each trait, a confidence interval was constructed through the expression of Resende, Araújo, Sampaio, and Wiecheteck (1995). In this study, the accuracy of selection was calculated by the square root of the heritability. The construction of confidence intervals were made with the aid of R software (R Development Core Team, 2013).
Results and discussion
According to the results on the infestation of thrips, there were some intervals of lower and higher occurrences because population dynamics can vary according to the region and can be influenced by biotic and abiotic factors (Chagas Filho, Boiça Júnior, Godoy, Lourenção, & Ribeiro, 2008).
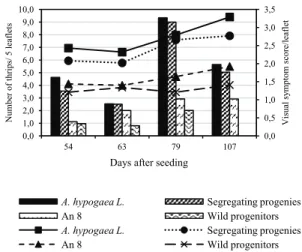
In the F3 generation (Figure 1), the largest
population of E. flavens occurred at 130 days after seeding (DAS) in the genotypes of A. hypogaea L. (Runner IAC 886, IAC 503, and L. 335) and in the segregating progenies. At 123 DAS, the highest occurrence was found in the amphidiploid (A. magna x
A. cardenasii)4x and its wild progenitors (A. magna e A.
cardenasii). The highest scores of visual symptoms were observed at 98 DAS in the segregating progenies, at 130 DAS in the amphidiploid and its wild progenitors and at 138 DAS in the genotypes of A. hypogaea L. (Figure 1).
Figure 1. Population dynamics (bars) and visual symptom scores
(lines) of E. flavens in genotypes of A. hypogaea L. (Runner IAC
888, IAC 503 and L. 335), segregating progenies in the F3
generation, and amphidiploid (A. magna x A. cardenasii)4x
and wild
progenitors (A. magna and A. cardenasii). Pindorama, State of São
Paulo, 2013/2014.
It can be observed that the wild progenitors (A. magna and A. cardenasii) had the lowest infestation and the lowest scores for visual symptoms of E. flavens, followed by the amphidiploid (A. magna x A.
0,0 0,5 1,0 1,5 2,0 2,5 3,0 3,5
0,0 1,0 2,0 3,0 4,0 5,0 6,0 7,0 8,0 9,0 10,0
88 98 109 123 130 138
Visua
l sy
mptom
sc
or
e/le
af
le
t
Numbe
r of
thr
ips/ 5 le
af
le
ts
Days after seeding
A. hypogaea L. Segregating progenies
An 8 Wild progenitors
A. hypogaea L. Segregating progenies
cardenasii)4x and by the segregating progenies. These
genotypes were therefore less infested and suffered less damage caused by the insect compared to the genotypes of A. hypogaea L., corroborating the research results of Janini et al. (2010) and Michelotto, Godoy, Fávero, Carrega, and Finoto (2013). The lower infestation and minor damage exhibited by the wild genotypes were observed in the first evaluation and remained throughout the plant cycle.
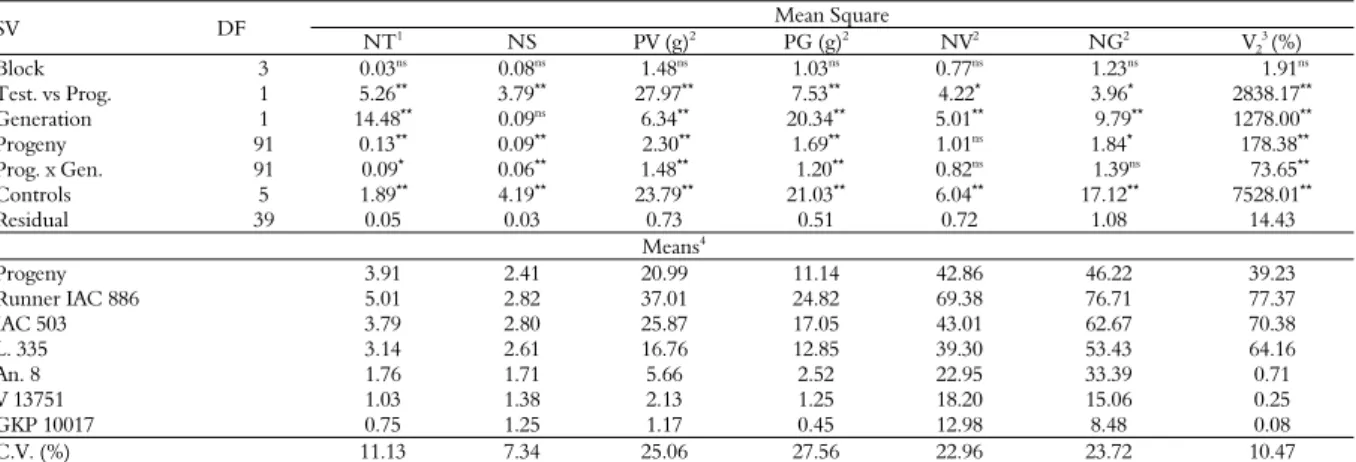
For the F4 generation, the highest infestation of
thrips was observed at 79 DAS and the highest scores of visual symptoms was at 107 DAS, in all genotypes (Figure 2).
Figure 2. Population dynamics and visual symptom scores of E. flavens in genotypes of A. hypogaea L. (Runner IAC 888, IAC 503
and L. 335), segregating progenies in the F4 generation, and
amphidiploid (A. magna x A. cardenasii)4x and wild progenitors (A.
magna and A. cardenasii). Pindorama, State of São Paulo, 2014/2015.
The mean performance of the genotypes proved what was observed in the figures; in other words, the genotypes of A. hypogaea L. had higher infestation and damage rates, especially Runner IAC 886 with the highest mean values in both generations. Wild progenitors had the lowest mean values of infestation and damage, specifically the wild species A. cardenasii (GKP 10017) (Table 1).
For infestation by E. flavens, the segregating progenies were not significantly (p> 0.05) different from IAC 503 and line 335 in the F3 generation, and
from Runner IAC 886 and IAC 503 in the F4
generation (Table 1). In relation to visual symptom scores, these progenies showed lower mean values of damage than the genotypes of A. hypogaea L. in the two generations, thus emphasizing that studies on the type of resistance presented by these genotypes should be conducted in the next stages of this study
(Table 1).
Table 1. Number of thrips in 5 leaflets (NT) and visual
symptom scores per leaflet (NS) in genotypes A. hypogaea L.
(Runner IAC 888, IAC 503 and L. 335), segregating progenies,
and amphidiploid (A. magna x A. cardenasii)4x
and wild progenitors (A. magna and A. cardenasii) in two generations, F3 and F4.
Pindorama, State of São Paulo.
Genotypes F3 F4
NT1,2
NS2
NT1,3
NS3
Progeny 2.77b 2.43c 5.05a 2.39b
Runner IAC 886 4.81a 2.90a 5.21a 2.73a
IAC 503 3.21b 2.88a 4.36a 2.71a
L. 335 2.54b 2.63b 3.73ab 2.58ab
An. 8 1.27c 1.81d 2.24bc 1.60c
V 13751 0.61c 1.39e 1.44c 1.37cd
GKP 10017 0.53c 1.29e 0.96c 1.21d
Mean 2.25 2.19 3.28 2.08
F-test 48.07** 181.79** 145.81** 107.73**
C.V. (%) 7.94 3.83 8.52 6.37
Means followed by different letters, in the same column, are significantly different by Tukey’s test at 5% probability. 1
= data transformed into (x+0.5)1/2 , 2
= mean of 6 evaluations, 3 = mean of 4 evaluations. Runner IAC 886 and IAC 503 = commercial cultivars. L.335 = line of the IAC breeding program. An.8 = amphidiploid (A. magna x A. cardenasii)4x, V = 13751 wild species A. magna. GKP 10017 = wild species A. cardenasii. ** = Significant at 1%, C.V. = coefficient of variation (%).
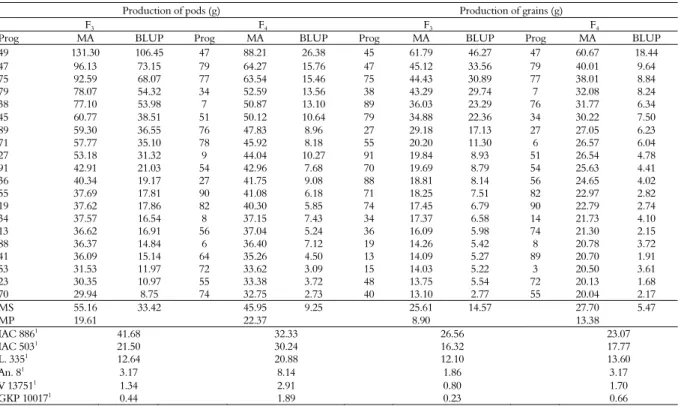
In the combined analysis of variance for the different traits (Table 2), there were significant differences (p < 0.01) in the two generations for most traits, except for visual symptom scores (NS), indicating the influence of generations. Additionally, significant effects were detected (p < 0.01 or p < 0.05) in the progenies for all traits, except for number of pods plant-1, indicating genetic variability in the
segregating populations for most traits.
Considering the interaction (Prog. x Gen.), the traits visual symptom score, pod production, grain production, and percentage of pods with two locules showed significance at 1%. For the number of thrips, significance was 5%, while for the traits number of pods and number of grains per plant, the interaction was not significant (Table 2).
The significance of this interaction indicates that the behavior of the progenies was non-coincident in the evaluated generations, namely, the best progenies in the F3 generation were not necessarily the best in the
F4. Some authors describe the occurrence of this type
of interaction (Lima, Ramalho, & Abreu, 2012). In general, there is little agreement about the best progenies between generations, i.e., both the phenotypic and genotypic values were different between them (Table 3). This was observed for all traits, and these differences in behavior found in the progenies over the generations are possibly due to the interaction ‘generation x progenies’, and the existence of segregation difference between them.
0,0 0,5 1,0 1,5 2,0 2,5 3,0 3,5
0,0 1,0 2,0 3,0 4,0 5,0 6,0 7,0 8,0 9,0 10,0
54 63 79 107
Visua
l sy
mptom
sc
or
e/le
af
le
t
Numbe
r of
thr
ips/ 5 le
af
le
ts
Days after seeding
A. hypogaea L. Segregating progenies
An 8 Wild progenitors
A. hypogaea L. Segregating progenies
Table 2. Summary of analysis of variance for the traits: number of thrips in 5 leaflets (NT), visual symptom score per leaflet (NS), pod
production (PV) (grams plant-1), grain production (PG) (grams plant-1), number of pods per plant (NV), number of grains per plant
(NG), and percentage of pods with two locules per plant (V2). Pindorama, State of São Paulo.
SV DF Mean Square
NT1
NS PV (g)2
PG (g)2
NV2
NG2
V2 3
(%)
Block 3 0.03ns 0.08ns 1.48ns 1.03ns 0.77ns 1.23ns 1.91ns
Test. vs Prog. 1 5.26** 3.79** 27.97** 7.53** 4.22* 3.96* 2838.17**
Generation 1 14.48** 0.09ns 6.34** 20.34** 5.01** 9.79** 1278.00**
Progeny 91 0.13**
0.09**
2.30**
1.69**
1.01ns
1.84*
178.38**
Prog. x Gen. 91 0.09* 0.06** 1.48** 1.20** 0.82ns 1.39ns 73.65**
Controls 5 1.89** 4.19** 23.79** 21.03** 6.04** 17.12** 7528.01**
Residual 39 0.05 0.03 0.73 0.51 0.72 1.08 14.43
Means4
Progeny 3.91 2.41 20.99 11.14 42.86 46.22 39.23
Runner IAC 886 5.01 2.82 37.01 24.82 69.38 76.71 77.37
IAC 503 3.79 2.80 25.87 17.05 43.01 62.67 70.38
L. 335 3.14 2.61 16.76 12.85 39.30 53.43 64.16
An. 8 1.76 1.71 5.66 2.52 22.95 33.39 0.71
V 13751 1.03 1.38 2.13 1.25 18.20 15.06 0.25
GKP 10017 0.75 1.25 1.17 0.45 12.98 8.48 0.08
C.V. (%) 11.13 7.34 25.06 27.56 22.96 23.72 10.47
SV = source of variation, DF = degrees of freedom, CV = coefficient of variation (%). 1 = data transformed into (x+0.5)1/2, 2 = data transformed into Box-Cox, 3 = data transformed into arcsine (%/100)1/2. 4 = raw means *, ** = significant at 5 and 1%, respectively, by F-test F, ns = non-significant by F-test. Runner IAC 886 and IAC 503 = commercial cultivars. L.335 = line of the IAC breeding program. An.8 = amphidiploid (A. magna x A. cardenasii)4x, V 13751 = wild species A. magna. GKP 10017 = wild species A. cardenasii.
Table 3. Phenotypic and genotypic values of the 20 best progenies for the traits number of thrips and visual symptom scores compared to
the behavior of the controls, in the F3 and F4 generations. Pindorama, State of São Paulo.
Number of thrips/5 leaflets Visual symptom score/leaflet
F3 F4 F3 F4
Prog MA BLUP Prog MA BLUP Prog MA BLUP Prog MA BLUP
21 0.75 -1.72 26 1.85 -1.62 80 1.77 -0.59 24 1.59 -0.41
23 0.75 -1.72 39 2.14 -1.45 88 1.77 -0.59 77 1.96 -0.25
57 0.75 -1.70 65 2.64 -1.28 24 1.81 -0.56 65 2.00 -0.17
54 0.92 -1.55 66 2.68 -1.25 67 1.92 -0.45 66 2.01 -0.17
71 1.00 -1.64 32 2.70 -1.11 77 1.93 -0.45 80 2.01 -0.22
64 1.08 -1.41 33 2.72 -1.10 41 1.98 -0.41 64 2.10 -0.12
68 1.16 -1.41 60 2.84 -1.16 46 2.01 -0.38 57 2.11 -0.11
26 1.16 -1.37 37 2.98 -0.95 63 2.02 -0.36 59 2.11 -0.11
28 1.16 -1.37 48 3.03 -1.05 50 2.06 -0.33 16 2.13 -0.13
31 1.16 -1.37 57 3.03 -1.05 70 2.07 -0.32 48 2.14 -0.10
77 1.33 -1.35 44 3.09 -0.88 19 2.10 -0.32 61 2.15 -0.09
5 1.42 -1.14 80 3.09 -1.16 75 2.13 -0.26 46 2.15 -0.12
17 1.42 -1.14 41 3.14 -0.85 35 2.14 -0.26 56 2.16 -0.09
69 1.42 -1.12 83 3.36 -1.00 14 2.17 -0.25 43 2.16 -0.12
81 1.50 -1.20 82 3.61 -0.85 71 2.17 -0.23 5 2.17 -0.11
24 1.50 -1.08 73 3.67 -0.81 74 2.17 -0.23 39 2.17 -0.11
55 1.58 -0.98 77 3.73 -0.78 76 2.17 -0.23 17 2.19 -0.10
56 1.58 -0.98 88 3.73 -0.78 39 2.18 -0.23 63 2.19 -0.07
2 1.59 -0.98 59 3.73 -0.63 61 2.19 -0.21 8 2.20 -0.09
14 1.59 -0.99 90 3.77 -0.75 10 2.20 -0.23 41 2.20 -0.10
MS 1.24 -1.31 3.08 -1.02 2.05 -0.34 2.09 -0.14
MP 2.77 5.05 2.43 2.39
IAC 8861 4.81 5.21 2.90 2.73
IAC 5031 3.21 4.36 2.88 2.71
L. 3351
2.54 3.73 2.63 2.58
An. 81 1.27 2.24 1.81 1.60
V 137511 0.61 1.44 1.39 1.37
GKP 100171 0.53 0.96 1.29 1.21
Prog = progenies selected to calculate the genetic gain; MA = adjusted mean; BLUP = best linear unbiased prediction; MS = mean of the selected progenies; MP = mean of the population; 1 = controls: cultivars Runner IAC 886 and IAC 503, line 335 of the IAC breeding program, amphidiploid An.8 (A. magna x A. cardenasii)4x, wild progenitors V 13751 (A. magna) and GKP 10017 (A. cardenasii).
Regarding the number of insects, for the F3
generation, the mean value of the selected progenies nearly equaled the mean value of the amphidiploid (A. magna x A. cardenasii)4x, though still a 65%
reduction in the occurrence of thrips compared to the genotypes of A. hypogaea L. (Runner IAC 886, IAC 503 and L. 335), especially progenies 21, 23, and 57. For the F4 generation, this reduction was
close to 30%, showing that such progenies may
show resistance similar to that of wild genotypes. (Table 3). As for visual symptom scores, progenies 80 and 88 stood out with the lowest mean (1.77) in the F3 generation and the progeny 24 stood out with a
mean of 1.59 in the F4 generation. The selected
progenies had a 27 and 22% reduction in insect attack compared to the cultivated genotypes of A. hypogaea L. (Table 3).
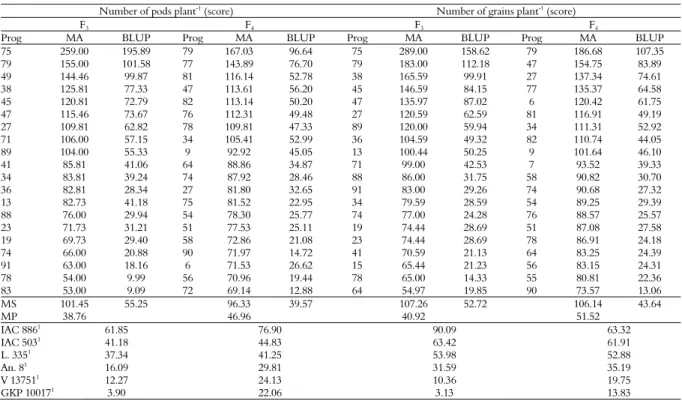
selected progenies exceeded by 118% and 40% the mean production of the A. hypogaea L. genotypes. In the F3 generation, progenies 49 produced 131.30 g
plant-1 of pods and 45 produced 61.79 g plant-1 of
grains. Mean production exceeded by 64% and 53% in the F4 generation, highlighting the progeny 47 that
produced 88.21 g plant-1 of pods and 60.67 g plant-1 of
grains (Table 4).
Considering the number of pods and grains, the progeny 75 stood out with 259.00 pods plant-1 and
239.00 grains plant-1 in the F
3 generation, an increase of
117% and 55%, respectively, compared to the A. hypogaea L. genotypes. In the F4 generation, the progeny
79 stood out with 167.03 pods plant-1 and 186 grains
plant-1 with mean increases of 77% in the number of
pods and 79% in the number of grains per plant (Table 5).
In the commercial species, A. hypogaea L. and, depending on the cultivar, the pods have two or more well-developed seeds. Many wild species have a large number of pods with only a very small seed, representing an important agronomic limitation (Santos et al., 2013). The amphidiploid (A. magna x A. cardenasii)4x used in the cross of this study has these
characteristics and a relatively low number of pods
(Table 6).
Considering that wild species and amphidiploid have mostly unilocular pods (with one grain), this variable is a strong indicator of the level of the genotypes’ agronomic suitability (Santos et al., 2013). The selected progenies obtained mean values close to the A. hypogaea L. genotypes; however, there were reductions of 11 and 14% in the percentage of pods with two locules for these genotypes. It is worth noting that the progeny 49 had 83.24% of its pods filled with two locules in the F3 generation and
the progeny 43 had 80.41% in the F4 generation.
Both had mean values higher than Runner IAC 886, with 79.38 and 75.36% in the respective generations, a cultivar considered to have excellent yield potential (Table 6).
Some segregating progenies that were selected as resistant, in both generations evaluated, that also showed good reproductive traits, but had a low level of agronomic suitability to the A. hypogaea L. genotypes, are as follows: 5, 17, 41, 56, 57, 63, 64, and 77 (Tables 3 to 6). These progenies are of great value because they indicate potential in crossings following the breeding.
Table 4. Phenotypic and genotypic values of the 20 best progenies for the traits production of pods and production of grains per plant
(grams) compared to the behavior of the controls, in the F3 and F4 generations. Pindorama, State of São Paulo.
Production of pods (g) Production of grains (g)
F3 F4 F3 F4
Prog MA BLUP Prog MA BLUP Prog MA BLUP Prog MA BLUP
49 131.30 106.45 47 88.21 26.38 45 61.79 46.27 47 60.67 18.44
47 96.13 73.15 79 64.27 15.76 47 45.12 33.56 79 40.01 9.64
75 92.59 68.07 77 63.54 15.46 75 44.43 30.89 77 38.01 8.84
79 78.07 54.32 34 52.59 13.56 38 43.29 29.74 7 32.08 8.24
38 77.10 53.98 7 50.87 13.10 89 36.03 23.29 76 31.77 6.34
45 60.77 38.51 51 50.12 10.64 79 34.88 22.36 34 30.22 7.50
89 59.30 36.55 76 47.83 8.96 27 29.18 17.13 27 27.05 6.23
71 57.77 35.10 78 45.92 8.18 55 20.20 11.30 6 26.57 6.04
27 53.18 31.32 9 44.04 10.27 91 19.84 8.93 51 26.54 4.78
91 42.91 21.03 54 42.96 7.68 70 19.69 8.79 54 25.63 4.41
36 40.34 19.17 27 41.75 9.08 88 18.81 8.14 56 24.65 4.02
55 37.69 17.81 90 41.08 6.18 71 18.25 7.51 82 22.97 2.82
19 37.62 17.86 82 40.30 5.85 74 17.45 6.79 90 22.79 2.74
34 37.57 16.54 8 37.15 7.43 34 17.37 6.58 14 21.73 4.10
13 36.62 16.91 56 37.04 5.24 36 16.09 5.98 74 21.30 2.15
88 36.37 14.84 6 36.40 7.12 19 14.26 5.42 8 20.78 3.72
41 36.09 15.14 64 35.26 4.50 13 14.09 5.27 89 20.70 1.91
53 31.53 11.97 72 33.62 3.09 15 14.03 5.22 3 20.50 3.61
23 30.35 10.97 55 33.38 3.72 48 13.75 5.54 72 20.13 1.68
70 29.94 8.75 74 32.75 2.73 40 13.10 2.77 55 20.04 2.17
MS 55.16 33.42 45.95 9.25 25.61 14.57 27.70 5.47
MP 19.61 22.37 8.90 13.38
IAC 8861
41.68 32.33 26.56 23.07
IAC 5031 21.50 30.24 16.32 17.77
L. 3351 12.64 20.88 12.10 13.60
An. 81 3.17 8.14 1.86 3.17
V 137511 1.34 2.91 0.80 1.70
GKP 100171 0.44 1.89 0.23 0.66
Prog = progenies selected to calculate the genetic gain; MA = adjusted mean; BLUP = best linear unbiased prediction; MS = mean of the selected progenies; MP = mean of the population; 1
= controls: cultivars Runner IAC 886 and IAC 503, line 335 of the IAC breeding program, amphidiploid An.8 (A. magna x A. cardenasii)4x
Table 5. Phenotypic and genotypic values of the 20 best progenies for the traits number of pods and number of grains per plant (score)
compared to the behavior of the controls, in the F3 and F4 generations. Pindorama, State of São Paulo.
Number of pods plant-1
(score) Number of grains plant-1
(score)
F3 F4 F3 F4
Prog MA BLUP Prog MA BLUP Prog MA BLUP Prog MA BLUP
75 259.00 195.89 79 167.03 96.64 75 289.00 158.62 79 186.68 107.35
79 155.00 101.58 77 143.89 76.70 79 183.00 112.18 47 154.75 83.89
49 144.46 99.87 81 116.14 52.78 38 165.59 99.91 27 137.34 74.61
38 125.81 77.33 47 113.61 56.20 45 146.59 84.15 77 135.37 64.58
45 120.81 72.79 82 113.14 50.20 47 135.97 87.02 6 120.42 61.75
47 115.46 73.67 76 112.31 49.48 27 120.59 62.59 81 116.91 49.19
27 109.81 62.82 78 109.81 47.33 89 120.00 59.94 34 111.31 52.92
71 106.00 57.15 34 105.41 52.99 36 104.59 49.32 82 110.74 44.05
89 104.00 55.33 9 92.92 45.05 13 100.44 50.25 9 101.64 46.10
41 85.81 41.06 64 88.86 34.87 71 99.00 42.53 7 93.52 39.33
34 83.81 39.24 74 87.92 28.46 88 86.00 31.75 58 90.82 30.70
36 82.81 28.34 27 81.80 32.65 91 83.00 29.26 74 90.68 27.32
13 82.73 41.18 75 81.52 22.95 34 79.59 28.59 54 89.25 29.39
88 76.00 29.94 54 78.30 25.77 74 77.00 24.28 76 88.57 25.57
23 71.73 31.21 51 77.53 25.11 19 74.44 28.69 51 87.08 27.58
19 69.73 29.40 58 72.86 21.08 23 74.44 28.69 78 86.91 24.18
74 66.00 20.88 90 71.97 14.72 41 70.59 21.13 64 83.25 24.39
91 63.00 18.16 6 71.53 26.62 15 65.44 21.23 56 83.15 24.31
78 54.00 9.99 56 70.96 19.44 78 65.00 14.33 55 80.81 22.36
83 53.00 9.09 72 69.14 12.88 64 54.97 19.85 90 73.57 13.06
MS 101.45 55.25 96.33 39.57 107.26 52.72 106.14 43.64
MP 38.76 46.96 40.92 51.52
IAC 8861
61.85 76.90 90.09 63.32
IAC 5031 41.18 44.83 63.42 61.91
L. 3351 37.34 41.25 53.98 52.88
An. 81 16.09 29.81 31.59 35.19
V 137511 12.27 24.13 10.36 19.75
GKP 100171
3.90 22.06 3.13 13.83
Prog = progenies selected to calculate the genetic gain; MA = adjusted mean; BLUP = best linear unbiased prediction; MS = mean of the selected progenies; MP = mean of the population; 1
= controls: cultivars Runner IAC 886 and IAC 503, line 335 of the IAC breeding program, amphidiploid An.8 (A. magna x A. cardenasii)4x
, wild progenitors V 13751 (A. magna) and GKP 10017 (A. cardenasii).
Table 6. Phenotypic and genotypic values of the 20 best progenies for the trait percentage of pods with two locules
compared to the behavior of the controls, in the F3 and F4
generations. Pindorama, State of São Paulo.
Percentage of pods with two locules
F3 F4
Prog MA BLUP Prog MA BLUP
49 83.24 46.36 43 80.41 34.64
17 79.79 43.17 49 77.39 31.01
57 73.96 37.26 47 74.83 28.65
55 66.23 29.68 57 65.34 19.92
2 65.64 29.30 3 63.34 19.01
5 64.08 27.77 17 61.52 17.33
47 63.58 27.08 37 61.01 16.79
38 63.19 27.25 72 60.82 17.19
59 62.12 25.65 56 60.44 15.41
18 62.01 25.74 59 59.85 14.87
56 59.57 23.15 55 59.38 14.44
4 59.15 22.93 84 57.38 14.02
32 52.02 23.16 58 57.17 12.40
91 57.14 21.30 5 56.88 13.06
53 56.10 19.74 45 56.73 12.85
54 56.10 19.74 7 56.06 12.31
51 55.21 18.87 1 55.63 11.91
15 54.21 18.38 6 55.47 11.76
63 52.81 16.52 4 55.39 11.69
14 52.01 15.93 18 55.29 11.60
MS 62.28 25.95 61.52 17.04
MP 35.64 42.82
IAC 8861 79.38 75.36
IAC 5031 68.43 72.32
L. 3351 62.12 66.19
An. 81
0.00 1.42
V 137511 0.00 0.49
GKP 100171 0.00 0.16
Prog = progenies selected to calculate the genetic gain; MA = adjusted mean; BLUP = best linear unbiased prediction; MS = mean of the selected progenies; MP = mean of the population; 1 = controls: cultivars Runner IAC 886 and IAC 503, line 335 of the IAC breeding program, amphidiploid An.8 (A. magna x A. cardenasii)4x, wild progenitors
V 13751 (A. magna) and GKP 10017 (A. cardenasii).
In addition, the best phenotypic values coincided with the highest predicted values (BLUP) for all traits in the two generations (Tables 3 to 6), corroborating the results obtained by Michelotto et al. (2015). BLUP is a function of phenotypic values that have the common objective of predicting true genetic values, and it has been used as a selection tool in various crops (Baldissera et al., 2012; Pinheiro et al., 2013; Regitano Neto, Ramos Júnior, Gallo, Freitas, & Azzini, 2013). In peanut crop, BLUP has been used to assist the selection of lines at the early stages of breeding programs (Luz, Santos, Silva Filho, & Mello Filho, 2010) and has helped to identify sources of resistance to aerial fungal diseases and in interspecific accessions and hybrids of the genus Arachis L. (Michelotto et al., 2015).
It can be inferred that, in general, the genetic variance was greater than the environmental variance for most of the traits evaluated in the two generations, except for production of pods and the production of grains in the F4 generation, likely
Table 7. Estimates of genetic parameters of peanut progenies in the F3 and F4 generations. Pindorama, State of São Paulo.
Characteristics Gen Genetic parameters
ߪଶ ߪଶ h2 G.S. (%) I.C.
Number of thrips 5 leaflets-1 F3 1.46 0.23 0.86 -47.50 -47.63 a -47.37
F4 1.25 0.85 0.59 -23.01 -23.23 a -22.79
Visual symptom score leaflet-1 F3 0.08 0.01 0.91 -14.23 -14.29 a -14.24
F4 0.02 0.02 0.52 -6.53 -6.56 a -6.50
Production of pods (g plant-1
) F3 514.25 28.82 0.95 172.23 170.75 a 173.71
F4 98.96 140.49 0.41 43.22 40.77 a 45.66
Production of grains (g plant-1) F3 109.97 13.13 0.89 167.10 166. 08 a 168.12
F4 38.17 57.18 0.40 42.81 41.27 a 44.34
Number of pods plant-1 F3 1488.50 152.99 0.91 147.18 143.79 a 150.57
F4 832.87 133.55 0.86 90.41 87.22 a 93.60
Number of grains plant-1 F3 1454.15 299.46 0.83 134.56 129.90 a 139. 22
F4 1019.75 203.57 0.80 88.00 83.75 a 92.25
% pods with two locules plant-1 F3 364.18 7.18 0.98 73.26 72.48 a 74.04
F4 183.63 15.92 0.92 40.18 39.06 a 41.30
Gen = generation, ߪଶ= genetic variance,ߪଶ = environmental variance, h2= broad-sense heritability, G.S. = gain with selection (%), I.C. = confidence interval.
One of the most useful parameters for breeders is the heritability coefficient (h2). It allows one to predict
for the possibility of a successful selection and reflects the proportion of phenotypic variation that can be inherited (Ramalho et al., 2012). In general, estimates of broad-sense heritability had medium and high magnitude for all the traits through the generations. In F3, they ranged from 98% for the percentage of pods
with two locules to 83% for the number of grains plant -1. In F
4, they ranged from 92% for the percentage of
pods with two locules to 40% for the production of grains per plant (Table 7).
With respect to the infestation of thrips on the F4
peanut (A. hypogaea L.) progenies, Ekvised et al. (2006) obtained a h2 ranging from 0 to 80% in the number of
insects and from 0 to 88% in the symptoms of attack. For the number of pods, Luz et al. (2010) found a h2
ranging from 25.8 to 31.69%. Sikinarum et al. (2007) detected higher h2 values, from 55 to 99% for the same
trait.
There was a reduction in the heritability coefficients from the F3 to the F4 generation (Table 7),
indicating that it is not a constant measure and that several factors can change it, such as, for example, the decrease in genetic variability by increased inbreeding, a characteristic belonging to the genetic structure of populations of perfect autogamous plants such as peanuts and because of the high interaction ‘progenies x generations’ (Ramalho et al., 2012).
Other than the mean performance of the progenies, gains with the selection must be greatly considered in a breeding program. In general, gains were relatively greater in the F3 generation (Table 7),
mainly due to the higher heritability coefficients in this generation.
Importantly, for characteristics related to resistance, it is expected that the gain will decrease because the intention was to reduce the occurrence and the damage caused by the pest insect. In the F3 generation, gains
were -47.50 and -14.23% in the number and symptoms
of thrips, and in the F4 generation, gains were -23.01
and -6.53%. For reproductive traits, the greatest gains in the F3 generation were for the number of pods
(147.18%), number of grains (134.56%) and production of pods (172.23%). In the F4 generation,
the greatest gains for reproductive traits were achieved in the number of grains (88.00%) and number of pods (90.41%) (Table 7).
Along with the genetic gains, selection should also be based on the confidence interval, wherein the lower limits must be taken into consideration (Resende et al., 1995). Analyzing them, it can be observed that these were higher in the F3 generation and showed smaller
amplitudes for most of the evaluated characteristics, except for the number of pods and grains (Table 7). This indicates that selection in this generation enabled higher lower limits and less wide ranges, as well as the greatest genetic gain.
Conclusion
Along the evaluated generations, the segregating progenies selected demonstrated higher resistance to thrips, with the amphidiploid (A. magna x A. cardenasii)4x
as a source of resistance to the insect.
Some segregating progenies selected as resistant, in both generations evaluated, also showed good production traits, but with a low level of agronomic suitability to the A. hypogaea L. genotypes, were as follows: 5, 17, 41, 56, 57, 63, 64, and 77.
Acknowledgements
The authors are indebted to CNPq/Universal (nº 480921/2013-0) for financial support. To CAPES for the scholarship granted to the first author and CNPq for the productivity scholarship to the third author.
References
J. L. M. (2012). Uso do melhor preditor linear não-visado (BLUP) na predição de híbridos em feijão. Bioscience Journal, 28(3), 395-403.
Boiça Júnior, A. L., Chagas Filho, N. R., Godoy, I. J., Lourenção, A. L., & Souza, J. R. (2012). Avaliação de resistência de cultivares de amendoim de hábito rasteiro a
Enneothrips flavens Moulton (Thysanoptera: Thripidae).
Arquivos do Instituto Biológico, 79(1), 33-38.
Box, G. E. P., & Cox, D. R. (1964). An analysis of transformations. Journal of the Royal Statistical Society. Series
B (Methodological),26(2), 211-252.
Companhia Nacional de Abastecimento [CONAB]. (2015).
Levantamento safra de grãos 2015/2016. Retrieved from
http://www.conab.gov.br/
Chagas Filho, N. R., Boiça Júnior, A. L., Godoy, I. J., Lourenção, A. L., & Ribeiro, Z. A. (2008). Resistência de cultivares de amendoim de hábito de crescimento ereto a
Enneothrips flavens Moulton (Thysanoptera: Thripidae).
Arquivos do Instituto Biológico, 75(2), 149-156.
Ekvised, S., Jogloy, S., Akkasaeng, C., Keerati-kasikorn, M., Kesmala, T., Buddhasimma, I., & Patanothai, A. (2006). Heritability and correlation of thrips resistance and agronomic traits in peanut. Asian Journal of Plant Sciences,
5(6), 923-931. doi: 10.3923/ajps.2006.923.931
Fávero, A. P., Godoy, I. J., & Suassuna, T. M. F. (2011). Uso de espécies silvestres no pré-melhoramento do amendoim. In Lopes, M. A., Fávero, A. P., Ferreira, M. A. J. F., Faleiro, F. G., Folle, S. M., & Guimarães, E. P. (Eds.), Pré-melhoramento de plantas: estado da arte e
experiências de sucesso (p. 266-291). Brasília, DF:
Embrapa.
Fávero, A. P., Moraes, S. A., Garcia, A. A. F., Valls, J. F. M., & Vello, N. A. (2009). Characterization of rust, early and late leaf spot resistance in wild and cultivated peanut germplasm. Scientia Agricola, 66(1), 110-117. Fávero, A. P., Simpson, C. E., Valls, J. F. M., & Vello, N.
A. (2006). Study of the evolution of cultivated peanut through crossability studies among Arachis ipäensis, A.
duranensis, and A. hypogaea. Crop Science, 46(4),
1546-1552.
Federer, W. T. (1956). Augmented (hoonuiaku) designs.
Hawaian Planters’ Record, 55(2), 191-208.
Gallo, D., Nakano, O., Silveira Neto, S., Carvalho, R. P. L., Batista, G. C., Berti Filho, E., ... Omoto, C. (2002).
Entomologia Agrícola. Piracicaba, SP: Fundação de
Estudos Agrários Luiz de Queiroz.
Godoy, I. J., Moraes, S. A., Santos, R. C., & Zanotto, M. (2005). Melhoramento do amendoim. In A. Borém (Ed.),
Melhoramento de espécies cultivadas (2a ed., p. 54-95). Viçosa,
MG: UFV.
Henderson, C. R., Kempthorne, O., Searle, S. R., & Krosigk, C. M. V. (1959). The estimation of environmental and genetic trends from records subject to culling. Biometrics,
15(2), 192-218.
Henderson, C. R. (1973). Maximum likelihood estimation of
variance components. Unpublished manuscript. Ithaca, NY:
Department of Animal Science, Cornell University, 14850.
Holbrook, C., & Stalker, T. H. (2003). Peanut breeding and genetic resources. In J. Janick (Ed.), Plant breeding
reviews (v. 22, p. 297-356). Hoboken, NJ: John Wiley
& Sons, Inc.
Janini, J. C., Boiça Júnior, A. L., Godoy, I. J., Michelotto, M. D., & Fávero, A. P. (2010). Avaliação de espécies silvestres e cultivares de amendoim para resistência a
Enneothrips flavens Moulton. Bragantia,69(4), 891-898.
Lima, L. K., Ramalho, M. A. P., & Abreu, A. F. B. (2012). Implications of the progeny x environment interaction in selection index involving characteristics of common bean. Geneticand Molecular Reserch, 11(4), 4093-4099. doi: 10.4238/2012.September.19.5
Luz, L. N., Santos, R. C., Silva Filho, J. L., & Melo Filho, P. A. (2010). Estimativas de parâmetros genéticos em linhagens de amendoim baseadas em descritores associados ao ginóforo. Revista Ciência Agronômica,
41(1), 132-138.
Michelotto, M. D., Godoy, I. J., Fávero, A. P., Carrega, W. C., & Finoto, E. L. (2013). Occurrence of Enneothrips
flavens, Moulton, and Stegasta bosquella, Chambers, and
its effects on agronomic traits of wild Arachis
accessions. Bioscience Journal, 29(1), 115-124.
Michelotto, M. D., Barioni Jr., W., de Resende, M. D. V., Godoy, I. J., Leonardecz, E., & Fávero, A. P. (2015). Identification of fungus resistant wild accessions and interspecific hybrids of the genus Arachis. PLoS ONE,
10(6), 1-17.
Moraes, A. R. A.; Lourenção, A. L.; Godoy, I. J. & Teixeira, G. C. (2005). Infestation by Enneothrips
flavens Moulton and yield of peanut cultivars. Scientia
Agricola, 62(5), 469-472.
Patterson, H. D., & Thompson, R. (1971). Recovery of inter-block information when blocks sizes are unequal. Biometrika,58(3), 545-554.
Perozini, A. C., Silva, P. S., & Goussain, R. C. S. (2014). Resistência ao tripes Enneothrips flavens Moulton (Thysanoptera: Thrpidae) e o potencial produtivo em genótipos de amendoim de hábito de crescimento rasteiro. Vértices, 16(2), 79-92.
Pinheiro, L. C. M., God, P. I. V. G., Faria, V. R., Oliveira, A. G., Hasui, A. A., Pinto, E. H. G., ... Moreira, M. A. (2013). Parentesco na seleção para a produtividade e teores de óleo e proteína em soja via modelos mistos.
Pesquisa Agropecuária Brasileira, 48(9), 1246-1253.
R Development Core Team. (2013). R: A language and
environment for statistical computing. Vienna, AU: R
Foundation for Statistical Computing.
Ramalho, M. A. P., Abreu, A. F. B., Santos, J. B., & Nunes, J. A. R. (2012). Aplicações da genética quantitativa
no melhoramento de plantas autógamas. Lavras, MG:
UFLA.
Regitano Neto, A., Ramos Junior, E. U., Gallo, P. B., Freitas, J. G. & Azzini. (2013). Comportamento de genótipos de arroz de terras altas no estado de São Paulo. Revista Ciência Agronômica, 44(3), 512-519. Resende, M. D. V., Araujo, A. J., Sampaio, P. T. B., &
intervalos de confiança e variância de ganhos genéticos associados a 22 métodos de seleção em Pinus caribaea
var. hondurensis. Revista Floresta, 25(1/2), 3-16. Santos, J. F., Godoy, I. J., Fávero, A. P., Moura, N. F.,
Michelotto, M. D., & Martins, A. L. M. (2011). Resistência à mancha preta em populações F4 selecionadas de cruzamentos entre um amendoim cultivado e um anfidiploide de Arachis. Bragantia,
70(3), 512-518.
Santos, J. F., Godoy, I. J., Michelotto, M. D., & Fávero, A. P. (2013). Resistência à mancha preta e qualidade agronômica de plantas RC1F2 de cruzamentos do híbrido anfidiploide (Arachis ipaënsis x Arachis
duranensis) com o amendoim cultivado (A. hypogaea).
Bioscience Journal, 29(2), 280-287.
Sikinarum, J., Jaisil, P., Jogloy, S., Toomsam, B., Kesmala, T., & Patanothai, A. (2007). Heritability and correlation for nitrogen fixation and related traits in peanut (Arachis hypogaea L.). Pakistan Journal of Biological
Science, 10(12), 1956-1962.
Simpson, C. E. (1991). Pathways for introgression of pest resistance into Arachis hypogaea L. Peanut Science, 18(1), 22-26.
Statistical Analyses System [SAS]. (2011). The SAS System,
release 9.3. Cary, NC: SAS Institute Inc.
Wynne, J. C., & Halward, T. M. (1989). Germplasm enhancement in peanut. In H. T. Stalker, & C. Chapman (Eds.), Science management of germplasm:
Characterization, evaluation and enhancement (p. 155-174).
Rome, IT: International Board for Plant Genetic Resources.
Received on July 18, 2016. Accepted on October 12, 2016.