Genetic variability of hull‑less barley accessions
based on molecular and quantitative data
Ricardo Meneses Sayd(1), Renato Fernando Amabile(2), Fabio Gelape Faleiro(2) and Graciele Bellon(1)
(1)Universidade de Brasília, Faculdade de Agronomia e Medicina Veterinária, Campus Universitário Darcy Ribeiro, CEP 70910‑900 Brasília, DF, Brazil. E‑mail: [email protected], [email protected] (2)Embrapa Cerrados, BR‑020, Km 18, Caixa Postal 08223, CEP 73010‑970 Planaltina, DF, Brazil. E‑mail: [email protected], [email protected]
Abstract ‒ The objective of this work was to characterize and quantify the genetic, molecular, and agronomic variability of hull‑less barley genotypes, for the selection of parents and identification of genotypes adapted to the irrigated production system in the Brazilian Cerrado. Eighteen hull‑less barley accessions were evaluated, and three covered barley accessions served as reference. The characterization was based on 157 RAPD molecular markers and ten agronomic traits. Genetic distance matrices were obtained based on molecular markers and quantitative traits. Graphic grouping and dispersion analyses were performed. Genetic, molecular, and agronomic variability was high among genotypes. Ethiopian accessions were genetically more similar, and the Brazilian ones were genetically more distant. For agronomic traits, two more consistent groupings were obtained, one with the most two‑rowed materials, and the other with six‑rowed materials. The more diverging materials were the two‑rowed CI 13453, CN Cerrado 5, CN Cerrado 1, and CN Cerrado 2. The PI 356466, CN Cerrado 1, PI 370799, and CI 13453 genotypes show agronomic traits of interest and, as genetically different genotypes, they are indicated for crossing, in breeding programs.
Index terms: Hordeum vulgare, genetic diversity, molecular markers, quantitative traits.
Variabilidade genética de acessos de cevada‑nua
com base em dados moleculares e quantitativos
Resumo ‒ O objetivo deste trabalho foi caracterizar e quantificar a variabilidade genética, molecular e agronômica de genótipos de cevada‑nua, para a seleção de genitores e a identificação de genótipos adaptados ao sistema de produção irrigada no bioma Cerrado. Dezoito acessos de cevada‑nua foram avaliados e três acessos de grãos de cevada com casca serviram como referência. A caracterização baseou‑se em 157 marcadores moleculares RAPD e dez características agronômicas. As matrizes de distância genética foram obtidas com base em marcadores moleculares e características quantitativas. Realizaram‑se análises de agrupamento e dispersão gráfica dos acessos. A variabilidade genética, molecular e agronômica foi alta entre os acessos. Os acessos etíopes foram geneticamente mais similares, e os acessos brasileiros, geneticamente mais distantes. Quanto às características agronômicas, obtiveram‑se dois agrupamentos mais consistentes, um com mais materiais dísticos e outro com os hexásticos. Os genótipos mais divergentes foram os dísticos CI 13453, CN Cerrado 5, CN Cerrado 1 e CN Cerrado 2. Os genótipos PI 356466, CN Cerrado 1, PI 370799 e CI 13453 apresentam características agronômicas de interesse e, como são distintos geneticamente, são indicados para cruzamentos em programas de melhoramento genético.
Termos para indexação: Hordeum vulgare, diversidade genética, marcador molecular, caracteres quantitativos.
Introduction
Hull‑less barley [Hordeum vulgare (L.) var. nudum Hook. f.] has been used for various purposes, such as human and animal feed, and for the production of malt and food products. Barley is one of the cereals with the more diversified genetic basis (Baik & Ullrich, 2008). The identification and characterization of accession variability among barley species are essential steps
for a genetic breeding program to obtain promising genotypes which should meet the needs of a production system. Based on this knowledge, quantitative and qualitative gains might be obtained in a more effective way during genotype selection and evaluation through appropriate traits, for use in future parent hybridization (Valls, 2007).
additional information concerning existing variability in working collections (Manjunatha et al., 2007; Shakhatreh et al., 2010; Amabile et al., 2013b). The molecular variability of hull‑less barley was quantified by Yu et al. (2002) and Yang et al. (2010). Later on, the morphological and agronomical characterization of a set of barley accessions was made by Monteiro (2012), who included some “naked barley” (or hull‑less barley) from the germplasm bank kept by Embrapa Recursos Genéticos e Biotecnologia. However, despite the gains obtained in a barley breeding program in the Cerrado biome, little is known about the variability existing in germplasm banks in Brazil (Amabile et al., 2013b).
Barley is generally grown in Brazilian regions with temperate climate, more frequently in the southern part of the country for their cooler temperatures (Caierão et al., 2006). However, the potential use of barley as an alternative to be grown in the irrigated system in the Cerrado has been shown in researches and developments made in the last twenty years by Embrapa Cerrados and its partners. Barley grown in Cerrado has shown a high yield (Amabile et al., 2013a) and good grain classification, lack of post‑harvest dormancy, clean seed, and no fungus (Amabile et al., 2008).
The objective of this work was to characterize and quantify the genetic, molecular and agronomic variability of hull‑less barley genotypes, for the selection of parents and identification of genotypes adapted to the irrigated production system in the Brazilian Cerrado.
Materials and Methods
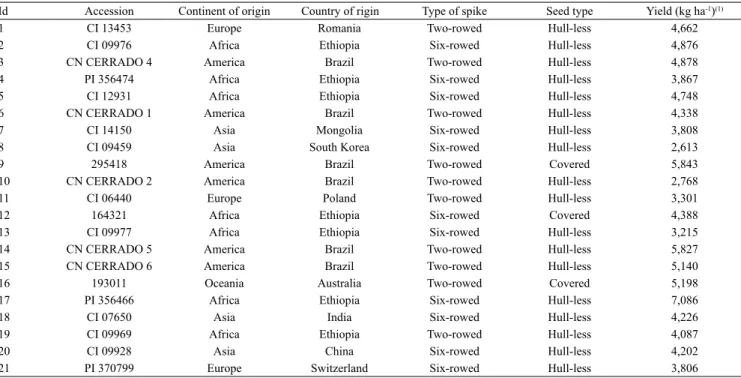
In this study, 18 hull‑less barley accessions with two and six rows, and three covered malt barley accessions from Africa, America, Asia, Europe and Oceania from the germplasm bank kept by Embrapa Recursos Genéticos e Biotecnologia (Table 1) were selected because of the number of viable seed and germination greater than 85%.
The molecular diversity analysis was performed at the Laboratório de Genética e Biologia Molecular of Embrapa Cerrados. Leaves of two plants from each accession were collected to extract the genomic DNA by the CTAB method according to Molinari & Crochemore (2001). Fresh plant tissue was macerated with a glass bar. Following this step, a buffer containing
100 µmol L‑1 Tris‑HCl (pH 8.3), CTAB (7%), 20 mmol L‑1 EDTA and 1.4 mol L‑1 NaCl was added to each sample. The samples were then incubated at 65°C for 30 min in a water bath.
Deproteinization was performed for each sample by using 400 µL of a chloroform solution (isoamyl alcohol 24:1) resulting in an emulsion by vigorous shaking. The samples were then centrifuged at 16,060 g for 5 min, and approximately 200 µL of the supernatant were removed and placed in new 2 microliter‑microtubes. Two hundred microliters of isopropanol (5°C) were added to the supernatant to carry out the DNA precipitation. The tubes were lightly agitated, then subjected to ‑20°C for 30 min, and centrifuged at 16,060 g for 10 min. The supernatant was removed and pellet was washed twice with 200 µL of 70% ethanol and dried at room temperature. Pellet was re‑suspended in 100 µL of Milli‑Q water, containing 40 µL mL‑1 of RNAse. DNA amount was calculated using a spectrophotometer at 260 nm (A260) and a ratio of A260/A280, in order to evaluate its purity and quality (Sambrook et al., 1989).
Samples of each DNA accession were amplified to obtain RAPD markers. Amplifications were performed in a 13 µL total volume containing Tris‑HCl 10 mmol L‑1 (pH 8.3), KCl 50 mmol L‑1, MgCl
2 3 mmol L‑1, 100 µmol L‑1 of each deoxyribonucleotide (dATP, dTTP, dGTP, and dCTP), 0.4 µmol L‑1 of a primer (Operon Technologies Inc., Alameda, CA, USA), a unit of Taq polymerase, and approximately 15 ng of DNA. The following primers were used: OPD03, OPD04, OPD08, OPE18, OPE20, OPF01, OPF17, OPF20, OPG01, OPG05, OPH14, OPH16, OPH17, and OPH20.
Amplifications were performed in a thermocycler programmed for 40 cycles, following the sequence: 15 s at 94ºC, 30 s at 35ºC, and 90 s at 72ºC. After 40 cycles, a final extension that lasted 6 min at 72ºC was made and, then, temperature was decreased to 4ºC. Afterwards, 3 µL of a combination of bromophenol blue (0.25%) and glycerol (60%) in water was added to each sample. Samples were loaded in agarose gel (1.2%), stained with ethidium bromide and embedded in a TBE buffer (90 mmol L‑1 Tris‑Borato, 1 mmol L‑1 EDTA). Electrophoretic separation was performed for about 4 hours at 90 volts. At the end of the run, gels were photographed under ultraviolet light.
coefficient of similarity according to Nei & Li (1979) using the Genes software (Cruz, 2007).
The genetic similarity (GS) was calculated using Sgij = 2Nij/(Ni + Nj), in which: Nij is the number of bands present in both i and j genotypes; and Ni and Nj are the numbers of bands in i and j genotypes, respectively. Additionally, genetic dissimilarity was calculated subtracting GS of the unit (1 ‑ GS).
Through a dendrogram, the genetic distance matrix was used to perform a cluster analysis, using UPGMA (unweightedpair‑group method with arithmetic mean) for the cluster criteria (Sneath & Sokal, 1973), and the softwares SAS version 9.2 (SAS Institute, Cary, NC, USA) and Statistica (Statsoft, Tulsa, USA). Additionally, a dispersion plot was generated based on the principal coordinates method, and the accession stratification was performed based on spike type, continent, and country of origin.
The cophenetic correlation coefficient (r) was calculated to estimate the adjustment between the original genetic distances of the dissimilarity matrix and the graphic representation shown in the dendrogram, according to Sokal & Rohlf (1962),
using the software NTSYS PC 2.1 (Rohlf, 2000). Trait relative contribution concerning genetic diversity was measured using Singh’s method (Singh, 1981) and the Genes software (Cruz, 2007).
In order to evaluate agronomic traits, field experiments were carried out under irrigation via central pivot, in two different sites, from May to September 2012. The first site was the experimental field of Embrapa Cerrados, Planaltina, DF, at 15°35'30"S, 47°42'30"W, at 1,007 m altitude, using a Latossolo Vermelho distroférrico (Rhodic Haplustox), clay texture (Santos et al., 2013). The second site was the experimental field of Embrapa Produtos e Mercado, in Recanto das Emas, DF, at 15°54'53"S, 48°02'14"W, 1,254 m altitude, in a Latossolo Vermelho distroférrico típico (Rhodic Haplustox), clay texture (Santos et al., 2013).
Soil analysis results at Embrapa Cerrados, for a 10‑20 cm profile, were the following: Al, 0.20 mmolc dm‑3; H+Al, 15.4 mmolc dm‑3; Ca, 71.5 mmolc dm‑3; Mg, 14.2 mmolc dm‑3; P, 50.95 mg dm‑3; K, 140.0 mg dm‑3; and pH (water), 6.85. At Embrapa Produtos e Mercado, for a 10‒20 cm profile, the results
Table 1. Barley accessions and their respective continent and countries of origin, type of spike, seed type, and mean estimated
grain yield.
Id Accession Continent of origin Country of rigin Type of spike Seed type Yield (kg ha‑1)(1)
1 CI 13453 Europe Romania Two‑rowed Hull‑less 4,662
2 CI 09976 Africa Ethiopia Six‑rowed Hull‑less 4,876
3 CN CERRADO 4 America Brazil Two‑rowed Hull‑less 4,878
4 PI 356474 Africa Ethiopia Six‑rowed Hull‑less 3,867
5 CI 12931 Africa Ethiopia Six‑rowed Hull‑less 4,748
6 CN CERRADO 1 America Brazil Two‑rowed Hull‑less 4,338
7 CI 14150 Asia Mongolia Six‑rowed Hull‑less 3,808
8 CI 09459 Asia South Korea Six‑rowed Hull‑less 2,613
9 295418 America Brazil Two‑rowed Covered 5,843
10 CN CERRADO 2 America Brazil Two‑rowed Hull‑less 2,768
11 CI 06440 Europe Poland Two‑rowed Hull‑less 3,301
12 164321 Africa Ethiopia Six‑rowed Covered 4,388
13 CI 09977 Africa Ethiopia Six‑rowed Hull‑less 3,215
14 CN CERRADO 5 America Brazil Two‑rowed Hull‑less 5,827
15 CN CERRADO 6 America Brazil Two‑rowed Hull‑less 5,140
16 193011 Oceania Australia Two‑rowed Covered 5,198
17 PI 356466 Africa Ethiopia Six‑rowed Hull‑less 7,086
18 CI 07650 Asia India Six‑rowed Hull‑less 4,226
19 CI 09969 Africa Ethiopia Two‑rowed Hull‑less 4,087
20 CI 09928 Asia China Six‑rowed Hull‑less 4,202
21 PI 370799 Europe Switzerland Six‑rowed Hull‑less 3,806
were: Al, 0.10 mmolc dm‑3; H+Al, 30.6 mmolc dm‑3; Ca, 70.0 mmolc dm‑3; Mg, 15.8 mmolc dm‑3; P, 26.44 mg dm‑3; K, 70.0 mg dm‑3; and pH (water), 6.83.
A experimental randomized block design with three replicates was carried out, with a five‑meter long plot, with six lines and 20 cm spacing, and a 4.8 m2 useful area for each spot with a 300 plants m‑2 density.
The evaluated quantitative traits for the agronomic diversity study were: estimated grain yield (kg ha‑1); commercial classification (%) of first (class 1), second (class 2), and third (class 3) grain classes according to Brasil (1996); thousand seed weight (g) (Regras para análise de sementes, 2009); plant height (cm); lodging (zero value for minimum or inexistent lodging, and 100 value for maximum lodging); earing cycle (for visible silking emergence up to 50% spikes in the useful area of the parcel) in days; HP, hectoliter grain weight (kg hL‑1) (Regras para análise de sementes, 2009); and protein total content (%), using Kjeldahl´s method (Yasuhara & Nokihara, 2001).
Genetic distances among all accession pairs were estimated using the generalized Mahalanobis distance, defined as: D = (Xi-Xj)' E (Xi-Xj),ij
2 -1 in which: Xi and Xj
are the mean vectors associated to i and j accessions, respectively; and E‑1 is the covariance matrix of the residuals obtained in the multivariate analysis of variance (Bakke et al., 2008). Cluster analyses were made based on a genetic distance matrix through a dendogram, using the hierarchical clustering methods and UPGMA as group criteria (Sneath & Sokal, 1973). The dispersion plot was generated by multidimensional scales with the principal coordinates using the SAS (SAS Institute, Cary, NC, USA) and Statistica (Statsoft, Tulsa, USA) softwares.
Results and Discussion
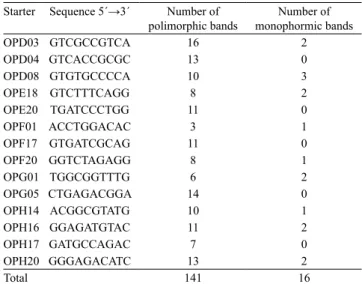
After amplifying the DNA samples of hull‑less and covered barley grain, 157 RAPD markers were obtained, for which 141 (89%) were polymorphic (Table 2). Starters OPD03, OPD04, OPG05, and OPH20 resulted in the greatest amount of polymorphic bands, while OPD08 resulted in the largest number of monomorphic bands (3).
The studied accessions showed a high genetic variability, due to the high percentage of polymorphic bands. Such variability was expected because barley is a cereal that shows one of the most diversified
genetic basis (Baik & Ullrich, 2008). Furthermore, the accessions used in the present study came from different countries and regions around the world. Other studies identified a wide molecular genetic variability in barley accessions (Kochieva et al., 2001; Yu et al., 2002; Hou et al., 2005; Abdellaoui et al., 2007; Karim et al., 2009; Moragues et al., 2010; Yang et al., 2010; Amabile et al., 2014). This reported high genetic variability is important for improving programs, as they enable selection of contrasting parents to originate effective crossing blocks and hybridizations, in order to increase the possibility of success and decrease the time to collect elite cultivars.
Genetic distances among accessions based on molecular markers ranged from 0.131 to 0.484, with an amplitude of 0.353, which is greater than the one observed by Amabile et al. (2014) for barley elite genotypes tested at an irrigated area of Cerrado. The lowest distance was found between accessions CI 09928, from China, and PI 370799 (0.131), from Switzerland, both six‑rowed cultivars. Accessions that similarly showed to be genetically closer were the Ethiopians six‑rowed PI 356474 and CI 12931 (distance = 0.135). The most contrasting genotypes were the two‑rowed Romanian CI 13453 and six‑rowed Indian CI 07650. Accession CI 13453 was the most divergent in relation to the others (mean distance = 0.382).
When studying the clustering through UPGMA, the dendogram resulted in a good representation of
Table 2. Starters used to obtain RAPD markers of barley
genotypes and their respective number of polymorphic and monomorphic bands.
Starter Sequence 5´→3´ Number of
polimorphic bands monophormic bandsNumber of
OPD03 GTCGCCGTCA 16 2
OPD04 GTCACCGCGC 13 0
OPD08 GTGTGCCCCA 10 3
OPE18 GTCTTTCAGG 8 2
OPE20 TGATCCCTGG 11 0
OPF01 ACCTGGACAC 3 1
OPF17 GTGATCGCAG 11 0
OPF20 GGTCTAGAGG 8 1
OPG01 TGGCGGTTTG 6 2
OPG05 CTGAGACGGA 14 0
OPH14 ACGGCGTATG 10 1
OPH16 GGAGATGTAC 11 2
OPH17 GATGCCAGAC 7 0
OPH20 GGGAGACATC 13 2
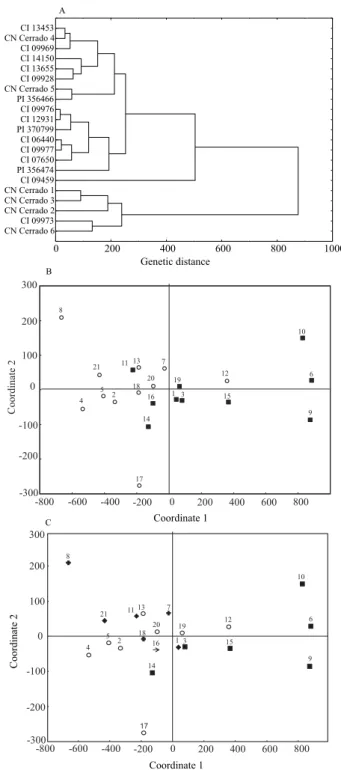
genetic distances shown in the original matrix, whose cophenetic correlation coefficient was 0.83, which is considered high and significant at 1% (r = 0.70). When the considered cutoff point was the mean distance of genotypes (0.280), three similar groups were found (Figure 1 A). The first group was composed by only one accession (CI 13453). However, most of the genotypes were assigned to the second group, and some subgroups were also identified. Six‑rowed accessions PI 356474 and CI 12931 from Ethiopia, along with the six‑rowed Mongolian CI 14150, showed to be the closest ones. Other six‑rowed genotypes in the second group (CI 09928 from China, PI 370799 from Switzerland, PI 356466 from Ethiopia, and CI 09969 from India) were assigned to a subgroup.
No clustering was found between hull‑less and covered accessions because one of the three genotypes was significantly distant compared to the others. According to Taketa et al. (2004) the trait “hull‑less” is controlled by a single recessive locus in relation to the trait “covered”. Therefore, this difference in points was not so significant compared to other differences among the accessions, since the analysis that use RAPD markers is made with the polymorphisms obtained in all genome.
The third group was composed of four genotypes, three of which are the two‑rowed materials – CN Cerrado 5 and CN Cerrado 6 from Brazil, and the Australian witness 193011 –, and one is the six‑rowed CI 09977 from Ethiopia, which was more similar to CN Cerrado 5 (Figure 1 A).
In the dispersion plot, six‑rowed accessions are found more in the center of the plot, mainly the accessions CI 09928, PI370799, 164321, CI 07650, and PI 356466. In a comparison among two‑rowed accessions, only CI 06640 and CN Cerrado 2 clustered, while the other ones were located more commonly in the borders of the dispersion plot (Figure 1 B).
In the dispersion of genotypes concerning the continent of origin (Figure 1 C), a wider distribution was observed for South American accessions, with genotypes located in the four quadrants of the plot.
The most contrasting accessions for variability, based on agronomic traits, were the six‑rowed CI 09459, from South Korea, and the two‑rowed Brazilian covered grain 295418, whose distance (D2) was 1,900.1. The most similar genotypes for agronomic traits (D2 = 16.5) were the six‑rowed Ethiopian
CI 09976 and CI 12931. Similarly, the accession pairs two‑rowed CI 06440 (Polish) and six‑rowed CI 09977
Figure 1. Grouping analysis (A) and dispersion plots for
18 hull‑less and three covered barley accessions, based on molecular genetic dissimilarities of 157 RAPD markers. Grouping by type of spike (B): (n) two‑rowed spikes, and (¢) six‑rowed spikes. Genetic material grouping by continent of origin (C): (n) America; (¢) Africa; ( ) Asia;
(Ethiopian), and two‑rowed CI 13453 (Romanian) and CN Cerrado 4 (Brazilian) showed low estimates of distance, for which D2 were 21.0 and 33.9, respectively. The wide amplitude between genotypes is an evidence of the great variability in a collection of hull‑less barley used in the present study, a fundamental factor for genetic improvement. Manjunatha et al. (2007) and Shakhatreh et al. (2010) have found a high variability among covered barley collections, which are superior to the material studied by Eshghi & Akhundova (2010) and Yang et al. (2010).
Covered grain 295418 (average D2 = 942.7) showed the greatest agronomic distance and a greater distance compared to the others. This fact can be explained by the differences in the classification of the grain size (class 1, 82.7% and 84.0%; class 2, 14.3% and 10.7%; class 3, 3.0% and 5.3%). The genotype with the smallest mean agronomic distance in relation to other accessions was CI 09928 from China (D2 = 274.6). This information is important for the improvement of hull‑less barley, as it may predict better hybrid combinations between future parents, enabling to choose accessions which shows a high adjustment, although they have more agronomic dissimilarities, so that the traits of interest might be combined in a single accession (Franco et al., 2001). However, genetic gains that could be obtained from barley using genetically close parents should not be ignored (Fasoula & Boerma, 2005). Therefore, when evaluating genetic distances to obtain lineages, the agronomic performance of each accession should also be taken into consideration.
As for the importance of each agronomic trait in genetic diversity, class 1 size was the most contributing trait 64.93% variability, followed by class 3 (9.66%), class 2 (9.65%), and the estimated grain yield (8.41%). Traits such as thousand seed weight (3.57%), protein (1.63%), cycle (0.78%), height (0.70%), lodging degree (0.38%) and hectoliter grain weight (0.24%) showed little contribution concerning variability. These results were different from the outcomes reported by Amabile et al. (2013b), who found a contribution of 11.15%, for cycle, and 1.53%, for class 1.
In the dendrogram (Figure 2 A), the genotypes were assigned to three groups concerning their agronomic traits, as the cutoff point (dgE = 479.5) determined by the mean distances. In the first group, two subgroups were found, nominated as subgroup A and subgroup B. Subgroup A included accessions from five continents
(5 two‑rowed and 3 six‑rowed materials); CN Cerrado 5 and PI 356466, with a high grain yield, were also
Figure 2. Grouping analysis (A) and dispersion plot of
18 hull‑less and 3 covered barley accessions, based on agronomic genetic dissimilarities. Grouping based on type of spike (B): (■) two‑rowed spikes, and (¢) six‑rowed spikes. Grouping of genetic materials by continent of origin (C): (n) America; (¢) Africa; ( ) Asia; (è) Oceania, and
assigned to this subgroup (Table 1). Subgroup B was mostly composed of African and European genotypes, except for CI 07650 (Chinese). Such accessions showed close values for class 1, class 2 and class 3, besides showing high values of lodging.
Based on agronomic traits, the second group was only composed by a South Korean six‑rowed accession CI 09459 which showed the lowest values of grain yield, in both experimental fields (Table 1), and low protein contents (15.8% and 13.8%). The third group was essentially characterized by Brazilian genotypes (CN Cerrado 1, 2, 6, and witness 295418), except for the Ethiopian 164321. Five genotypes that constitute this group are different because of the high values for class 1. High values of protein shown in three of five genotypes is another fact that has influenced the clustering. As for the accession dispersion, stratified according to the two and six‑rowed spikes (Figure 2 B), two different groups of genotypes were found. The two‑rowed materials located on the left side of the plot showing greater distances, and the six‑rowed barley genotypes located on the right side and which were more grouped. Amabile et al. (2013b) found the same type of grouping.
In the analysis for stratified accessions by continent of origin, Asian genotypes are observed as grouping in the center of the plot, except for genotype CI 09459 which was characterized as a low‑grain yield genotype. Africans CI 09976, CI 12931, and PI 356474 were very close to each other; and the South American genotypes were dispersed among themselves (Figure 2 C). Vieira et al. (2005) has also observed that there was no grouping of genotypes from the same origin based on agronomic traits. That might be explained by the wide variability related to complex agronomic traits, in accessions from the same origin, provided by the expression of a great number of genes under high environmental effect.
Conclusions
1. There is a high genetic variability based on molecular and agronomic traits among hull‑less barley accessions.
2. Barley accessions from Ethiopia are more similar, and Brazilian accessions are more genetically distant.
3. Two and six‑rowed hull‑less barley accessions show divergent agronomic traits.
4. Genotypes PI 356466, CN Cerrado 1, PI 370799, CI 09928 and CI 13453 show a high grain yield and, as genetically different genotypes, they are indicated for crossing in breeding programs.
Agradecimentos
À Coordenação de Aperfeiçoamento de Pessoal de Nível Superior (Capes), pela concessão de bolsa.
References
ABDELLAOUI, R.; M´HAMED, H.C.; NACEUR, M’B.B.; BETTAIEB‑KAAB, L.; HAMIDA, J.B. Morpho‑physiological and molecular characterization of some Tunisian barley ecotypes.
Asian Journal of Plant Sciences, v.6, p.261‑268, 2007. DOI:
10.3923/ajps.2007.261.268.
AMABILE, R.F.; CAPETTINI, F.; FALEIRO, F.G. BRS Savanna: new six‑rowed malting barley cultivar for irrigated crops in the Brazilian savanna. Crop Breeding and Applied Biotechnology,
v.13, p.160‑163, 2013a. DOI: 10.1590/S1984‑70332013000200010. AMABILE, R.F.; FALEIRO, F.G.; CAPETTINI, F.; RIBEIRO JúNIOR, W.Q.; PEIXOTO, J.R.; ALMEIDA, B.C. de. Genetic variability of elite barley genotypes for Brazilian savanna irrigated systems based on RAPD markers. Bioscience Journal, v.30,
p.1118‑1126, 2014.
AMABILE, R.F.; FALEIRO, F.G.; VIEIRA, E.A.; PEIXOTO, J.R.; CAPETTINI, F.; RIBEIRO JúNIOR, W.Q. Genetic diversity of irrigated barley based on molecular and quantitative data and on malting quality. Pesquisa Agropecuária Brasileira, v.48,
p.748‑756, 2013b. DOI: 10.1590/S0100‑204X2013000700007. AMABILE, R.F.; MINELLA, E.; GUERRA, A.F.; SILVA, D.B. da; ALBRECHT, J.C.; ANTONIAZZI, N. BRS Deméter: nova cultivar de cevada cervejeira irrigada para o Cerrado do Brasil Central.
Pesquisa Agropecuária Brasileira, v.43, p.1247‑1249, 2008.
DOI: 10.1590/S0100‑204X2008000900020.
BAIK, B.‑K.; ULLRICH, S.E. Barley for food: characteristics, improvement, and renewed interest. Journal of Cereal Science,
v.48, p.233‑242, 2008. DOI: 10.1016/j.jcs.2008.02.002.
BAKKE, H.A.; LEITE, A.S. de M.; SILVA, L.B. da. Estatística multivariada: aplicação da análise fatorial na engenharia de produção. Revista Gestão Industrial, v.4, p.1‑14, 2008. DOI:
10.3895/gi.v4i4.188. .
BRASIL. Ministério da Agricultura e Abastecimento. Portaria nº 691, de 22 de novembro de 1996. Define as características de identidade e qualidade da cevada para fins cervejeiros. Diário
Oficial [da] República Federativa do Brasil, 25 nov. 1996.
CAIERÃO, E; MINELLA, E.; ANTONIAZZI, N. MN 716: nova cultivar de cevada com estabilidade de produção e qualidade cervejeira. Pesquisa Agropecuária Brasileira, v.41, p.1063‑1065,
2006. DOI: 10.1590/S0100‑204X2006000600025.
CRUZ, C.D. Programa Genes: aplicativo computacional em
ESHGHI, R.; AKHUNDOVA, E. Inheritance of some important agronomic traits in hull‑less barley. International Journal of
Agriculture and Biology, v.1, p.73‑76, 2010.
FASOULA, V.A.; BOERMA, H.R. Divergent selection at ultra‑low plant density for seed protein and oil content within soybean cultivars. Field Crops Research, v.91, p.217‑229, 2005. DOI:
10.1016/j.fcr.2004.07.018.
FRANCO, M.C.; CASSINI, S.T.A.; OLIVEIRA, V.R.; TSAI, S.M. Caracterização da diversidade genética em feijão por meio de marcadores RAPD. Pesquisa Agropecuária Brasileira, v.36,
p.381‑385, 2001. DOI: 10.1590/S0100‑204X2001000200023. HOU, Y.‑C.; YAN, Z.‑H.; WEI, Y.‑M.; ZHENG, Y.‑L. Genetic diversity in barley from West China based on RAPD and ISSR analysis. Barley Genetics Newsletter, v.35, p.9‑22, 2005.
KARIM, K.; RAWDA, A.; HATEM, C.‑M. Genetic diversity in barley genetic diversity in local Tunisian barley based on RAPD and SSR analysis. Biological Diversity and Conservation, v.2/1,
p.27‑35, 2009.
KOCHIEVA, E.Z.; GORIUNOVA, S.V.; POMORTSEV, A.A. RAPD‑marking of genomes of representative Hordeum species.
Genetika, v.8, p.1088‑1094, 2001.
MANJUNATHA, T.; BISHT, I.S.; BHAT, K.V.; SINGH, B.P. Genetic diversity in barley (Hordeum vulgare L. ssp. vulgare)
landraces from Uttaranchal Himalaya of India. Genetic Resources
and Crop Evolution, v.54, p.55‑65, 2007. DOI: 10.1007/
s10722‑005‑1884‑6.
MOLINARI, H.B.; CROCHEMORE, M.L. Extração de DNA genômico de Passiflora spp. para análises PCR‑RAPD. Revista
Brasileira de Fruticultura, v.23, p.447‑450, 2001. DOI: 10.1590/
S0100‑29452001000200051.
MONTEIRO, V.A. Diversidade genética de acessos de cevada sob sistema de produção irrigado no Cerrado do planalto central
brasileiro. 2012. 136p. Dissertação (Mestrado) – Universidade de
Brasília, Brasília.
MORAGUES, M.; COMADRAN, J.; WAUGH, R.; MILNE, I.; FLAVELL, A.J.; RUSSELL, J.R. Effects of ascertainment bias and marker number on estimations of barley diversity from high‑throughput SNP genotype data. Theoretical and
Applied Genetics, v.120, p.1525‑1534, 2010. DOI: 10.1007/
s00122‑010‑1273‑1.
NEI, M.; LI, W.H. Mathematical model for studying genetic variation in terms of restriction endonucleases. Proceedings of the
National Academy of Science of The United States of America,
v.76, p.5269‑5273, 1979. DOI: 10.1073/pnas.76.10.5269. REGRAS para análise de sementes. Brasília: Ministério da Agricultura, Pecuária e Abastecimento, 2009. 395p.
ROHLF, F.J. NTSYS‑pc: numerical taxonomy and multivariate
analysis system. Version 2.1. New York: Exeter Software, 2000. 98p. SAMBROOK, J.; FRITSCH, E.F.; MANIATS, T. Molecular
cloning: a laboratory manual. 2nd ed. New York: Cold Spring
Harbor, 1989. 653p.
SANTOS, H.G. dos; JACOMINE, P.K.T.; ANJOS, L.H.C. dos; OLIVEIRA, V.A. de; LUMBRERAS, J.F.; COELHO, M.R.; ALMEIDA, J.A. de; CUNHA, T.J.F.; OLIVEIRA, J.B. de. Sistema
brasileiro de classificação de solos. 3.ed. rev. ampl. Brasília: Embrapa, 2013. 353p.
SHAKHATREH, Y.; HADDAD, N.; ALRABABAH, M.; GRANDO, S.; CECCARELLI, S. Phenotypic diversity in wild barley [Hordeum vulgare L. ssp. spontaneum (C. Koch)
Thell.] accessions collected in Jordan. Genetic Resources
and Crop Evolution, v.57, p.131‑146, 2010. DOI: 10.1007/
s10722‑009‑9457‑8.
SINGH, D. The relative importance of characters affecting genetic diversity. Indian Journal of Genetics and Plant Breeding, v.41,
p.237‑245, 1981.
SNEATH, P.H.A.; SOKAL, R.R. Numerical taxonomy: the
principles and practice of numerical classification. San Francisco: W. H. Freeman, 1973. 573p.
SOKAL, R.R.; ROHLF, F.J. The comparison of dendrograms by objective methods. Taxonomy, v.11, p.30‑40, 1962. DOI:
10.2307/1217208.
TAKETA, S.; KIKUCHI, S.; AWAYAMA, T.; YAMAMOTO, S.; ICHII, M.; KAWASAKI, S. Monophyletic origin of naked barley inferred from molecular analyses of a marker closely linked to the naked caryopsis gene (nud). Theoretical and
Applied Genetics, v.108, p.1236‑1242, 2004. DOI: 10.1007/
s00122‑003‑1560‑1.
VALLS, J.F.M. Caracterização de recursos genéticos vegetais. In: NASS, L.L. (Ed.). Recursos genéticos vegetais. Brasília: Embrapa
Recursos Genéticos e Biotecnologia, 2007. p.281‑305.
VIEIRA, E.A.; CARVALHO, F.I.F. de; OLIVEIRA, A.C. de; BENIN, G.; ZIMMER, P.D.; SILVA, J.D.G. da; MARTINS, A.F.; BERTAN, I.; SILVA, G.O. da; SCHMIDT, D.A.M. Comparação entre medidas de distância genealógica, morfológica e molecular em aveia em experimentos com e sem a aplicação de fungicida. Bragantia, v.64, p.51‑60, 2005. DOI: 10.1590/
S0006‑87052005000100006.
YANG, P.; LIU, X.J.; LIU, X.C.; YANG, W.Y.; FENG, Z.Y. Diversity analysis of the developed qingke (hull‑less barley) cultivars representing different growing regions of the Qinghai‑Tibet Plateau in China using sequence‑related amplified polymorphism (SRAP) markers. African Journal of Biotechnology, v.9, p.8530‑8538,
2010.
YASUHARA, T.; NOKIHARA, K. High‑throughput analysis of total nitrogen content that replaces the classic Kjeldahl method.
Journal of Agricultural and Food Chemistry, v.49, p.4581‑4583,
2001. DOI: 10.1021/jf010448z.
YU, Z.; LI‑QIONG, L.; HUAN, L.; JIE, B.; MAN‑YE, Y.; CHEN, M.; YING‑FAN, C.; XIAO‑LIN, Q.; FANG, C. RAPD markers in diversity detection and variety identification of Tibetan hull‑less barley. Plant Molecular Biology Report, v.20, p.369‑377, 2002.
DOI: 10.1007/BF02772124.