Rev Bras
Cineantropom
Hum
DOI: http://dx.doi.org/10.5007/1980-0037.2018v20n4p543
review article
Community and environment for physical
activity among young people: a systematic
review of the Report Card Brazil 2018
Ambiente comunitário para atividade física de jovens:
uma revisão sistemática do Report Card Brasil 2018
Sofia Wolker Manta1 Kelly Samara da Silva1 Giseli Minatto1
Marcus Vinicius Veber Lopes1 Gabrielli Thais de Mello1 Valter Cordeiro Barbosa Filho2
Abstract – The aim of this study was to identify evidence about the prevalence of the community and environment indicators related to physical activity (PA) among young Brazilian people. A systematic review was carried out using eight databases (PubMed, Scopus, Web of Science, LILACS, SPORTDiscus, BIREME, Scielo, and Google Scholar) with descriptors in Portuguese and English. Community and environment Indicators included access, presence, proximity, quality, safety and pollution of/in spaces, facilities, programs available for PA among young people (up to 18 years-old), which may be meas-ured subjectively and/or objectively. A total of 23 documents were included, representing 15 different studies. There were more studies in the South region (n=8), followed by the Northeast (n=3) and Southeast (n=3). Self-reported instruments were more frequently used (n=15). The studies reported prevalence of perception (positive and/or barrier) for access to facilities, programs and/or parks (n=13); presence of sidewalks and bicycle lanes (n=4); proximity to residence (n=5); quality (n=5); safety from crime and traffic (n=14) and pollution (n=6); number of spaces and/or facilities around the residence (n=1); and observation of adolescents using public spaces for PA (n=3). The prevalence rates showed high variability according to environmental indicator. No studies are available for the North and Midwest of the country. Distinct environmental measures were used in self-reported studies, impairing data comparability. To date, no studies have been identified that provide information about the prevalence of combined environmental measures (perceived and objective).
Key words: Adolescent; Built environment; Brazil; Motor activity.
Resumo – Objetivou-se identificar evidências das prevalências de indicadores do ambiente comunitário relacionado a atividade física (AF) de jovens brasileiros. A revisão sistemática utilizou-se de oito bases de dados (PubMed, Scopus, Web of Science, LILACS, SPORTDiscus, BIREME, Scielo, and Google Scholar), com descritores em Português e Inglês. As variáveis de ambiente e comunidade incluem acesso, presença, proximidade, qualidade, segurança e poluição de/ em espaços, estruturas, programas disponíveis para AF. Foram extraídos os dados de prevalência de jovens (maiores de 18 anos), que podem ser medidos subjetivamente e/ou objetivamente. No total, 23 documentos foram incluídos (n=2; relatórios nacionais), sendo 15 estudos diferentes. Houve mais estudos na região Sul (n=8), seguido do Nordeste (n=3) e Sudeste (n=3). O uso de instrumento auto relatado foi mais utilizado (n=15). Os estudos reportaram prevalências de percepção (positiva e/ou barreira) para acesso a estruturas, programas e/ou parques (n=13); presença de calçadas e ciclovias (n=4); proximidade com a residência (n=5); qualidade (n=5); segurança para crimes e trânsito (n=14) e poluição (n=6); quantidade de espaços e/ou estruturas no entorno da residência (n=1); e observação de adolescentes utilizando espaços públicos para AF (n=3). As taxas de prevalência apresentaram alta variabilidade de acordo com os indicadores do ambiente. Estudos na região Norte e Centro-oeste do país são inexistentes. As medidas de ambiente são distintas nos estudos com auto relato, o que dificulta a comparabilidade dos dados. Até o momento, não foi identificado estudos que forneçam informações sobre prevalências de
1 Federal University of Santa Catari-na. Florianópolis, SC. Brazil.
2 Federal Institute of Ceará. Campus Boa Viagem. Boa Viagem, CE. Brazil.
Received: April 22, 2018
INTRODUCTION
Increasing physical activity (PA) is a global health priority
1. From an
eco-logical perspective, multiple level factors (from individual to environmental
aspects) may determine the levels of PA of the young population
2. Thus,
an attractive community environment provides benefits facilitating PA
as well as a variety of additional benefits ranging from mental health to
environmental sustainability and economics
3. Consequently, identifying
which community environment factors, being built or perceived, could
support or suppress the engagement in PA and how they would do it is
imperative in order to define health promoting strategies directed at the
young population
4.
Studies investigating the perception of the PA environment by
ado-lescents have used different indicators, such as presence of places available
for PA in the community
5–8, as well as the quality, safety and cleanliness
of these places
6,7,9, which may play a role as facilities or barriers regarding
engagement in PA. Systematic reviews have demonstrated that the most
common methods for collecting data on building environmental
charac-teristics are self-reports or objective measures such as the Geographic
Information System (GIS) and systematic observation
10,11.
Previous reviews have highlighted that most of the studies about the
environment for PA with young people were conducted in high-income
countries
11,12. Also, studies from developing countries have similarly
fo-cused on the evaluation of macro (e.g. cities, rural/urban areas), meso (e.g.
neighborhood) and micro (e.g. areas close to living places) environment
scales, whereas studies measuring the meso environment are predominant
in developed countries
11. In Brazil, there is wide heterogeneity of culture,
economy and natural environmental factors that could contribute to a
distinct use or perception of the community environment for PA
6,7.
Given the presented contextualization, this study aimed to compile
evidence on the prevalence of indicators (e.g., infrastructure,
accountabil-ity for policy implementation) in the communaccountabil-ity environment that can
influence the PA opportunities and participation of Brazilian children
and adolescents.
METHODOLOGICAL PROCEDURES
Measured Outcome
In this review, the environment outcome was defined by environmental
attributes that are associated with PA in the community. We considered:
spaces, facilities for PA or programs available, quality of spaces, facilities of
the neighborhood, security (from crimes or traffic) and pollution (climate
conditions or scattered garbage)
13,14. These indicators can be evaluated with
rela-tives for the use of spaces or seeing people of the same age performing
PA) were not considered.
Study Search Strategies
A systematic search was conducted in the electronic databases Medline
(PubMed), Scopus, Web of Science (Web of Knowledge), LILACS
(
Literatura Latino-Americana em Ciências da Saúde
), SPORTDiscus,
BI-REME (Biblioteca Regional de Medicina), Scielo, and Google Scholar in
February 2018. The search strategy included three groups of descriptors:
environment, PA and population (see Table 1 Supplementary Materials).
The Boolean operator “AND” was used for combinations among descriptor
groups. The truncation symbols ($, * or “”) specific to each database were
also used to increase the range of searches for the descriptor variations.
Searches were conducted with the descriptors in English and Portuguese,
when required. The search of the electronic databases was supplemented
with a screening of the reference list of retrieved articles in order to find
potentially relevant titles and the personal library, as well as searches in
web sites to identify possible reports such as:
• Ministry of Health: www.portal.ms.saude.gov.br;
• Ministry of Education: www.portal.mec.gov.br;
• Sport Ministry: www.esporte.gov.br;
• Brazilian Institute of Geography and Statistics: www.biblioteca.ibge.
gov.br;
• National Health Survey: www.pns.icict.fiocruz.br;
• Virtual Health Library: www.bvsms.saude.gov.br;
• United Nations Development Program: www.br.undp.org
The systematic search was conducted by VB (author) and searches
in web sites and screening of the references were conducted by SV, GM,
MV and GM.
Identification of Eligible Studies
• Selection Process
The initial analysis was performed based on the reading of the
man-uscripts titles and, when there were doubts regarding the inclusion of the
study, a reading of the abstract was carried out. After this analysis, articles
were obtained in full text version and subsequently analyzed according to
established selection criteria. Subsequently, the screening of the reference
list was carried out. The entire process was conducted by independent peers
(SV/GM and MV/GM - authors), half of the references were read by each
pair, and a third author (KS or VB) helped when there were disagreements.
• Selection Criteria
Brazilian children or adolescents aged 0-18 years (or a mean age within
these ranges); (III) were observational studies using different methods for
the evaluation of community/municipality PA indicators (e.g., self-report,
proxy-report, structured interviews, objectively measured environment).
These community/municipality PA indicators were considered whether they
were measured by perceived (e.g., % of children and parents who perceive
that their community/municipality is doing a good job promoting PA as
facilities, programs, parks, and playgrounds; number of parks and other
environments), or built (presence of structures for PA, quality, distance of
structures for PA from school) methods.
Data Extraction
Data extracted included: study name, location of the study, aim, study
design, sample type, sample size, percentage of girls, age range,
instru-ment description, type of environinstru-mental indicators, and prevalence of each
indicator. Data for the whole sample were extracted for all subpopulations
presented. This process was conducted by independent peers (SW/GM
and MV/GM - authors) and a third author (KS or VB) helped when there
were disagreements.
The studies investigated were arranged in alphabetical and
chronologi-cal order by author’s name and year of publication, respectively. The findings
were grouped using the following indicators: facilities, programs or spaces
available for PA; presence of sidewalks or bicycle lanes; proximity to the
residence; quality and PA attributes of public open spaces; safety; traffic
safety and cleanliness or pollution in the neighborhood. The results were
divided into the following groups: study description (Table 1); prevalence
of the perceptions (Table 2), and barriers (Table 3) of the built environment
in the community context. Studies with objective measures (Table 4) were
grouped into two categories: use of GIS and use of observational methods
to evaluate public open spaces for PA in the community environment.
RESULTS
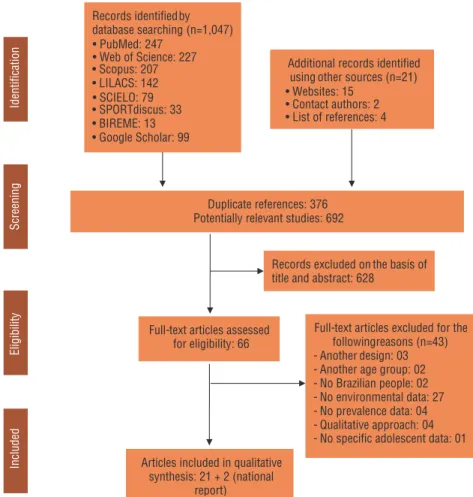
A total of 1,047 articles in databases and 21 in websites, contact authors,
and reference lists were identified. About 376 duplicate references were
found. The remaining 692 had titles and abstracts suitable for inclusion; 66
articles were further considered for full-text screening. Thus 21 full-text
pa-pers
5–9,15–30and 2 national reports
31,32were included in the systematic review,
representing 15 different studies. Exclusion reasons are detailed in Figure 1.
Most studies (n=8) were conducted in Southern Brazil, especially in the
states of Paraná (n=4)
5,6,9,15,16,21,23,26,26and Rio Grande do Sul (n=4)
22,24,25,29.
Three studies were conducted in states in Northeastern Brazil:
Pernam-buco (n=2)
7,8,17,18,27and Sergipe (n=1)
31states, and three others in São Paulo
state
19,20,30(Southeastern Brazil).
recent study was conducted in 2014
32. However, the last evaluations of the
subject’s perception were conducted in 2012
5,15,16(Table 1).
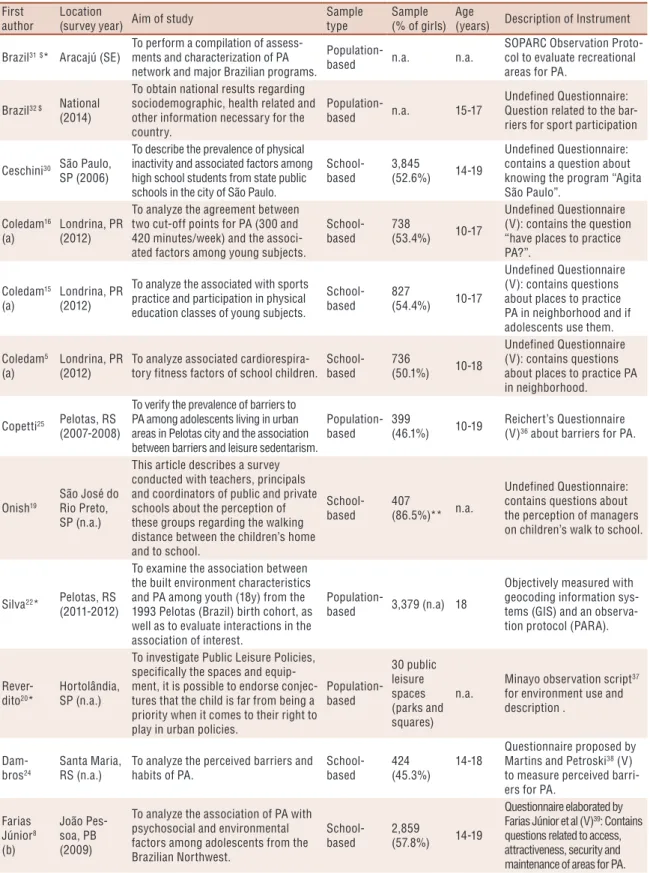
The sample design was def ined as school-based (7 st
ud-ies)
5–9,15–19,21,23,24,26,29,30or population-based (8 studies)
20,22,25,27,28,31,32surveys. The sample size ranged from 59 (focus group study)
23to 3,845
subjects
30. Four studies evaluated less than 500 adolescents
19,23–25, and one
and two studies evaluated a sample size of 500-1,000
5,15,16and
1,000-2,000
6,9,21,26,28, respectively. Three studies investigated more than 2,000
adolescents
7,8,17,18,22,30and one study did not report the sample size
32. Age
range varied among studies, with six including only adolescents aged
≥14 years
6–9,17,18,21,23,24,26,30,32and three including adolescents aged 10-19
years
5,15,16,25,29. Sample size or age range were not described in four studies
which used a direct observation approach, with the sample consisting of
areas/facilities and not of adolescents
20,27,28,31, as expected (Table 1).
The instruments used to measure the environment for PA were
self-reported questionnaires
5–9,15–19,21,24–26,29,30,32, objective measurement
proto-cols
20,22,27,28,31and interviews
23. Questionnaires were applied in five and four
studies to evaluate perceived environment indicators for PA
5–9,15–19,21,26,30and perceived barriers for PA
24,25,29,32, respectively. Five of these nine
studies did not identify the instruments containing the original
ques-tions
5,9,15,16,19,30,31. One study analyzed perceived barriers for PA using a focus
group interview
23. Four studies objectively evaluated built environments
using observation protocols
20,27,28,31and one by combining the use of GIS
and an observation protocol
22(Table 1).
Table 1. Description of the studies on the environment for physical activity (PA) among Brazilian adolescents (n=23).
First author
Location
(survey year) Aim of study
Sample type
Sample (% of girls)
Age
(years) Description of Instrument
Brazil31$* Aracajú (SE)
To perform a compilation of assess-ments and characterization of PA network and major Brazilian programs.
Population-based n.a. n.a.
SOPARC Observation Proto-col to evaluate recreational areas for PA.
Brazil32 $ National
(2014)
To obtain national results regarding sociodemographic, health related and other information necessary for the country.
Population-based n.a. 15-17
Undefined Questionnaire: Question related to the bar-riers for sport participation
Ceschini30 São Paulo,
SP (2006)
To describe the prevalence of physical inactivity and associated factors among high school students from state public schools in the city of São Paulo.
School-based
3,845
(52.6%) 14-19
Undefined Questionnaire: contains a question about knowing the program “Agita São Paulo”.
Coledam16
(a)
Londrina, PR (2012)
To analyze the agreement between two cut-off points for PA (300 and 420 minutes/week) and the associ-ated factors among young subjects.
School-based
738
(53.4%) 10-17
Undefined Questionnaire (V): contains the question “have places to practice PA?”.
Coledam15
(a)
Londrina, PR (2012)
To analyze the associated with sports practice and participation in physical education classes of young subjects.
School-based
827
(54.4%) 10-17
Undefined Questionnaire (V): contains questions about places to practice PA in neighborhood and if adolescents use them.
Coledam5 (a)
Londrina, PR (2012)
To analyze associated cardiorespira-tory fitness factors of school children.
School-based
736
(50.1%) 10-18
Undefined Questionnaire (V): contains questions about places to practice PA in neighborhood.
Copetti25 Pelotas, RS
(2007-2008)
To verify the prevalence of barriers to PA among adolescents living in urban areas in Pelotas city and the association between barriers and leisure sedentarism.
Population-based
399
(46.1%) 10-19
Reichert’s Questionnaire (V)36 about barriers for PA.
Onish19
São José do Rio Preto, SP (n.a.)
This article describes a survey conducted with teachers, principals and coordinators of public and private schools about the perception of these groups regarding the walking distance between the children’s home and to school.
School-based
407
(86.5%)** n.a.
Undefined Questionnaire: contains questions about the perception of managers on children’s walk to school.
Silva22* Pelotas, RS
(2011-2012)
To examine the association between the built environment characteristics and PA among youth (18y) from the 1993 Pelotas (Brazil) birth cohort, as well as to evaluate interactions in the association of interest.
Population-based 3,379 (n.a) 18
Objectively measured with geocoding information sys-tems (GIS) and an observa-tion protocol (PARA).
Rever-dito20*
Hortolândia, SP (n.a.)
To investigate Public Leisure Policies, specifically the spaces and equip-ment, it is possible to endorse conjec-tures that the child is far from being a priority when it comes to their right to play in urban policies.
Population-based 30 public leisure spaces (parks and squares) n.a.
Minayo observation script37
for environment use and description .
Dam-bros24
Santa Maria, RS (n.a.)
To analyze the perceived barriers and habits of PA.
School-based
424 (45.3%)
14-18
Questionnaire proposed by Martins and Petroski38 (V) to measure perceived barri-ers for PA.
Farias Júnior8 (b) João Pes-soa, PB (2009)
To analyze the association of PA with psychosocial and environmental factors among adolescents from the Brazilian Northwest.
School-based
2,859
(57.8%) 14-19
First author
Location
(survey year) Aim of study
Sample type
Sample (% of girls)
Age
(years) Description of Instrument
Farias Júnior18 (b) João Pes-soa, PB (2009)
To examine the association of PA with psychosocial (attitude, self-efficacy, social support) and environmental characteristics (characteristics of the neighborhood) among adolescents from Northeastern Brazil.
School-based
2,361
(56.6%) 14-19
Questionnaire elaborated by Farias Júnior et al (V)39: Contains questions related to access, attractiveness, security and maintenance of areas for PA.
Farias Júnior17 (b) João Pes-soa, PB (2009)
To evaluate the association between levels of PA and perception of the social and built environmental among adolescents from Northeastern Brazil.
School-based
2,874
(57.8%) 14-19
Questionnaire elaborated by Farias Júnior et al (V)39: Contains questions related to access, attractiveness, security and maintenance of areas for PA.
Lima21 (c) Curitiba PR
(2006)
To determine the association between perceived distance to recreational facilities (parks, gyms, sports courts, and bike lanes) for PA and exercise among adolescents.
School-based
1,474
(49.0%) 14-18
Questions elaborated by the authors or from the NEWS-Y questionnaire (V): Con-tains questions related to the presence and distance from facilities for PA.
Lopes6 (c) Curitiba PR
(2006)
To analyze the association between perceived neighborhood environment and PA among high school students.
School-based
1,611
(59.7%) 14-18
NEWS-Y questionnaire (V) to measure environment for PA. Men-donça7 (b) João Pes-soa, PB (2009)
To analyze the association between perceived neighborhood environmen-tal characteristics and different types of physical activities in adolescents from Northeastern Brazil.
School-based
2,874
(57.8%) 14-19
Questionnaire elaborated by Farias Júnior et al (V)39. Contains questions related to access, attractiveness, security and maintenance of areas for PA.
Parra27* Recife PE
(2007)
To compare PA levels, park use, and park contextual characteristics at sites with and without the Academia da Cidade Program.
Population-based 5 areas with and 5 without Academia da Cidade Program n.a. SOPARC Observation Protocol used to evaluate recreational areas for PA.
Hino28* Curitiba PR
(2008)
To describe the characteristics of parks and squares users and to explore how these characteristics are associated with the practice of PA in these settings. Population-based 4 parks and 4 squares n.a. SOPARC Observation Protocol used evaluate recreational areas for PA.
Reis9 (c) Curitiba PR
(2007)
To evaluate the association between PA practice among adolescents and the perception of environmental features of public parks.
School-based
1,718
(59.6%) 14-18
Undefined Questionnaire (V): Questions used to evaluate perceived environ-mental features for PA.
Santos23 Curitiba PR
(n.a.)
To identify barriers to PA among adolescents.
School-based 59 (50.8%) 15-18
Interview elaborated by the authors to be applied with a focus group technique.
Santos26 (c)
Curitiba PR (2006)
To analyze the prevalence and as-sociation of barriers to PA among adolescents.
School-based
1,615
(59.7%) 14-18
Questionnaire elaborated by Santos et al (V)23: Contains questions related to the barriers for PA.
Silva29
Caxias do Sul RS (2007)
To describe the prevalence of active commuting to school and to identify barriers associated with the means of commuting to school.
School-based
1,622
(53.2%) 11-17
Question from CDC40 related
to the barriers for PA.
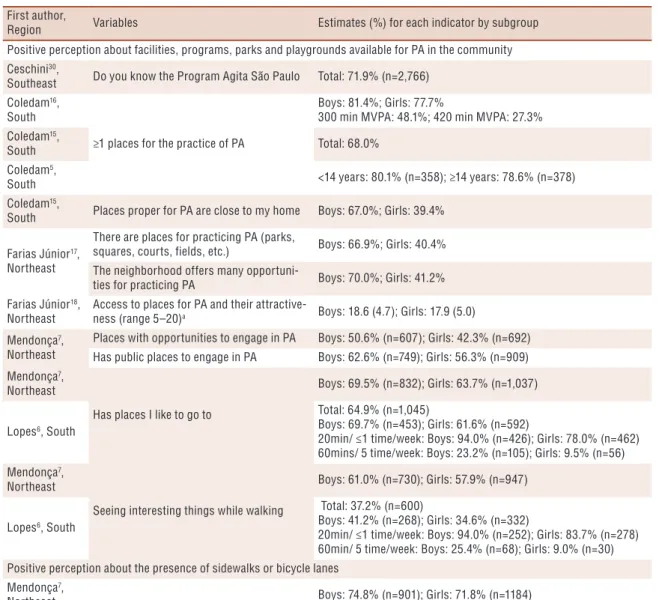
Perception about facilities, programs, parks and playgrounds
avail-able for PA in the community (Tavail-able 2) was reported by four studies in
eight publications
5–7,15–18,30. The total the prevalence ranged from 37.2%
6to
71.9%
30. According to sex, the prevalence ranged from 50.6%
5to 81.4%
16among boys and from 40.4%
17to 77.7%
16for girls.
Results about the presence of sidewalks or bicycle lanes were found
in two studies conducted in the Southern
6and Northeastern
7,17region. In
the Northeast, both indicators were perceived by more than 60.0% of the
adolescent sample, with a lower prevalence of perceived bicycle lanes by
girls (42.4%)
17. In the Southern region, less than 50% perceived the presence
of bicycle lanes (48.0%, boys)
6(Table 2).
Perception of public open spaces or facilities for PA near the residence
was reported in two studies of three publications
7,9,21. Less than 50% of
adolescents perceived some public open spaces for PA at a distance of up
to 31 minutes from their home
7,9,21. In the Southern region
21, the perceived
distance to the leisure facilities was more prevalent regarding the distance
of 21-30 minutes for gymnasiums or sports courts in general (50.5%) and
according to sex (boys: 46.9%, girls: 53.0%)(Table 2).
Regarding the quality of public open spaces and PA attestations in the
neighborhood, reported in two studies
6,7,17,18, more than 50% of the boys in
the studied perceived the maintenance of the spaces as good (54.3%
6and
69.8%
17), whereas this prevalence was lower among girls (34.1%)
6(Table 2).
The perceived safety of the neighborhoods for the practice of PA (Table
2) varied from 57.5%
6in the South to 67.8% in the Northeast region among
the boys
17. In the South region
6, more than 90% of the boys perceived the
environment as safe, with illuminated streets. In the Northeast region, less
than 40% of the girls perceived the environment as safe walking or
rid-ing a bike (35.7%), and the prevalence among boys was lower (31.8% and
29.6%, respectively)
7. The perception of traffic safety around the homes of
adolescents ranged from 67.5%
17to 79.8%
6. Boys (82.6%) perceived greater
safety in traffic than girls (77.9%)
6(Table 2).
Perception of cleanliness or absence of pollution in the neighborhood
was reported in only one study, conducted in the Northeast region, and
mentioned in two publications
7,17. More than 60% of the sufficiently active
boys perceived the residences as unpolluted (38.7% girls)
17, while only 25.8%
of the boys
7of the general study sample reported this perception
7(Table 2).
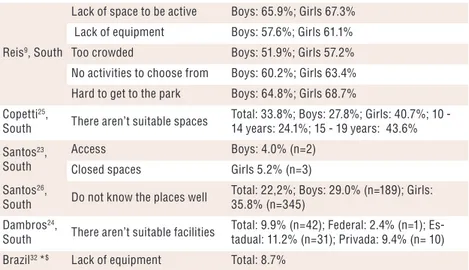
Environment barriers for PA among Brazilian adolescents were
in-vestigated by seven studies
9,19,23–26,29(Table 3). Facilities, programs, parks
and playgrounds available for PA in the community were reported in five
studies
9,23–26all conducted in the South region. The perception was more
prevalent among girls, ranging from 35.8%
26to 68.7%
9, than among
boys (27.8%
25to 64.8%
9), among older adolescents (15-19 years: 43.6%)
compared to younger ones (10-14 years: 24.1%)
25, and among adolescents
Table 2. Results of the studies about positive perception of environment for physical activity (PA) among Brazilian adolescents (n=10).
First author,
Region Variables Estimates (%) for each indicator by subgroup
Positive perception about facilities, programs, parks and playgrounds available for PA in the community Ceschini30,
Southeast Do you know the Program Agita São Paulo Total: 71.9% (n=2,766)
Coledam16, South
≥1 places for the practice of PA
Boys: 81.4%; Girls: 77.7%
300 min MVPA: 48.1%; 420 min MVPA: 27.3% Coledam15,
South Total: 68.0%
Coledam5,
South <14 years: 80.1% (n=358); ≥14 years: 78.6% (n=378)
Coledam15,
South Places proper for PA are close to my home Boys: 67.0%; Girls: 39.4%
Farias Júnior17, Northeast
There are places for practicing PA (parks,
squares, courts, fields, etc.) Boys: 66.9%; Girls: 40.4%
The neighborhood offers many
opportuni-ties for practicing PA Boys: 70.0%; Girls: 41.2%
Farias Júnior18, Northeast
Access to places for PA and their
attractive-ness (range 5–20)a Boys: 18.6 (4.7); Girls: 17.9 (5.0)
Mendonça7, Northeast
Places with opportunities to engage in PA Boys: 50.6% (n=607); Girls: 42.3% (n=692)
Has public places to engage in PA Boys: 62.6% (n=749); Girls: 56.3% (n=909)
Mendonça7, Northeast
Has places I like to go to
Boys: 69.5% (n=832); Girls: 63.7% (n=1,037)
Lopes6, South
Total: 64.9% (n=1,045)
Boys: 69.7% (n=453); Girls: 61.6% (n=592)
20min/ ≤1 time/week: Boys: 94.0% (n=426); Girls: 78.0% (n=462) 60mins/ 5 time/week: Boys: 23.2% (n=105); Girls: 9.5% (n=56) Mendonça7,
Northeast
Seeing interesting things while walking
Boys: 61.0% (n=730); Girls: 57.9% (n=947)
Lopes6, South
Total: 37.2% (n=600)
Boys: 41.2% (n=268); Girls: 34.6% (n=332)
20min/ ≤1 time/week: Boys: 94.0% (n=252); Girls: 83.7% (n=278) 60min/ 5 time/week: Boys: 25.4% (n=68); Girls: 9.0% (n=30) Positive perception about the presence of sidewalks or bicycle lanes
Mendonça7, Northeast
There are sidewalks on most streets
Boys: 74.8% (n=901); Girls: 71.8% (n=1184)
Farias Júnior17,
Northeast Boys: 65.0%; Girls: 38.9% (physically active adolescents)
Lopes6, South
Total: 63.4% (n=1.021)
Boys: 66.5% (n=432); Girls: 61.3% (n=589)
20min/ ≤1 time/week: Boys: 90.7% (n=392); Girls: 78.8% (n=464) 60min/ 5 time/week: Boys: 27.7% (n=98); Girls: 8.8% (n=52) Farias Júnior17,
Northeast
There are bicycle lanes or places where I can ride a bicycle
Boys: 65.4%; Girls: 42.4%
Mendonça7,
Northeast Boys: 25.6% (n=306); Girls: 27.7% (n=451)
Lopes6, South
Total: 43.8% (n=705)
Boys: 48.0% (n=312); Girls: 40.9% (n=393)
20min/ ≤1 time/week: Boys: 92.6% (n=289); Girls: 75.6% (n=297) 60min/ 5 time/week: Boys: 23.4% (n=73); Girls: 10.2% (n=40) Positive perception of OPS or facilities for PA near the residence
Reis9, South Up to 30 min Boys: 54.4%; Girls: 46.2%
More than 30 min Boys: 20.7%; Girls: 33.2%
Mendonça7,
Northeast Places near home to engage in PA Boys: 72.5% (n=869); Girls: 69.4% (n=1141)
First author,
Region Variables Estimates (%) for each indicator by subgroup
Lima21, South
1-2 leisure facilities near the residence Total: 10.2% (n=150)
Boys: 10.9% (n=66); Girls: 9.6% (n=84)
≥ 3 leisure facilities near the residence Total: 33.6% (n=496)
Boys: 38.8% (n=234); Girls: 30.1% (n=262)
[< 5 min] Distance from the parks Total: 20.1% (n=296)
Boys: 22.7% (n=137); Girls: 18.3% (n=159)
[< 5 min] Distance to squares Total: 20.8% (n=306)
Boys: 27.4% (n=165); Girls: 16.2% (n=141)
[< 5 min] Distance to the gyms Total: 27.7% (n=409)
Boys: 31.2% (n=188); Girls: 25.4% (n=221) [< 5 min] Distance gymnasiums or sports
courts
Total: 11.4% (n=168);
Boys: 13.4% (n=81); Girls: 10.0% (n=87) [< 5 min] Distance bike paths or walking
trails
Total: 19.3% (n=284)
Boys: 19.9% (n= 120); Girls: 18.8% (n=164)
[6-10 min] Distance from the parks Total: 22.9% (n=338)
Boys: 23.9% (n=144); Girls: 22.3% (n=194)
[6-10 min] Distance to squares Total: 20.5% (n=302)
Boys: 23.5% (n=142); Girls: 18.4% (n=160)
[6-10 min] Distance to the gyms Total: 16.9% (n=249)
Boys: 17.1% (n=103); Girls: 16.8% (n=146) [6-10 min] Distance gymnasiums or sports
courts
Total:14.8% (n=218)
Boys: 15.8% (n=95); Girls: 14.1% (n=123) [6-10 min] Distance bike paths or walking
trails
Total: 16.1% (n=237)
Boys: 14.3% (n= 86); Girls: 17.3% (n=151)
[11-20min] Distance from the parks Total: 22.1% (n=326)
Boys: 21.4% (n=129); Girls: 22.6% (n=197)
[11-20min] Distance to squares Total: 18.6% (n=274)
Boys: 18.2% (n=110); Girls: 18.8% (n=164)
[11-20min] Distance to the gyms Total: 13.4% (n=197)
Boys: 14.4% (n=87); Girls: 12.6% (n=110); [11-20min] Distance gymnasiums or sports
courts
Total: 13.1% (n=193)
Boys o: 12.9% (n=78); Girls: 13.2% (n=115) [11-20min] Distance bike paths or walking
trails
Total: 7.7% (n=114)
Boys: 8.1% (n=49); Girls: 7.5% (n=65)
[21-30min] Distance from the parks Total: 12.2% (n=180)
Boys: 11.1% (n=67); Girls: 13.0% (n=113)
[21-30min] Distance to squares Total: 11.4% (n=168)
Boys: 12.4% (n=75); Girls: 10.7% (n=93)
[21-30min] Distance to the gyms Total: 7.5% (n=110)
Boys: 7.8% (n= 47); Girls: 7.3% (n=63) [21-30min] Distance gymnasiums or sports
courts
Total: 50.5% (n=745)
Boys: 46.9% (n=283); Girls: 53.0% (n= 462) [21-30min] Distance bike paths or walking
trails
Total: 23,3% (n=343)
Boys: 18.9% (n=114); Girls: 26.3% (n=229)
[≥31min] Distance from the parks Total: 22.7% (n=334)
Boys: 20.9% (n=126); Girls: 23.9% (n=208)
[≥31min] Distance to squares Total: 28.8% (n=424)
Boys: 18.4% (n=111); Girls: 35.9% (n=313)
[≥31min] Distance to the gyms Total: 34.5% (n=509)
Boys: 29.5% (n=178); Girls: 38.0% (n=331) [≥31min] Distance gymnasiums or sports
courts
Total: 10.2% (n=150)
Boys: 10.9% (n=66); Girls: 9.6% (n=84)
Lima21, South [≥31min] Distance bike paths or walking
trails
Total: 33.6% (n=496)
Boys: 38.8% (n=234); Girls: 30.1% (n=262)
…continue
First author,
Region Variables Estimates (%) for each indicator by subgroup
Positive perception about quality of the OPS and PA attributes in the neighborhood Farias Júnior17,
Northeast
Places where I can practice of PA are well
maintained Boys: 69.8%; Girls: 40.3%
Farias Júnior18, Northeast
Structure and maintenance of the
neigh-borhood (range 4–16)a Boys: 11.3 (n=2.8); Girls: 11.3 (n=2.9)
Mendonça7,
Northeast Well maintained venues to engage in PA Boys: 46.0% (n=553); Girls: 44.4% (n=730)
Lopes6, South Overall perception of the environmental
(good and very good)
Total: 47.3% (n=762)
Boys: 54.3% (n=353); Girls 42.6% (n=409)
20min/ ≤1 time/week: Boys: 51.1% (n=332); Girls: 34.1% (n=328) 60min/ 5 time/week: Boys: 13.4% (n=87); Girls: 4.2% (n=40) Positive perception of safety in the neighborhood
Farias Júnior17, Northeast
Places where I can practice PA are not safeb Boys: 67.8%; Girls: 40.3%
The neighborhood is violent, with a lot of
muggings, crime, and drugsb Boys: 65.6%; Girls: 39.8%
Farias Júnior18, Northeast
Security for the practice of physical activity
(range 3–12)a Boys: 11.4 (3.2); Girls: 11.1 (3.2)
Mendonça7, Northeast
It is safe for walking and running Boys: 31.8%; Girls: 35.7%
It is safe for riding a bike Boys: 29.6%; Girls: 35.7%
Lopes6, South
There’s a lot of crimec
Total: 53.0% (n=854)
Boys: 51.9% (n=337); Girls: 53.8% (n=517)
20min/ ≤1 time/week: Boys: 91.7% (n=309); Girls: 78.0% (n=403) 60min/ 5 time/week: Boys: 24.6% (n=83); Girls: 9.9% (n=51)
It is safe
Total: 47.1% (n=759)
Boys: 57.5% (n=374); Girls: 40.1% (n=385)
20min/ ≤1 time/week: Boys: 93.3% (n=349); Girls: 77.9% (n=300) 60min/ 5 time/week: Boys: 23.0% (n=86); Girls: 9.6% (n=37)
There are streets lit
Total: 44.2% (n=712)
Boys: 46.6% (n=303); Girls: 42.6% (n=409)
20min/ ≤1 time/week: Boys: 90.8% (n=275); Girls: 79.2% (n=324) 60min/ 5time/week: Boys: 22.8% (n=69); Girls: 9.5% (n=39) Positive perception about traffic safety around the homes
Farias Júnior17, Northeast
Riding a bicycle in the streets around my
house is not safe because of street traffica Boys: 67.8%; Girls: 40.1%
Walking or jogging in the streets around my
house is not safe because of street traffica Boys: 67.5%; Girls: 40.3%
Lopes6, South
There’s too much trafficc
Total: 79.8% (n=1,286)
Boys: 82.6% (n=537); Girls: 77.9% (n=749)
20min/ ≤1 time/week: Boys: 92.4% (n=496); Girls: 77.7% (n=582) 60min/ 5 time/week: Boys: 22.2% (n=119); Girls: 8.9% (n=67) Positive perception of cleanliness or not pollution in the neighborhood
Farias Júnior17, Northeast
The neighborhood is polluted, with open
sewage, garbage and debris on the streetsc Boys: 65.4%; Girls: 38.7%
Mendonça7,
Northeast It is not polluted Boys: 25.8% (n=310); Girls: 25.5% (n=413)
Note. MVPA: moderate/vigorous physical activity; OPS: Open Public Spaces. Notes: aData are reported as mean (standard-deviation); bVariables with inverted response scales; c% refers to those who disagree with the question.
Far distance from public open spaces and facilities was investigated as a
barrier for PA in two studies in the South region
23,29, and negative perception
about the presence of sidewalks or bicycle lanes and quality of the
neighbor-hood was investigated in another study
19in the Southeast region. The
preva-lence of this barriers was low (highest: 16.7%)
29(Table 3).
Low neighborhood and traffic safety as a barrier for PA (Table 3) was
mostly reported in studies from the South region
9,23,24,29, except one
19.
Safety indicators such as poor lighting (62.0%) of the neighborhoods,
perceived insecurity (59.5%) for PA and dangerous traffic (58.3%) was more
prevalent among girls than boys (54.4%, 54.2%, 57.8%, respectively)
9. In
a study with adolescents who were active in commuting the perception of
insecurity in traffic was perceived by 61.7% of the sample
29. Furthermore,
adolescents from state schools perceived a greater proportion of crimes in
the community environment (5.1%)
24.
Information on cleanliness or pollution in the neighborhood as a PA
barrier was reported by four studies
23,24,26,29, all carried out in the South
region. This negative perception was frequently reported by girls (49.0%)
26,
and by actively commuting adolescents (88.4%)
29(Table 3).
The studies that investigated built environment indicators using
different objective measures (Table 4) were conducted in the South
22,28,
Southeast
20, and Northeast
27regions. Only one study using GIS in more
than 50% of the buffers around the residence of adolescents in Pelotas
reported has some attributes for PA, with regular quality or public spaces
22.
Systematic observation studies using SOPARC showed a higher
prevalence of sports equipment in parks (56.4%) and in squares (51.4%)
28.
The frequency of the use of these spaces varies by children and adolescents
varied according to sex, the period of the day, week and/or weekend, and
the intensity of PA practiced
28. Health Promotion Programs (Academia da
Cidade Program) with assistance to adolescents are present in only 13.0%
of the cities of Brazil
27(Table 4).
Table 3. Results of the studies about barriers (negative perception) of environment for physical
activity among Brazilian adolescents (n=8).
First author,
Region Variables of the environment Estimates (%) for each indicator by subgroup
Negative perception about facilities, programs, parks and playgrounds available for physical activity in the community
Reis9, South
Lack of space to be active Boys: 65.9%; Girls 67.3%
Lack of equipment Boys: 57.6%; Girls 61.1%
Too crowded Boys: 51.9%; Girls 57.2%
No activities to choose from Boys: 60.2%; Girls 63.4%
Hard to get to the park Boys: 64.8%; Girls 68.7%
Copetti25,
South There aren’t suitable spaces
Total: 33.8%; Boys: 27.8%; Girls: 40.7%; 10 - 14 years: 24.1%; 15 - 19 years: 43.6%
Santos23, South
Access Boys: 4.0% (n=2)
Closed spaces Girls 5.2% (n=3)
Santos26,
South Do not know the places well
Total: 22,2%; Boys: 29.0% (n=189); Girls: 35.8% (n=345)
Dambros24,
South There aren’t suitable facilities
Total: 9.9% (n=42); Federal: 2.4% (n=1); Es-tadual: 11.2% (n=31); Privada: 9.4% (n= 10)
Brazil32 *$ Lack of equipment Total: 8.7%
Negative perception about the presence of sidewalks or bicycle lanes
First author,
Region Variables of the environment Estimates (%) for each indicator by subgroup
Onishi19 (a),
Southeast Inadequate sidewalks Privatad: 3.1%; Public: 3.3%
Negative perception of OPS or facilities for PA near the residence Santos23,
South Far from home Boys: 4.0% (n=2)
Silva29 (b),
South Long distance Total: 16.7% (n=247); Active commuting: 11.7%
Negative perception about quality of the neighborhood
Onishi19 (a), Southeast
Quality of school
environ-mental Poor quality: 7.1%; Good quality: 49.1%
Negative perception of safety in the neighborhood
Reis9, South Poor lightning Boys: 54.4%; Girls 62.0%
Unsafe localtion Boys: 54.2%; Girls 59.5%
Santos23, South
Crime/Danger
Boys: 4.0% (n=2); Girls: 3.4% (n=2)
Silva29 (b),
South Total: 7.4% (n=109); Active commuting: 38.5%
Dambros24, South
Total: 4.2% (n=18); Federal: 0%; Estadual: 5.1% (n=14); Private: 3.8% (n=4)
Onishi19 (a),
Southeast Privatad: 3.6%; Public: 3.8%
Negative perception about traffic safety around the homes
Reis9, South Traffic nearby is dangerous Boys: 57.8%; Girls 58.3%
Onishi19 (a), Southeast
There isn’t a pedestrian track Privatad: 3.3%; Public: 3.4%
Heavy traffic Privatad: 4.6%; Public: 4.1%
Cars travel at safe speed Privatad: 2.5%; Public: 2.6%
Silva29 (b),
South Traffic Total: 7.8% (n=115); Active commuting: 61.7%
Negative perception of cleanliness or not pollution in the neighborhood
Santos23, South
Weather
Girls 5.2% (n=3)
Santos26, South
Active: 25,2%; Boys: 28.6% (n=186); Girls: 49.0% (n=472)
Dambros24, South
Total: 15.1% (n=64); Federal: 4.9% (n=2); Es-tadual: 16.3% (n=45); Privada: 16.0% (n=17)
Silva29 (b), South
Total: 17.7% (n=262); Active commuting: 88.4%
Note. (a): perceptions of school managers; (b): only one barrier could be indicated by the adolescent. OPS: Open Public Spaces; PA: physical activity; *$National reports (grey literature). In studies that objectively evaluated the use of public areas for PA, the sample unit was observation areas and not subjects.
DISCUSSION
This systematic review revealed a lack of studies in two of five Brazilian
regions for the last year of data collection, with diversity of indicators related
to the positive and negative (barriers) perceptions of the environment for
the practice of PA by adolescents. The instruments used to measure the
environment for PA were self-reported questionnaires, objective
Continue…
Table 4. Results of the studies with using objective methods for the evaluation of the environment for physical activity (PA) with a
sample of Brazilian adolescents (n=5).
First author,
Region Variables Results
Use of Geographical Information Systems (GIS) to evaluate characteristics of the community environment
Silva22, South
Number of character-istics in the 500 me-ters circular buffer from the adolescent’s
residencea
Number of OPS (parks and boulevards): 86.3% (n=2,870)
Number of OPS with at least one PA attribute regardless of quality: 75.9% (n=2,526) Number of OPS with at least one PA attribute considered of regular quality: 65.2% (n=2,170) Number of OPS with at least one PA attribute considered of good quality: 42.4% (n=1,411) Number of walking paths/trails: 26.6% (n=884)
Number of football pitches: 58.9% (n=1,959) Number of cycle paths/lanes: 23.9% (n=806) Number of private gyms: 64.1% (n=2,165) Existence of beachfront: 1.2% (n=42) Number of PA attributes: 90.1% (n=2,997) Use of observational methods to evaluate OPS for PA in community environment
Hino28 (b), South
Characteristics of the parks and squares (%)*
Sports: Parks (56.4%); Squares (51.4%)
Strength/stretching exercise: Parks (7.7%); Squares (7.1%) Open area: Parks (7.7%); Squares (0%)
Walking/running track: Parks (12.8%); Squares (5.7%)
Others (skating, athletics, roller, others): Parks (0%); Squares (10.0%) Playground area: Parks (15.4%); Squares (25.7%)
Users of parks and squares according to day of the week
Weekdays: children- Parks: Boys (5.6%); Girls (7.7%); Square: Boys (14.3%); Girls (14.0%). Adolescent- Parks: Boys (17.1%); Girls (5.9%); Square: Boys (38.6%); Girls (16.9%) Weekend: children- Parks: Boys (19.3%); Girls (19.4%); Square: Boys (17.6%); Girls (13.4%). Adolescent- Parks: Boys (18.5%); Girls (14.3%); Square: Boys (34.9%); Girls (19.3%)
Users of parks and squares according to period of the day
7-8 AM/children: Parks: Boys (0.4%); Girls (0.0%); Square: Boys (0.0%); Girls (0.0%) 11-12 AM/children: Parks: Boys (21.5%); Girls (19.3%); Square: Boys (20.0%); Girls (19.2%) 5-6 PM/children: Parks: Boys (11.6%); Girls (16.0%); Square: Boys (16.3%); Girls (17.5%) 7-8 AM/ adolescent: Parks: Boys (2.7%); Girls (4.3%); Square: Boys (2.5%); Girls (1.1%) 11-12 AM/ adolescent: Parks: Boys (11.3%); Girls (7.7%); Square: Boys (27.8%); Girls (19.2%) 5-6 PM/c adolescent: Parks: Boys (28.4%); Girls (17.3%); Square: Boys (49.9%); Girls (26.7%)
Hino28 (b), South
Users of parks and squares according to day of the week and period of the day by level of PA
Walking PA
Weekdays: Parks: Boys (17.6%); Girls (20.4%); Square: Boys (26.9%); Girls (13.7%) Weekend: Parks: Boys (33.3%); Girls (39.7%); Square: Boys (28.8%); Girls (18.4%) 7-8 AM: Parks: Boys (11.7%); Girls (19.6%); Square: Boys (11.7%); Girls (12.4%) 11-12 AM: Parks: Boys (30.6%); Girls (31.4%); Square: Boys (23.3%); Girls (12.9%) 5-6 PM: Parks: Boys (28.8%); Girls (37.8%); Square: Boys (34.0%); Girls (19.9%) Vigorous PA
Weekdays: Parks: Boys (57.9%); Girls (59.3%); Square: Boys (45.6%); Girls (58.8%) Weekend: Parks: Boys (40.3%); Girls (35.8%); Square: Boys (32.0%); Girls (33.4%) 7-8 AM: Parks: Boys (72.0%); Girls (67.0%); Square: Boys (76.1%); Girls (81.4%) 11-12 AM: Parks: Boys (41.4%); Girls (42.4%); Square: Boys (35.8%); Girls (40.3%) 5-6 PM: Parks: Boys (44.6%); Girls (39.3%); Square: Boys (31.3%); Girls (35.2%)
Parra27 (b), Northeast
Park use patterns, by presence or absence of the ACP
Adolescents All Sites: 13.0% (n=4,294); ACP Sites: 13.3% (n=2,388); Non-ACP Sites: 12.7% (n=1,906)
Accessible All Sites: 97.0% (n=5,395); ACP Sites: 93.0% (n=2,664); Non-ACP Sites: 99.0% (n=2,731)
Usable All Sites: 96.0% (n=5,386); ACP Sites: 93.0% (n=2,655); Non-ACP Sites: 99.0% (n=2,731)
Equipped All Sites: 5.0% (n=262); ACP Sites: 9.0% (n=255); Non-ACP Sites: 0.2% (n=7)
ment protocols, and interviews. The prevalence of indicators related to the
environment varied according to sex, but few studies investigated subgroups
such as age group or PA levels.
Among the studies that reported the year of data collection, the
first studies with Brazilian adolescents were conducted in 2006 in the
South
6,9,21,26and Southeast
30regions, and most recent ones were
con-ducted in 2012 in the Southern region. The region more investigated
was the South
5,6,9,15,16,21,23,26,28followed by the Southeast
19,20,30and
North-east
7,8,17,18,27,31. The location of research groups or individual investigators
that study the environment for the practice of PA may be one of the reasons
explaining these results. Recent studies on environment perception for the
practice of PA by adolescents may be in progress or are studies
19,20,23,24,31that
did not report this information or did not have this focus. Still, research
groups and individual investigators of the subject may be focusing their
studies on other age groups such adults and older adults. Anyway, this is
an important gap of knowledge in view of the cultural and socioeconomic
diversity of the regions.
The studies included in the review reported the prevalence of perception
including facilities, programs, parks and playgrounds available for PA in
the community
5–7,15–18,30(barriers
9,23–26), the presence of sidewalks or bicycle
lanes
6,7,17(barriers
19), public open spaces or facilities for PA near the
resi-dence
7,9,21(barriers
23,29), quality of public open spaces and PA attestations
in the neighborhood
6,7,17,18(barriers
19), safety of the neighborhoods for the
practice of PA
6–8,17(barriers
9,19,23,24,29), traffic safety around the homes
6,17(barriers
9,19,29), and cleanliness or absence of pollution in the
neighbor-hood
7,17(barriers
23,24,26,29). This diversity of indicators analyzed shows the
complexity and variability of the built environment items that are
neces-sary to understand the practice of PA. The survey of an indicator does not
reveal the use of space or existence of the physical and perceived structure
of PA in the community environment. Thus, methods for evaluating the
environment need to be combined (subjective and objective measures) for
…continue
First author,
Region Variables Results
Reverdito20 (c), South-east
Number of OPS and facilities for PA observed
OPS observed: n=30 Squares: n=12 Parks: n=3
PA attributes (open sports places, walking and cycle paths/trails, beachfront and gym): n=37
Quality of OPS OPS with poor quality: n=7
OPS with good quality: n=7
Traffic safety OPS in the area with heavy traffic: n=10
Use of the OPS by childrens or adoles-cents
Number of OPS where there 91 children using the facilities for PA: n=13 Number of OPS where there 50 adolescents doing PA: n=9
OPS within facilities for PA, but there were children and adolescents playing: n=4
Brazil31 $ Use of OPS Adolescents: 17%; Childrens: 16%
a better understanding of the complexity of the topic.
Even studies that investigated the environment for PA by self-reported
questionnaires used a variety of indicators based on different instruments,
and only a few mentioned validation criteria for adolescents
8,24–26. A broad
heterogeneity of the information collected was observed in some studies
in which similar variables were questioned in different paths with various
response options, thereby making it difficult to compare the data. Studies
with objective measures of the environment were carried out only in the
South and Southeast regions
20,22,27,28. In the present review, no study was
performed using objective and perceived measures for the built environment
in combination, which makes it difficult to understand the analysis of the
real environment with perceived and feasible use of space.
The perception of the presence of public open spaces and/or
facili-ties for PA was the indicator more frequently investigated. Studies have
shown that boys perceive a higher prevalence of the presence of some
attribute for PA than girls
6,15,17,30. Findings also indicate that boys
accu-mulate more time in leisure PA than girls
15,33. In general, perceiving the
presence of spaces near one’s home can facilitate engagement in PA
4,9. In
addition, studies have shown that low levels of PA may be influenced by
the lack of opportunities for facilities close to the residence of Brazilian
youth
17,29. However, a community context with options for promotion of
PA (i.e., security, maintenance, proximity, park features) may contribute
to changes in the behavior of different age groups, as observed in
high-income countries
13,14,34,35.
Some gaps were identified. Although some studies reported prevalence
data about the perception of spaces, facilities, program, quality or safety, the
data were insufficient to determine their use by adolescents for PA
6,8,16,17,30,
except for one report
9. A study carried out in Curitiba showed that more
than 50% of the adolescents investigated did not attend the parks due to
lack of equipment, very crowded conditions, and difficult access
9. In this
respect, it is important to investigate whether the fact that adolescents
perceive an opportunity in the community causes it to be used for PA. In
the studies using objective measures of the environment, the unit of analysis
was the observed space or the quantity of these settings in a determined
area or region. However, it is unknown if adolescents make use of these
places by perceiving closeness to their residence, security, and quality or
based on the facilities for PA
22,27,28. Finally, it is also unknown whether
the settings are frequented by adolescents for PA, when the indicators of
the environment are perceived as non-barriers
25,26.
Possibly, a collaborative network of researchers in the area could promote
investigations in two of the five regions of the country that do not yet have
information on this topic, thus yielding relevant national data.
Several limitations in this review need to be considered. The screening
step was performed independently by two uncalibrated pairs, who may
have made different decisions regarding the inclusion of certain studies.
The bias risk was not analyzed because of the heterogeneity of the
obser-vational studies that investigated this outcome in adolescents. In addition,
the lack of studies in all regions of the country and regarding the coverage
of the indicators, standardized instruments and the representativeness of
the samples investigated limited the discussion of the prevalence found
in this review.
The strengths identified were the broad search of the studies as well
as electronic databases in national reports. The systematic survey of the
prevalence of the perception of indicators of the built environment for PA
by adolescents provides subsidies for the creation of public health policies
for the implementation of programs, actions or interventions to make urban
environments friendly to PA in this population. By surveying the scientific
literature, the review identified important gaps that can be considered in
future research on the topic.
Thus, the review identified that perceived environment indicators of PA
by adolescents has been investigated in the South, Southeast and Northeast
regions of the country. The instruments used to measure environmental
perception varied within the same indicator, which made it difficult to
compared studies. The indicators of a community environmental were
mostly the presence of public open spaces and facilities for PA and their
proximity to the homes of the adolescents. The surveyed studies revealed
a higher prevalence of boys who perceive the community environment for
PA than girls in all the regions investigated. To date, no studies with the
combined use of perceived and objective measures of the built environment
have been identified.
Acknowledgments
We would like to acknowledge the funding support provided by CAPES
(Coordination of Improvement of Higher Level Personnel) in scholarships
to G Minatto, MVV Lopes, GT Mello, and FAPESC (Foundation for
Research and Innovation Support of the State of Santa Catarina, Brazil)
in scholarships to SW Manta.
COMPLIANCE WITH ETHICAL STANDARDS
Funding
Conflict of interest statement
The authors have no conflict of interests to declare.
Author Contributions
SWM, GM, MVVL and GTM participated in the methodological design,
study search and selection, data extraction and synthesis, writing the text
and approved the final version of the manuscript. KSS and VCBF
par-ticipated in the methodological design, evaluation of studies, writing the
text and approved the final version of the manuscript.
REFERENCES
1. World Health Organization/WHO. Prevalence of insufficient physical activity. Available from: <http://www.who.int/gho/ncd/risk_factors/physical_activity/en/> [2017 marc 15].
2. Sallis JF, Cervero RB, Ascher W, Henderson KA, Kraft MK, Kerr J. An eco-logical approach to creating active living communities. Annu Rev Public Health 2006;27(1):297–322.
3. Sallis JF, Spoon C, Cavill N, Engelberg JK, Gebel K, Parker M, et al. Co-benefits of designing communities for active living: an exploration of literature. Int J Behav Nutr Phys Act 2015;12(1):30.
4. Coughenour C, Coker L, Bungum TJ. Environmental and social determinants of youth physical activity intensity levels at neighborhood parks in Las Vegas, NV. J Comm Health 2014;39(6):1092–6.
5. Coledam DHC, Ferraiol PF, dos-Santos JW, Oliveira AR de. Factors associ-ated with cardiorespiratory fitness in school students. Rev Bras Med Esporte 2016;22(1):21–6.
6. Lopes AA dos S, Lanzoni AN, Hino AAF, Rodriguez-Añez CR, Reis RS. Per-ceived neighborhood environment and physical activity among high school students from Curitiba, Brazil. Rev Bras Epidemiol 2014;17(4):938–53.
7. Mendonça G, Florindo AA, Rech CR, Freitas DKS de, Farias Júnior JC de. Per-ceived neighborhood environmental characteristics and different types of physical activity among Brazilian adolescents. J Sports Sci 2018;36(9):1068–75.
8. Farias Júnior JC de, Reis RS, Hallal PC. Physical activity, psychosocial and perceived environmental factors in adolescents from Northeast Brazil. Cad Saúde Pública 2014;30(5):941–51.
9. Reis RS, Hino AAF, Florindo AA, Añez CRR, Domingues MR. Association between physical activity in parks and perceived environment: a study with ado-lescents. J Phys Act Health 2009;6(4):503–9.
10. Reimers AK, Mess F, Bucksch J, Jekauc D, Woll A. Systematic review on measure-ment properties of questionnaires assessing the neighbourhood environmeasure-ment in the context of youth physical activity behaviour. BMC Public Health 2013;13(1):461.
11. Day K. Physical environment correlates of physical activity in developing countries: a review. J Phys Act Health 2018;15(4):303–14.
12. Ding D, Sallis JF, Kerr J, Lee S, Rosenberg DE. Neighborhood environment and physical activity among youth a review. Am J Prev Med 2011;41(4):442–55.
13. Edwards N, Hooper P, Knuiman M, Foster S, Giles-Corti B. Associations between park features and adolescent park use for physical activity. Int J Behav Nutr Phys Act 2015;12:21.
15. Coledam DHC, Ferraiol PF, Pires Junior R, dos-Santos JW, Oliveira AR de. Prática esportiva e participação nas aulas de educação física: fatores associados em estudantes de Londrina, Paraná, Brasil. Cad Saúde Pública 2014;30(3):533–45.
16. Coledam DHCC, Ferraiol PF, Júnior RP, Gomes Ribeiro EA, Cabral Ferreira MA, de Oliveira AR. Concordância entre dois pontos de corte para atividade física e fatores associados em jovens. Rev Paul Pediatr 2014;32(3):215–22.
17. Farias Júnior JC, da Silva Lopes A, Mota J, Santos MP, Ribeiro JC, Hallal PC. Perception of the social and built environment and physical activity among North-eastern Brazil adolescents. Prev Med 2011;52(2):114–19.
18. Farias Júnior JC, Florindo AA, Santos MP, Mota J, Barros MVG. Perceived environmental characteristics and psychosocial factors associated with physical activity levels in adolescents from Northeast Brazil: structural equation modelling analysis. J Sports Sci 2014;32(10):963–73.
19. Onishi VL da S, Sanches SP. Percepção dos gestores escolares sobre a utilização da caminhada para acesso à escola. Ciênc Eng 2016;25(1):35–42.
20. Reverdito RS, Costa SVC, de Oliveira EJ, de Oliveira SA, Tolocka RE. Espaços e equipamentos disponíveis para o lazer: possibilidades da criança ao jogo na cidade de Hortolândia-SP. Licere 2012;15(3):1-24.
21. Lima AV, Fermino RC, Oliveira MP, Rodriguez Añez CR, Reis RS. Distância percebida até as instalações de lazer e sua associação com a prática de atividade física e de exercícios em adolescentes de Curitiba, Paraná, Brasil. Cad Saúde Pública 2013;29(8):1507–21.
22. Silva ICM, Hino AA, Lopes A, Ekelund U, Brage S, Gonçalves H, et al. Built environment and physical activity: domain- and activity-specific associations among Brazilian adolescents. BMC Public Health 2017;17(1):616.
23. Santos MS, Fermino RC, Reis RS, Cassou AC, Rodriguez Añez CR. Barriers related to physical activity practice in adolescentes: a focus-group study. Rev Bras Cineantropom Desempenho Hum 2010;12(3):137–43.
24. Dambros DD, Lopes LFD, Santos DL dos. Barreiras percebidas e hábitos de atividade física de adolescentes escolares de uma cidade do sul do Brasil. Rev Bras Cineantropom Desempenho Hum 2011;13(6):422–8.
25. Copetti J, Neutzling MB, da Silva MC. Barreiras à prática de atividades físi-cas em adolescentes de uma cidade do sul do Brasil. Rev Bras Ativ Fís Saúde 2012;15(2):88–94.
26. Santos MS, Hino AAF, Reis RS, Rodriguez-Añez CR. Prevalência de bar-reiras para a prática de atividade física em adolescentes. Rev Bras Epidemiol 2010;13(1):94–104.
27. Parra DC, McKenzie TL, Ribeiro IC, Ferreira Hino AA, Dreisinger M, Coniglio K, et al. Assessing physical activity in public parks in Brazil using systematic observation. Am J Public Health 2010;100(8):1420–6.
28. Hino AAF, Reis RS, Ribeiro IC, Parra DC, Brownson RC, Fermino RC. Using observational methods to evaluate public open spaces and physical activity in Brazil. J Phys Act Health 2010;7(Suppl 2):146–54.
29. Silva KS, Vasques DG, Martins C de O, Williams LA, Lopes AS. Active commuting: prevalence, barriers, and associated variables. J Phys Act Health 2011;8(6):750–7.
30. Ceschini FL, Andrade DR, Oliveira LC, Araújo Júnior JF, Matsudo VKR. Prevalência de inatividade física e fatores associados em estudantes do ensino médio de escolas públicas estaduais. J Pediatr 2009;85(4):301–6.
31. Brasil. Ministério da Saúde. Secretaria de Vigilância em Saúde. Departamento de Análise de Situação em Saúde. Avaliação de Efetividade de Programas de Atividade Física no Brasil. Brasília: Ministério da Saúde; 2011.
CORRESPONDING AUTHOR Sofia Wolker Manta
Campus Universitário Reitor João David Ferreira Lima, Coordenadoria de Pós-Graduação em Educação Física, s/n. Bairro Trindade, Florianópolis, Santa Catarina, Brazil. Zip code: 88040-900.
E-mail: [email protected]
33. Ferrari GL de M, Matsudo V, Barreira TV, Tudor-Locke C, Katzmarzyk PT, Fis-berg M. Correlates of moderate-to-vigorous physical activity in Brazilian children. J Phys Act Health 2016;13(10):1132–45.
34. Echeverria SE, Kang AL, Isasi CR, Johnson-Dias J, Pacquiao D. A community survey on neighborhood violence, park use, and physical activity among urban youth. J Phys Act Health 2014;11(1):186–94.
35. Smith G, Cirach M, Swart W, Dėdelė A, Gidlow C, van Kempen E, et al. Char-acterisation of the natural environment: quantitative indicators across Europe. Int J Health Geogr 2017;16(1):16.
36. Reichert FF, Barros AJD, Domingues MR, Hallal PC. The role of perceived personal barriers to engagement in leisure-time physical activity. Am J Public Health 2007;97(3):515–9.
37. Minayo MC de S. O desafio do conhecimento: pesquisa qualitativa em saúde. 9ª ed. Saõ Paulo: Hucitec; 2006. 406p.
38. Martins M de O, Petroski EL. Mensuração da percepção de barreiras para a prática de atividades físicas: uma proposta de instrumento. Rev Bras Cineantropom Desempenho Hum 2000;2(1):58–65.
39. Júnior F, De JC, Lopes A da S, Reis RS, Nascimento JV do, Borgatto AF, et al. Development and validation of a questionnaire measuring factors associated with physical activity in adolescents. Rev Bras Saúde Materno Infant 2011;11(3):301–312.