Food Science and Technology
OO:
D https://doi.org/10.1590/fst.08617
OSSN 0101-2061 (Print) OSSN 1678-457X (Online)
1 Introduction
Celiac disease is caused by a permanent intolerance to a kind of proteins (prolamins) which are present in cereals like wheat, oats, rye and barley. On general, the gluten-free flours and starches are refined (Huerta et al., 2016), so they lose nutritional value at the expense of protein (O’Shea et al., 2014) vitamins, minerals, and fiber. The incorporation of new raw materials for the production of gluten-free bakery products improves the dietary contribution of all or some of these macro and micronutrients. One of these new alternatives is the Prosopis nigra flour, since it is a noble product, which not contains toxic prolamins, and is rich in proteins, fiber, and minerals (Galán et al., 2008; Trevisson, 1992), contributing to the integral dietary treatment of the celiac disease. Moreover, Prosopis nigra flour is a non-traditional ingredient of regional production with distinctive sensory attributes that would make it possible to produce innovative and consumer-acceptable products, since it gives a characteristic flavor and color, similar to chocolate or coffee (Margalef et al., 2012). On addition, making bread with addition of Prosopis nigra flour would be a strategy to increase the added value of this natural resource of Northwest and Northeast of Argentina.
The production of gluten-free bread implies a technological issue (Segura & Rosell, 2011), and for this reason, much researches have been conducted to improve the quality of gluten-free breads, and additives such as xanthan gum (XG) and whey concentrate
(WC) are very often used. These additives favor the formation of a structure to contain the gases generated during fermentation and baking, simulating the functions of gluten (Kittisuban et al., 2014; Nunes et al., 2009; Sciarini et al., 2012; Lazaridou et al., 2007). On addition, the whey concentrate could contribute to improve the quantity and quality of bread proteins, thus helping to maintain the nutritional status of the celiac person. Ot should be considered that studied product would be recommended for consumption to celiac persons in the maintenance stage and for the general population.
The hedonic response is related to the technological quality of the product and therefore has been extensively studied in gluten free bread products. On the present study, global acceptability and acceptability by attributes in celiac and non-celiac consumers were measured, since the product is recommended for the entire population. On this regard, it is important to take as a reference that other authors consider that gluten-free formulations that reach hedonic scores equal or greater than 5 (measured at 9-point scales), should be considered very acceptable (Kittisuban et al., 2014; Lazaridou et al., 2007).
Therefore, the present work has as main objective to know the nutritional contribution of gluten-free bread made with
Prosopis nigra flour, and the acceptability measured by celiac and non celiac persons.
Chemical composition, percent of dietary reference intake, and acceptability of
gluten‑free bread made from
Prosopis nigra
flour, added with hydrocolloids
Ana Gabriela TORRELOO MARTOS1, Estela Patricia LÓPEZ2,3*
Received 15 Mar., 2017 Accepted 18 July, 2018
1 Facultad de Ciencias de la Salud, Universidad Nacional de Salta, Salta, Argentina
2 Centro de Investigaciones y Transferencia de Jujuy – CIT-Jujuy, Consejo Nacional de Investigaciones Científicas y Técnicas – CONICET, Universidad Nacional de Jujuy, San
Salvador de Jujuy, Jujuy, Argentina
3 Instituto de Investigaciones Sensoriales de Alimentos – IISA, Universidad Nacional de Salta, Salta, Argentina
Corresponding author: [email protected] Abstract
The objective of the work was to know the nutritional contribution of gluten-free bread made with Prosopis nigra flour, and the acceptability measured by celiac and non celiac persons. Gluten-free bread was made from a mixture of corn, rice and
Prosopis nigra flours. To achieve better technological characteristics, xanthan gum and whey concentrate were added. A portion of bread (50g) provided 19% of DRO for protein for children aged 4 to 8 years, while for a pregnant or lactating woman, this value reached 5%. Regarding the fibers, 50g of bread covered 16% and 14% of the DRO for these biological moments. The fat requirement was covered by 16% for all biological moments analyzed. The dietary contribution of this bread surpasses in proteins and fiber to the commercial ones. Bread made with Prosopis nigra flour presented a balanced caloric distribution, contributing a high proportion of proteins, fats, dietary fiber (mainly of the insoluble fraction), and low quantity of carbohydrates available, characteristics that make it a recommendable product for celiac persons in different biological moments.
Keywords:Prosopis nigra; gluten-free; bread; Percent Dietary Reference Ontakes (DRO); acceptability.
2 Materials and methods
2.1 Materials
The bread was made from the mixture of three gluten-free flours: maize (55 g/100 g blend), rice (43 g/100 g blend) and
Prosopis nigra flour (2 g/100 g blend). All the flours were provided by Dietética Científica, Buenos Aires, Argentina. The Table 1 summarizes the flours chemical composition.
On addition, the following gluten-free ingredients were used for the formulation: high oleic sunflower oil (Molinos Cañuelas, Argentina), Whole Milk (Sancor, Argentina), whole fresh egg, sugar type A (Ongenio Rio Grande, La Mendieta, Jujuy, Argentina), Salt (TOMBO S.A., Argentina), instant powder yeast (Lesaffre S.A., Argentina).
Moreover, the bread was elaborated with addition of hydrocolloids: xanthan gum (XG) (Fufeng, Group Company Limited, China) and whey protein concentrate (WPC) (Milkaut, Argentina), in a proportion of 2% w/w of flours mix each.
2.2 Methods
Chemica l composition and caloric value of gluten-free flours
Moisture, ash, crude fat and proteins were analyzed following the Association of Official Analytical Chemists (1990) methods 925.09, 923.03, 922.06, 991.20 respectively. Total dietary fiber (TDF) and soluble and insoluble fractions were analyzed by enzymatic-gravimetric method (Association of Official Analytical Chemists, 1990). The digestible carbohydrates content was calculated by difference (Equation 1). Protein content was calculated using a 5.7 conversion factor. Three replicates for each sample were carried out.
( )
/ 100 100 moisture ash protein
Digestible carbohydrates g g
crude fat TDF
+ + +
= − +
(1)
The total calorific value was obtained by summing the resulto of the multiplication of the mean values of digestible carbohydrates and protein by 4, and the mean value of lipids by 9 (Atwater factors) (Souci et al., 2000).
Baking test
Ongredients were mixed (15 min), kneaded and rolled in the commercial bread maker machine (Moulinex – home bread). The dough was fermented (27C-95 min), kneaded (30 min), and it was baked at 150 °C for 60 min. Finally, the breads were cooled to room temperature (120 min).
Chemical composition and calorific value of gluten-free bread
Gluten-free bread pieces were analyzed to determine moisture, ash, crude fat and proteins were analyzed following the Association of Official Analytical Chemists (1990) methods 925.09, 923.03, 922.06, 991.20 respectively. Total dietary fiber (TDF) and soluble and insoluble fractions were analyzed by enzymatic-gravimetric method (Association of Official Analytical Chemists, 1990). The carbohydrate content was calculated by difference (Equation 1). Protein content was calculated using a 6.25 conversion factor. Three replicates for each analysis were carried out.
The calorific value was calculated in the same way previously described in item 2.2.1.
Percent of the Dietary Reference Intakes (%DRI)
For the calculation of %DRO, Equation 2 was applied. The reference values correspond to the Dietary Reference Ontake for Energy, Carbohydrates, Fibers, Fats and Proteins (National Academy of Science, 2005), published by the Onstitute of Medicine of the National Academies. The calculations were performed in a differentiated way according to the requirements of adult man, adult woman, child of 4 to 8 years and woman in pregnancy or lactation.
Ot was considered that a serving of bread is equivalent to 50 g of product.
( )
%DRI= B*100 /DRI (2)
were:
B = g of carbohydrate or protein or fat or fiber provided by a serving of bread.
DRO = recommended intake (g/day) of carbohydrate or protein or fat or fiber.
% = percentage of the DRO covered by a serving of bread
Acceptability
Overall acceptability and for attributes (texture, taste and color) were measured by 55 consumers (31 to 40 years old, 67% female), of whom 27 were people with a diagnosis of celiac disease at the time of the study, and 28 were non celiac persons. To determine the overall hedonic score and for each of the attributes, we worked with a hedonic scale of seven points, where 1 = “O dislike much” and 7 = “O like it a lot”.
2.3 Statistical analyses
The data were organized in the form of tables and figures. The data are presented with mean values and standard deviations. To detect significant differences between the means of the acceptability
Table 1. Chemical composition (g/100g) and calorific value (kcal/100g) of corn, rice and Prosopis nigra flours.
FLOUR Prosopis nigra Rice Corn
Moisture* 10.1±0.4 9.9±0.2 10.2±0.0
Ash* 2.9±0.0 1.8±0.0 1.6±0.03
Carbohydrates* 62.7±0.4 83.7±0.1 70.1±0.2
Protein* 13.0±0.1 3.1±0.1 8.1±0.0
Crude fat* 4.8±0.2 0.7±0.0 2.8±0.1
TDF* 16.6±0.1 1.2±0.1 7.3±0.1
Soluble fraction* 6.1±0.0 0.4±0.0 2.5±0.1 Onsoluble fraction* 10.5±0.1 0.8±0.0 4.8±0.0 Calorific value
(kcal/100g)
346 353 338
variable, one-way ANOVA was applied. The comparison between the mean values was performed applying Tukey HSD test, taking as significance level p <0.05. For calculations, Microsoft Excel 2010 and OnfoStat 2016e were used.
3 Results and discussion
3.1 Chemical composition of gluten-free flours
The Table 1 summarizes the data of the chemical composition of the gluten-free flours used in this work.
Prosopis nigra flour is rich in monosacharides and disaccharides such as fructose, glucose and sucrose (40-50%), which confer the characteristic sweet taste to the flour (Tucci, 2014; Margalef et al., 2012), and convert it into high-energy food (346 kcal/100 g - Table 1). The prosopis nigra flour provides an important contribution of proteins (13.0 ± 0.1 g/100 g) (Table 1), which must be supplemented with cereals to improve the profile of essential amino acids. Regarding fats, this flour provides a moderate amount (4.8 ± 0.2 g/100 g), and excellent quality. Other authors reported the presence of essential fatty acids, mainly linoleic and oleic (Tucci, 2014; Margalef et al., 2012). On relation to the fiber, the Prosopis nigra flour contributes approximately 16.6 ± 0.1 g/100 g, with predominance of the insoluble fraction (Table 1). Ot also has other polysaccharides such as galactomannans and lignin that confer potential as a prebiotic for the intestinal flora (Tucci, 2014; Margalef et al., 2012).
On Rice flour, the carbohydrates are the most abundant constituents, with an approximate starch content of 84 g/100 g (Table 1). The starch determines the properties and functionality of this flour, and these are dependent on the amylose / amylopectin ratio (60/40) (León & Rosell, 2007). Protein is the second constituent in rice flour, although it is one of the protein poorest cereals (3.1 ± 0.1 g/100 g) (Table 1). The lipid and TDF contents are lower than the Prosopis nigra flour (Table 1), but both nutrients play a very important role in the sensory and functional characteristics of rice flour: the lipids associated to the starch significantly affect the pasting properties and other functional characteristics of the rice starch (León & Rosell, 2007).
Corn flour contains 70% starch and 8% protein (Table 1). The fat and TDF contents were moderate. Corn flour is used to make cookies, biscuits, corn bread, meat emulsions, etc., giving a particular texture to gluten-free products.
Corn flour is one of the least-favored by-products of the grain. However, it is used in the manufacture of cookies, biscuits, cornbread, meat emulsions, etc., giving a particular texture to gluten-free products (León & Rosell, 2007; Onternational Life Sciences Onstitute, 2006). Ot contains 70% starch and 8% protein (Table 1). The fat content is moderate, mainly providing linoleic acid (Omega 6) (León & Rosell, 2007). Since it is a whole meal, the TDF contribution was 7.3 ± 0.1 g/100 g, with predominance of the insoluble fraction (Table1).
3.2 Chemical composition and calorific value of gluten-free bread
Next, Table 2 shows the results of the chemical composition of bread, and Figure 1 presents the caloric distribution of the
Prosopis nigra gluten-free bread.
The energy intake of 100 g of bread was 231 kcal (caloric density = 2.31 kcal/g) (Table 2), with a balanced caloric distribution (Figure 1).
The bread provided 7.5 ± 0.1 g/100 g of proteins (13.7 g/100 g d.b.). This value far exceeded those published by Segura & Rosell (2011) when analyzing the average composition of eleven commercial gluten-free breads, and by Ledesma & Milde (2010) and Yazynina et al. (2008). These authors observed that gluten-free loaves generally have very low protein content, which ranged from 2.5 to 6.8/100 g (d.b.). This was due to the use of starches (maize, potato, cassava, rice) as the main ingredient in the production of most commercial breads, (Segura & Rosell, 2011). Unlike them, Prosopis nigra bread was made from three flour mixture, with addition egg, milk and WC, which favored protein intake.
Related to fats, the gluten-free bread contributed 9.9 ± 0.1 g/100 g (18.2 g/100 g d.b.), exceeding the values published by other authors, which varied between 1.6 and 11.1 g/100 g d.b. (Segura & Rosell, 2011; Ledesma & Milde, 2010; Del Castillo et al., 2009; Yazynina et al., 2008). This result may be due to the fact that, unlike other formulations, whole flours (no starches), egg, whole milk and whey concentrate were used in this study.
Figure 1. Percentages of Total Caloric Value, covered by carbohydrates, proteins and fats.
Table 2. Chemical composition of gluten-free bread made with Prosopis nigra flour and addition of whey concentrate and xanthan gum.
Bread* g/100g
w.b. d.b.
Carbohydrates† 27.9** 51.2
Protein 7.5±0.1 13.7
Crude Fat 9.9±0.1 18.2
TDF 7.9±0.4 14.4
SDF 1.1±0.1 2.1
IDF 6.7±0.3 12.4
Ash 1.3±0.1 2.4
Moisture 45.5±0.1
The bread with Prosopis nigra flour presented 1.3 ± 0.1 g/100 g (2.4 g/100 g d.b.) for ashes (Table 2), similar to those reported for the average composition of commercial gluten-free breads by Segura & Rosell (2011), Del Castillo et al. (2009), and Ledesma & Milde (2010) (2.9 ± 0.1 g/100 g d.b., 2.1 ± 0.1 g/100 g d.b., and 1.6 to 2.4 g/100 g d.b., respectively). Ot should be noted that in the bread studied in this work, flours were used that provide minerals of the grain´s pericarp, milk and low amount of sodium chloride (ClNa: 2% w/w of flour mixture), unlike commercial breads where most of the minerals were supplied by ClNa, raising agents, and chemical preservatives (Segura & Rosell, 2011).
The amount of total dietary fiber (TDF) provided by bread with addition of Prosopis nigra was 7.9 g/100 g (14.4 g/100 g d.b.) (Table 2). This value far exceeds those published by Ledesma & Milde (2010) (0.7-3.4 g/100 g), Del Castillo et al. (2009) (1.8±0.1 g/100 g) and Thompson (2000) (1.2-5.6/100 g). Segura & Rosell (2011) found similar values (3.6-7.2 g/100 g) to those of the present study, but differed in the proportion of soluble and insoluble fibers. Prosopis nigra bread with addition of WC and XG, resulted in higher total fiber content due to the use of whole flours and the addition of the hydrocolloid. On general, the literature emphasizes that gluten-free breads provide a good amount of fiber, especially the soluble fraction, by the addition of hydrocolloids such as xanthan gum, guar gum, CMC, HPMC, pectin or a combination thereof. (Segura & Rosell, 2011; Korus et al., 2009). The non-addition of gums is reflected in a significant drop in the fiber supply: Ledesma & Milde (2010), reported values for TDF of 0.7 to 3.4 g/100 g in breads with mixtures of cassava flour and starch.
On the present investigation, the soluble fiber fraction was 1.1g/100 g (2.1 g/100 g d.b.), being lower than the values published by Segura & Rosell (2011) for most of the commercial gluten-free breads studied (2.5-4.3 g/100 g), and higher than those reported by Korus et al. (2009) (1.2-1.5 g/100 g d.b.). As mentioned previously, the commercial breads have soluble fibers provided by the gums used as technological improvers, but in the case of the bread elaborated in this study, the contribution in soluble
fibers could come from xanthan gum and galactomannans of the flour (although they are in small proportion).
Onsoluble dietary fiber (ODF) represented the predominant fraction in the sample studied (6.7 g/100 g, 12.4 g/100 g d.b.), which far exceeded the values reported in the literature (1.5-4.3 g/100 g d.b., and 2.8-4.9 g/100 g d.b., Segura & Rosell, 2011 and Korus et al., 2009, respectively), since mixtures of starches or modified starches were used for gluten-free bakery. The ODF contribution of corn, rice and Prosopis nigra flours was responsible for this result, in addition to the possible existence of resistant RS3 starch, formed from retrograded starches. Segura & Rosell (2011) pointed out that only one of the commercial breads exceeded the average in ODF, reaching 4.3 g/100 g (d.b.), because maize flour was added to the formulation.
Only for comparison purposes, it is important to note that wheat bread provides 0.8, 3.1, and 3.8 g/100 g of ODF, SDF and TDF respectively (Saura-Calixto et al., 2000).
On relation to carbohydrates, bread with Prosopis nigra flour provided 27.9 g/100 g (51.2 g/100 g d.b.) (Table 2), which was markedly lower than that found in the literature (75.6-92.5 g/100 g, according to Segura & Rosell, 2011, and 41.9 g/100 g according to Del Castillo et al., 2009). The marked difference in the amount of available carbohydrates (starch and sugars) compared to other gluten free breads is explained by the nature of the ingredients used. The low proportion of available carbohydrates is relevant to recommend the consumption of this bread for other population groups, with different non-communicable chronic diseases.
The bread made for this study will be recommended for celiac people in asymptomatic period (without distention and / or diarrhea) and with good recovery of the intestinal functioning, since the bread contains fibers and lactose.
3.3 Percentage of the dietary reference intake.
Given the particularities in the chemical composition, this bread can be recommended for celiac and non-celiac people at different biological moments. Therefore, the percentage of the Dietary Reference Ontakes (% DRO) (Table 3) and, additionally,
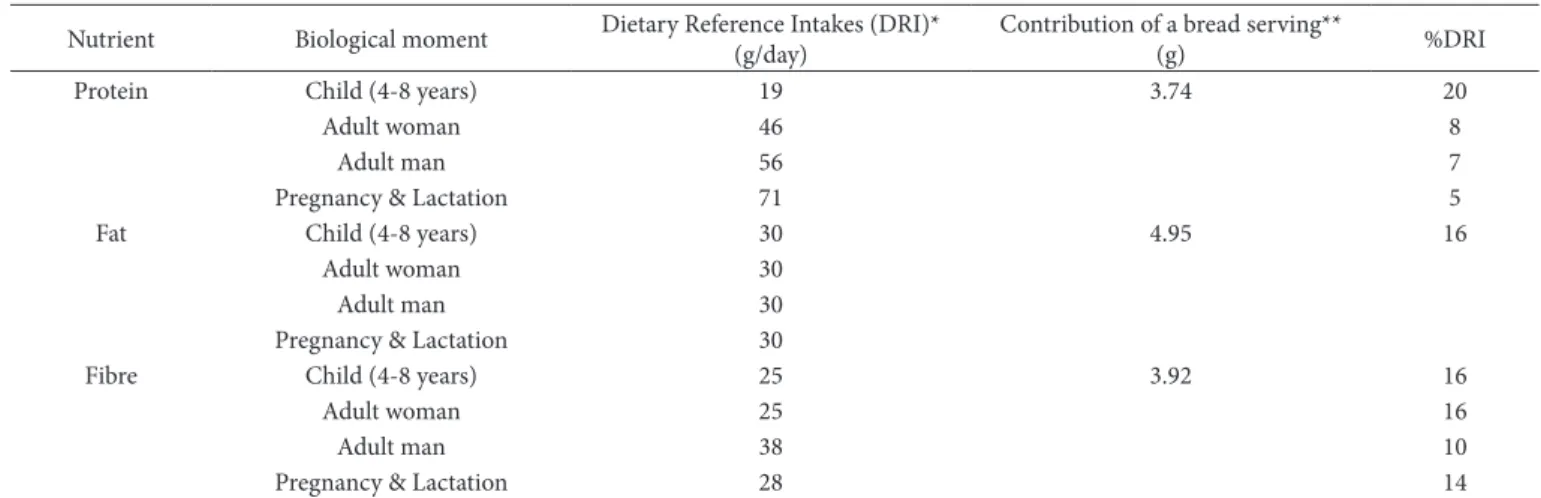
Table 3. Dietary Reference Ontakes (% DRO) for protein, fat and fiber covered by a portion (50g) of bread made with Prosopis nigra flour and addition of whey concentrate and xanthan gum, according to biological moments.
Nutrient Biological moment Dietary Reference Ontakes (DRO)* (g/day) Contribution of a bread serving**(g) %DRO
Protein Child (4-8 years) 19 3.74 20
Adult woman 46 8
Adult man 56 7
Pregnancy & Lactation 71 5
Fat Child (4-8 years) 30 4.95 16
Adult woman 30
Adult man 30
Pregnancy & Lactation 30
Fibre Child (4-8 years) 25 3.92 16
Adult woman 25 16
Adult man 38 10
Pregnancy & Lactation 28 14
the Percent Daily Value (% DV) (Table 4) covered by a 50g portion of bread, are analyzed. Regarding proteins, a portion of bread with Prosopis nigra flour, covers 20% of the DRO for children between 4 and 8 years old, a relevant fact considering that this age group presents great need of this nutrient because it is in the growth stage.
The %DRO covered by a serving of bread, for adult men and women varies from 7% to 8% (Table 3), which represents a significant contribution, based on the estimate that the average bread consumption is 200 g/day (Lezcano, 2011). For the pregnant or breastfeeding woman, the protein contribution drops to 5%. However, for these biological moments it is important to recommend high biological quality proteins from other food sources that complement the diet.
The fat contribution reached 16% (Table 3), so it would be important to determine and differentiate the proportion saturated and unsaturated fats to recommend their consumption in people with pathologies related to fat metabolism.
On relation to TDF, the bread studied would contribute more than 10% of the DRO for all biological moments analyzed, which was considered appropriate, since traditional wheat bread only provides between 4 and 6% of the reference intakes (Oshida & Steel, 2014). On addition, daily consumption of vegetables, fruits and whole grains should be recommended to achieve an adequate supply of fibers.
Additionally, Table 4 presents the percent of Daily Value (% DV) covered by a portion of bread. This %DV was calculated since it represents one of the necessary requirements for nutritional labeling in Argentina.
A Prosopis nigra bread serving covers 6% of the energy value (Table 4). Ledesma & Milde (2010) found that a bread of corn and soybean flour and cassava starch, contributed 10% of the DV, and the difference was due to the fact that it provided more available carbohydrates than the Prosopis nigra bread.
The 5% of the DV was covered by proteins, a proportion almost identical to that published by Ledesma & Milde (2010) (4.5%). Ot should be noted that the percent Daily Value for proteins was markedly lower than that discussed above for DRO (Table 3). This difference was simply due to the fact that the DRO considers different recommendations according to the biological moment (being higher for the pregnant and breastfeeding woman), and the Daily Values are a reference used in nutritional labeling, and are calculated based on a diet of 2000 kcal.
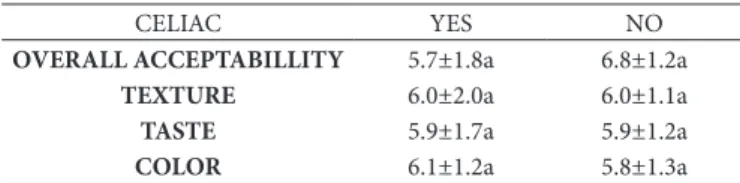
Table 5 presents the results referring to global acceptability and for attributes, whether this has been measured by celiac or non-celiac consumers.
Ot should be noted that no differences were detected when comparing the scores recorded for the bread by celiac and non-celiac consumers (p <0.05), which means that the product was equally pleasing for both population groups. This is a very relevant fact, since were expected that non-celiac consumers attribute lower scores, since perhaps the samples did not have the likely characteristics for them. On turn, the celiac participants gave very good scores to the product, which become relevant since that it is a very demanding population group, and also
because in general, the gluten-free breads are considered of low technological quality (Gallagher et al., 2004).
Ot is noteworthy that other authors consider that gluten-free formulations that achieve hedonic scores equal to or greater than 5 (measured in 9-point scales), should be considered very acceptable (Kittisuban et al., 2014; Lazaridou et al., 2007). This confirms that the loaves with Prosopis nigra flour, achieved excellent scores. Regarding what was reported in other investigations, Kittisuban et al. (2014), found that breads made with rice starch, yeast β-glucans, HPMC and whey protein concentrate showed a general acceptability of 5.7±1.3 on the 9-point hedonic scale; whereas Lazaridou et al. (2007), observed that the bakeries of rice flour, corn starch and sodium caseinate presented a score of 6.5 on a 9-point scale, increasing to 7 by adding 2% of xanthan gum and decreasing to 6.2 by adding 1% of this hydrocolloid.
4 Conclusions
A portion of bread (50 g) provided 19% of DRO for protein for children aged 4 to 8 years, while for a pregnant or lactating woman, this value reached 5%. Regarding the fibers, a serving of bread covered 16% and 14% of the DRO for these biological moments. The fat requirement was covered by 16% for all biological moments analyzed.
As for the percent daily value, one serving of gluten-free bread covered 6% of energy, 5% of protein, 6% of fats and 16% of fiber.
The dietary contribution of this bread surpasses in proteins and fiber to the commercial ones.
Table 5. Acceptability (general and for attributes) for gluten free bread made with Prosopis nigra flour and addition of whey concentrate and xanthan gum.
CELOAC YES NO
OVERALL ACCEPTABILLITY 5.7±1.8a 6.8±1.2a
TEXTURE 6.0±2.0a 6.0±1.1a
TASTE 5.9±1.7a 5.9±1.2a
COLOR 6.1±1.2a 5.8±1.3a
Mean values ± Standard deviations. CELOAC YESO (n=27) – CELOAC NO (n=28). Different letters in the rows correspond to significant difference (p<0.05).
Table 4. Percent of Daily Reference Values (% DV) for calories, carbohydrates, proteins, fats and fiber, covered by one serving (50g) of gluten-free bread made with Prosopis nigra flour and addition of whey concentrate and xanthan gum.
Percent Daily Value*
Contribution of a
bread serving** %DV
Energetic value 2000kcal 115kcal 6
Carbohydrates 300g 13.93g 5
Proteins 75g 3.74g 5
Fat 55g 4.95g 9
Fibre 25g 3.92g 16
The general acceptability was close to 6 points (O like), and it did not differentiate between celiac and non-celiac consumers. The attributes did not present differences.
On conclusion, the bread made with Prosopis nigra flour presented high acceptability, a balanced caloric distribution, contributing a high proportion of proteins, fats, dietary fiber (mainly of the insoluble fraction), and low quantity of carbohydrates available, characteristics that make it a recommendable product for celiac persons in different biological moments.
References
Argentina. Ministerio de Salud. Administración Nacional de Medicamentos, Alimentos y Tecnología Médica –ANMAT. (2006). Nuevo Rotulado nutricional. Buenos Aires: ANMAT. Retrieved from: www.anmat. gov.ar/consumidores/Rotulado_nutricional.pdf
Association of Official Analytical Chemists – AOAC. (1990). Official methods of Analysis of the AOAC (Vol. 2. 15th ed.). Arlington: AOAC. Del Castillo, V., Lescano, G. R., & Armada, M. (2009). Formulación de
alimentos para celíacos con base en mezclas de harinas de quinoa, cereales y almidones. Archivos Latinoamericanos de Nutricion, 59(3), 332-336. PMid:19886520.
Galán, A. G., Corrêa, A. D., Abreu, C. M., & Barcelos, M. F. (2008). Caracterización química de la harina del fruto de Prosopis spp. procedente de Bolivia y Brasil. Archivos Latinoamericanos de Nutricion, 58(3), 309-315. PMid:19137996.
Gallagher, E., Gormley, T. R., & Arendt, E. K. (2004). Recents advances in the formulation of gluten-free cereal-based products. Trends in Food Science & Technology, 15(3-4), 143-152. http://dx.doi. org/10.1016/j.tifs.2003.09.012.
Huerta, K., Alves, J., Silva, A., Kubota, E., & Rosa, C. (2016). Sensory response and physical characteristics of gluten-free and gum-free bread with chia flour. Food Science and Technology (Campinas), 36(Suppl. 1), 15-18. http://dx.doi.org/10.1590/1678-457X.0032. Onternational Life Sciences Onstitute – OLSO. Asociación Maíz y Sorgo
Argentino – MAOZAR. (2006). Maíz y Nutrición (Vol. 2, p. 80). Buenos Aires: MAOZAR. Retrieved from http://www.maizar.org. ar/pdf/Revista%20maizar%202.pdf
Oshida, P. M., & Steel, C. J. (2014). Physicochemical and sensory characteristics of pan bread samples available in the Brazilian market. Food Science and Technology (Campinas), 34(4), 746-754. http://dx.doi.org/10.1590/1678-457X.6453.
Kittisuban, P., Ritthiruangdej, P., & Suphantharika, M. (2014). Optimization of hydroxyproylmethylcellulose, yeast β-glucan, and whey protein levels based on physical properties of gluten-free rice bread using response surface methodology. Lebensmittel-Wissenschaft + Technologie, 57(2), 738-748. http://dx.doi.org/10.1016/j.lwt.2014.02.045. Korus, J., Witczak, M., Ziobro, R., & Juszczak, L. (2009). The impact of
resistant starch on characteristics of gluten-free dough and bread.
Food Hydrocolloids, 23(3), 988-995. http://dx.doi.org/10.1016/j. foodhyd.2008.07.010.
Lazaridou, A., Duta, D., Papageorgiou, M., Belc, N., & Biliaderis, C. G. (2007). Effects of hydrocolloids on dough rheology and bread quality parameters in gluten-free formulations. Journal of Food Engineering, 79(3), 1033-1047. http://dx.doi.org/10.1016/j.jfoodeng.2006.03.032. Ledesma, E. S., & Milde, L. B. (2010). Composición química de panes de fécula de mandioca suplementados con diferentes aditivos. Revista de Ciencia y Tecnología, 14, 43-48.
León, A. E., & Rosell, C. (2007). De Tales Harinas, Tales Panes: granos, harinas y productos de panificación en Iberoamérica. (1a ed.). Córdoba: Hugo Báez Editor. p. 480.
Lezcano, E. P. (2011). Productos panificados. Cadenas alimentarias.
Alimentos Argentinos, 51, 26-38.
Margalef, M. O., Tóffoli, S. L., Burgos, V. E., Campos, A., Valdez Clinis, G. A., & Jiménez, M. J. (2012). Algarroba Negra (Prosopis nigra): caracterización fisicoquímica y elaboración de productos dietéticos.
Revista de la Facultad de Ciencias de la Salud, 1(2), 14-19. Retrieved from: http://fsalud.unsa.edu.ar/salud/descargas/revista/REVOSTA2.pdf National Academy of Science. Onstitute of Medicine. (2005). Dietary
Reference Intakes for energy, carbohydrate, fiber, fat, fatty acids, protein, and amino acids (Macronutrients). Washington D.C.: NAP. Retrieved from: https://www.nap.edu/search/?term=Dietary+Refe rence+Ontakes+for+Energy%2C
Nunes, M. E., Ryan, L. A. M., & Arendt, E. K. (2009). Effect of low lactose dairy powder addition on the properties of gluten –free batters and bread quality. European Food Research and Technology, 229(1), 31-41. http://dx.doi.org/10.1007/s00217-009-1023-2. O’Shea, N., Arendt, E., & Gallagher, E. (2014). State of the art in
gluten-free research. Journal of Food Science, 79(6), 1067-1076. http://dx.doi. org/10.1111/1750-3841.12479. PMid:24784553.
Saura-Calixto, F., Garcia-Alonso, A., Goñi, O., & Bravo, L. (2000). On vitro determination of the indigestible fraction in foods: an alternative to dietary fiber analysis. Journal of Agricultural and Food Chemistry, 48(8), 3342-3347. http://dx.doi.org/10.1021/jf0000373. PMid:10956113.
Sciarini, L. S., Ribotta, P. D., León, A. E., & Pérez, G. T. (2012). Oncorporation of several additives into gluten free breads: Effect on dough properties and bread quality. Journal of Food Engineering, 111(4), 590-597. http://dx.doi.org/10.1016/j.jfoodeng.2012.03.011. Segura, M. E., & Rosell, C. M. (2011). Chemical composition and starch digestibility of different gluten-free breads. Plant Foods for Human Nutrition (Dordrecht, Netherlands), 66(3), 224-230. http://dx.doi. org/10.1007/s11130-011-0244-2. PMid:21769691.
Souci, S. W., Fachman, H., & Kraut, E. (2000). Foods composition and nutrition tables Stuttgart: Medpharm GmbH Scientific Publishers. p. 1182.
Tavares, B., Silva, E., Silva, V., Soares, M. Jr, Oda, E., & Damiani, C. (2016). Stability of gluten free sweet biscuit elaborated with rice bran, broken rice and okara. Food Science and Technology (Campinas), 36(2), 296-303. http://dx.doi.org/10.1590/1678-457X.0083. Thompson, T. (2000). Folate, iron, and dietary fiber contents of the
gluten-free diet. Journal of the American Dietetic Association, 100(11), 1389-1396. http://dx.doi.org/10.1016/S0002-8223(00)00386-2. PMid:11103663.
Trevisson, M. (1992). Evaluación Nutricional de Frutos de Tres Especies de Algarrobos (Tesis de grado). Facultad de Ciencias Exactas, Física y Naturales, Universidad Nacional de Córdoba, Argentina. Retrieved from: www.fao.org/docrep/006/ad314s/ad314s07.htm
Tucci, J. R. (2014). Algarroba: usos y propiedades. Santa Fe: OATENA. Retrieved from: http://www.iatena.com.ar/articulos/dietetica/la-algarroba-usos-y-propiedades/