• Nenhum resultado encontrado

Performance of low phosphorus tolerant rice genotypes under drought stress

N/A
N/A
Protected

Academic year: 2019

Share "Performance of low phosphorus tolerant rice genotypes under drought stress"

Copied!
8
0
0

Texto

(1)

253 Performance of low phosphorus tolerant rice genotypes under drought stress

Desempenho de genótipos de arroz tolerantes a baixo nível de fósforo sob deficiência hídrica

A identificação de genótipos mais tolerantes à deficiência hídrica e mais eficientes no uso de nutrientes pouco disponíveis no solo é uma importante estratégia de baixo custo para promover a agricultura sustentável em regiões marginalizadas. Neste sentido, foi conduzido um estudo na Plataforma SITIS de Fenotipagem da Embrapa Arroz e Feijão, com o objetivo de avaliar a tolerância à deficiência hídrica de genótipos de arroz de terras altas tolerantes à deficiência de fósforo. O delineamento experimental foi blocos ao acaso, com parcelas subsubdivididas, com duas repetições. Nas parcelas foram estabelecidos dois regimes hídricos (com e sem deficiência hídrica), nas subparcelas dois teores de fósforo no solo (25 e 200 mg dm-3) e nas subsubparcelas 48 genótipos de arroz de terras altas. A deficiência hídrica teve mais impacto na produtividade de grãos do que o suprimento de fósforo. Os genótipos AB 062037, AB 062041, AB 062138, Arroz Mato Grosso, BRA 02601, BRA 052045, CNA 4098, CNA 6187, Guapa, Guaporé e Rio Paranaíba foram classificados no grupo mais produtivo sob ambos regimes hídricos. Os genótipos mais produtivos sob deficiência hídrica apresentaram maior densidade do sistema radicular nas camadas mais profundas do solo. Os genótipos mais produtivos nos dois regimes hídricos foram também aqueles que apresentaram maior transpiração.

Palavras-chave: Oryza sativa L.; estresse abiótico; sistema radicular; evapotranspiração.

ABSTRACT

RESUMO

Performance of low phosphorus tolerant rice genotypes

under drought stress

The identification of genotypes more tolerant to water deficit and more efficient in the use of nutrients little available in the soil is an important low-cost strategy to promote sustainable agriculture in marginalized regions. In this sense, a study was carried out in the SITIS Phenotyping Platform of the Embrapa Arroz e Feijão, with the objective of evaluating the drought tolerance of upland rice genotypes tolerant to phosphorus (P) deficiency. The experimental design was performed in a randomized complete block with split-split plots and two replications. In the plots were established two water regimes (with and without water deficit), in the subplots two soil phosphorus contents (25 and 200 mg dm-3) and in sub-subplots 48 upland rice genotypes. The water deficit had more impact on grain yield than the phosphorus supply. The genotypes AB 062037, AB 062041, AB 062138, Arroz Mato Grosso, BRA 02601, BRA 052045, CNA 4098, CNA 6187, Guapa, Guaporé and Rio Paranaíba were classified in the most productive group under both water regimes. The most productive genotypes under water deficit showed higher root density in the deeper soil layers. The most productive genotypes in the two water regimes were also those that showed the highest transpiration.

Keywords: Oryza sativa L.; abiotic stress; root system; evapotranspiration.

Cleber Morais Guimarães1*, Luís Fernando Stone1, Maria da Conceição Santana Carvalho1, José Manoel Colombari Filho1

10.1590/0034-737X201865030005

licence Creative Commons

Submitted on October 25th, 2016 and accepted on April 13th, 2018.

1Embrapa Arroz e Feijão, Santo Antônio de Goiás, Goiás, Brasil. cleber.guimaraes@embrapa.br; luis.stone@embrapa.br; maria.carvalho@embrapa.br; jose.colombari@embrapa.br

(2)

INTRODUCTION

Upland rice is grown in almost all regions of Brazil and in a wide range of climatic conditions and production systems, covering from large mechanized areas to production systems for subsistence. It is characterized as a sensitive crop to drought stress. According to Guima-rães et al (2016), this situation should worsen with global warming, because the water deficit should be strengthened in areas where it already occurs and emerge in other regions that are not currently subject to this stress.

In the Brazilian savannahs region, where the upland rice is mostly grown, the soils showed low available water capacity, low phosphorus and high aluminum content, which are limiting factors for yield. The availability of phosphorus (P) applied as fertilizer is generally limited, due to the abundance of iron and aluminum oxides in these soils, which makes the phosphorus nutrition a limiting factor to achieving economically satisfactory farm incomes (Costa et al., 2006; Crusciol et al., 2006). In addition, phosphates have achieved high international prices, which has burdened the cost of upland rice production, since we are dependent on its importation.

Considering these aspects, the identification of genotypes more tolerant to water deficit and more efficient in the use of nutrients little available in the soil is an important low-cost strategy to promote sustainable agriculture in marginalized regions (Otani & Ae, 1996). Wissuwa & Ae (2001) confirmed this strategy by transferring the major quantitative trait locus (Phosphorus uptake1 - Pup1) of high capacity of P uptake of the culti-var ‘Kasalath’, tolerant to P deficiency, for modern rice cultivar ‘Nipponbare’, with high harvest index, which tripled its grain yield in conditions of low P availability.

Chin et al. (2010) showed that Pup1 is present in more than 50% of rice accessions adapted to stress-prone environments, whereas it was detected in only about 10% of the analyzed irrigated/lowland varieties. Furthermore, the Pup1 locus was detected in more than 80% of the analyzed drought tolerant rice breeding lines.

A deep root system could improve the adaptation of rice during drought through greater capacity for water extraction, thus maintaining high plant leaf water status (Kamoshita et al., 2004). In addition, a well-developed root system, able to exploit large soil volume, is recognized as one of the most important plant adaptation mechanisms to ensure adequate nutrient uptake (Yang et al., 2004).

In this sense, it was tested the hypothesis that genotypes more efficient in the use of phosphorus are also tolerant to the water deficit and that those with higher root density in depth are more adapted to water deficit periods and low soil P availability. Therefore, this study aimed to identify, among rice genotypes tolerant to P

deficiency, those with tolerance to drought stress, as a low-cost strategy to produce rice in regions of Brazilian savannahs subject to these stresses.

MATERIAL AND METHODS

The study was carried out in a greenhouse, in soil columns, at Embrapa Arroz e Feijão’ SITIS Phenotyping Platform, in Santo Antônio de Goiás, GO. The soil used was an Oxisol, whose chemical analysis showed the following results: pH (H2O) = 5.1; Ca = 5.0 mmolc dm-3; Mg = 4 mmolc dm-3; Al = 2 mmol

c dm

-3; P = 0.4 mg dm-3; K = 39 mg dm-3; Cu = 1.7 mg dm-3, Zn = 1.1 mg dm-3, Fe = 29 mg dm-3, Mn = 19 mg dm-3 and organic matter = 35.2 g kg-1.

The SITIS Phenotyping Platform is a real-time automated control system for monitoring plant physiological parameters, soil moisture, greenhouse climate and irrigation of the soil columns. It is composed of 384 soil columns, packed in PVC pipes with a 0.25 m diameter and 1.00 m height, formed of five rings 0.20 m high connected by duct tape, and placed on digital scales with an irrigation point for each column. The amount of water used by the plants can be monitored in each column by the difference in weight.

The experimental design was performed in a randomized complete block with split-split plots and two replicates. In the plots were established two water regi-mes, in the subplots two soil phosphorus contents and in sub-subplots 48 upland rice genotypes from different origins. Among these, 47 genotypes were tolerant to P-deficient soils by preliminary field trial, and one was not tolerant (Farroupilha), used as a negative check.

In one of the water regimes, genotypes were kept in adequate soil moisture conditions throughout the crop cycle, -0.025 MPa at 0.1 m depth (Pinheiro et al., 2006). In the other, they were kept under these conditions until the beginning of panicle emission (R3 stage), when they were subjected to water deficit, which was maintained until the end of the crop cycle, with daily replacement of 50% of the water lost by evapotranspiration, which was monitored by weighing. The soil P contents were 25 and 200 mg dm -3, stablished in the soil layer of 0-0.2 m depth with necessary supplementation with triple superphosphate.

Three seeds were sown per column and were thinned seven days after emergence, leaving one plant per column. In addition to P fertilization, 1.33 g of KCl and 1.0 g of ammonium sulfate per soil column were applied at sowing and 2 g of ammonium sulfate per column at topdressing, 45 days after emergence.

(3)

decantation. After separation, the roots were recovered from the supernatant in 0.25 mm sieves with a tweezer, and taken to a forced air-circulating oven at 80°C until a constant weight was obtained, to determine its dry matter weight. The root density was obtained by dividing its dry biomass, in mg, by the sample volume, in cm3.

Grain yield and dry biomass of leaves and stems per column, in g, and evapotranspiration after the panicle emission stage, in L per column, obtained by the daily weighing of soil columns, were also determined. Data were submitted to Shapiro-Wilk test to verify the normality of variances. Since the data were parametric, the analysis of variance was used and the means were compared by Scott-Knott’s test. Correlations among all variables were also performed.

RESULTS AND DISCUSSION

Water regimes significantly affected all agronomic traits of the genotypes, except the root density in the 0-0.2 m layer (Table 1). The average grain yields obtained with and without water deficit were 33.4 and 91.0 g per column, the leaf biomasses were 23.8 and 29.3 g per column and the stem biomasses were 46.9 and 61.3 g per column, respectively (Tables 2 and 3). Therefore, the water deficit induced a significant reduction of 63.3%, 18.8% and 23.5% in grain yield and biomass of leaves and stems, respectively.

Water deficit also induced reductions in root density, which were of 13.1%, 13.3%, 10.5%, 23.2% and 29.1% in the soil layers of 0-0.2, 0.2-0.4, 0.4-0.6, 0.6-0.8 and 0.8-1.0 m depth, respectively (Tables 2 and 3).

The single effect of the soil P content was not significant for any of the agronomic traits of the genotypes

probably due to the genotypes were tolerant to P-deficient soils, except one (Farroupilha), that was the negative check. Under water deficit, this genotype showed the lowest grain yield in absolute value (Table 2) and, under well-watered conditions, was in the least productivity group (Table 3). The water regime x soil P content interaction was significant for grain yield (Table 1). In the presence of water deficit, the grain yield at the lowest P content was 36.1 g per column, 17.6% significantly higher than that obtained with the highest P content, which was 30.7 g per column. In the absence of water deficit, instead, a 9.8% higher yield, 95.3 g per column, was obtained with the highest P content, compared with 86.8 g per column obtained at the lowest P content.

According to Dingkuhn et al. (2006), the main effect of P deficiency appeared to be a reduction in demand for assimilates in the shoot while photosynthetic radiation use efficiency remained nearly constant; resulting in spill-over of excess assimilates into reserve compartments and root growth. Increased root growth relative to shoot was associated with increased sucrose concentration in roots, and thus possibly resulted from assimilates liberated by shoot growth inhibition (Luquet et al., 2005). According to Wissuwa et al. (2005), roots are generally regarded as stronger sinks than leaves under P deficiency since root:shoot ratios typically increase. Additionally, in the comparison of two genotypes with different tolerance to P deficiency, these authors found that the more tolerant one preferentially distributed P to roots where the additional P stimulated root growth and, ultimately, P uptake.

In our study, under water deficit, the average root density in the 0.4-1.0 m deeper layers was 0.50 mg cm-3

Table 1: Summary of variance analysis for grain yield (GY, g per column), leaf biomass (LeafBio, g per column), stem biomass (StemBio, g per column) and root density (mg cm-3) in the soil layers of 0-0.2, 0.2-0.4, 0.4-0.6, 0.6-0.8 and 0.8-1.0 m depth

Mean square

DF Root density

0-0.2 m 0.2-0.4 m 0.4-0.6 m 0.6-0.8 m 0.8-1.0 m

Replication 1 975.1 ns 5.8 * 230.2 ns 0.32 ns 0.12 ns 0.17 ns 0.10 ns 0.06 ns

Water regime (WR) 1 318,718.1 ** 2,896.8 ** 19,966.4 * 1.03 ns 0.50 ** 0.28 ** 1.81 ** 4.26 *

Error A 1 62.5 0.005 39.5 0.05 0.01 0.01 0.09 0.45

P content (P) 1 243.8 ns 363.0 ns 3,786.1 ns 0.07 ns 0.25 ns 0.02 ns 0.03 ns 0.10 ns

WR x P 1 4,634.3 ** 276.0 ns 1,179.6 ns 0.01 ns 0.01 ns 0.01 ns 0.17 ns 0.53 ns

Error B 2 160.7 32.2 583.1 1.23 0.12 0.03 0.03 0.05

Genotype (G) 47 1,031.7 ** 463.3 ** 1,331.3 ** 0.62 ** 0.17 ** 0.11 ** 0.12 ** 0.19 **

WR x G 47 435.8 ** 22.2 ns 117.2 * 0.08 ns 0.05 ** 0.05 * 0.04 ** 0.12 **

P x G 47 200.1 ns 23.0 ns 84.7 ns 0.05 ns 0.03 ns 0.04 ns 0.03 ns 0.07 ns

WR x P x G 47 214.9 ns 21.1 ns 80.1 ns 0.05 ns 0.03 ns 0.02 ns 0.03 ns 0.05 ns

Error C 188 186.8 21.1 81.8 0.08 0.03 0.03 0.02 0.05

CV (%) 22.0 17.3 16.7 37.6 33.6 36.8 29.9 38.2

ns, * and **: not significant, significant at 0.05 and 0.01 levels by F-test, respectively.

GY LeafBio StemBio Source

(4)

Table 2: Grain yield (GY), leaf biomass (LeafBio), stem biomass (StemBio) and root density in the soil layers of 0-0.2, 0.2-0.4, 0.4-0.6, 0.6-0.8 and 0.8-1.0 m depth of rice genotypes under water deficit

GY LeafBio StemBio Root density (mg cm-3)

(g per column) 0-0.2 m 0.2-0.4 m 0.4-0.6 m 0.6-0.8 m 0.8-1.0 m

CNA 4140 51.6 a 35.5 a 59.6 c 1.06 b 0.64 a 0.65 a 0.68 a 0.95 a

CNA 6187 50.3 a 26.2 c 54.8 c 0.88 b 0.44 b 0.56 a 0.45 b 0.51 b

Arroz Mato Grosso 50.0 a 31.7 b 58.0 c 0.76 b 0.61 a 0.78 a 0.64 a 0.66 a

BRA 02601 45.9 a 36.1 a 66.9 c 0.85 b 0.62 a 0.63 a 0.79 a 0.85 a

BRS Esmeralda 44.8 a 20.3 d 36.9 e 0.35 c 0.43 b 0.41 b 0.46 b 0.41 b

BRA 052023 44.8 a 23.6 c 44.8 d 0.60 c 0.52 b 0.50 a 0.46 b 0.42 b

Rio Paranaíba 44.4 a 39.7 a 62.0 c 0.83 b 0.40 b 0.51 a 0.64 a 0.88 a

TOX 503-4-115-B-B 43.0 a 25.3 c 46.9 d 1.04 b 0.61 a 0.39 b 0.56 a 0.64 a

BRS Bonança 42.8 a 21.9 c 40.1 d 0.96 b 0.50 b 0.42 b 0.46 b 0.64 a

Guaporé 42.4 a 36.3 a 47.9 d 0.89 b 0.84 a 0.55 a 0.48 b 0.79 a

CNA 4137 41.1 a 13.1 d 33.7 e 0.38 c 0.20 b 0.28 b 0.32 b 0.29 b

CNA 4098 40.8 a 30.0 b 47.5 d 1.08 b 0.74 a 0.44 b 0.54 a 0.88 a

Guapa 40.8 a 36.7 a 64.4 c 0.91 b 0.53 b 0.61 a 0.62 a 0.95 a

BRA 052045 40.3 a 39.7 a 68.1 c 1.45 a 0.65 a 0.56 a 0.49 b 0.73 a

AB 062041 40.1 a 30.2 b 53.9 c 1.03 b 0.68 a 0.58 a 0.67 a 0.77 a

AB 062037 39.8 a 30.1 b 64.1 c 0.84 b 0.47 b 0.37 b 0.48 b 0.56 b

IREM 247 38.1 a 15.8 d 40.3 d 0.45 c 0.45 b 0.50 a 0.37 b 0.47 b

Urucuí 37.0 a 18.6 d 35.5 e 0.58 c 0.41 b 0.55 a 0.37 b 0.40 b

BRSMG 355 36.6 a 9.0 d 27.3 e 0.40 c 0.30 b 0.34 b 0.38 b 0.39 b

CNA 5018 36.6 a 42.9 a 69.8 c 1.28 a 0.66 a 0.56 a 0.48 b 0.57 b

BRA 032033 36.2 a 25.6 c 47.4 d 0.59 c 0.53 b 0.36 b 0.43 b 0.37 b

CNA 6682 35.7 a 17.5 d 39.5 d 0.44 c 0.42 b 0.41 b 0.38 b 0.41 b

CNA 7680 34.7 a 15.4 d 32.7 e 0.50 c 0.33 b 0.38 b 0.30 b 0.37 b

AB 062138 34.3 a 27.8 b 59.0 c 0.90 b 0.57 a 0.51 a 0.56 a 0.63 a

BRSMG Caravera 34.2 a 19.0 d 34.4 e 0.51 c 0.49 b 0.52 a 0.54 a 0.37 b

Guarani 33.6 a 17.9 d 36.3 e 0.37 c 0.46 b 0.38 b 0.34 b 0.42 b

Mean a(1) 40.8 26.4 48.9 0.77 0.52 0.49 0.50 0.59

Douradão 31.8 b 18.7 d 38.3 e 0.64 c 0.34 b 0.36 b 0.37 b 0.40 b

IAPAR 9 31.1 b 13.9 d 29.5 e 0.49 c 0.42 b 0.37 b 0.31 b 0.47 b

CNA 7451 31.0 b 22.9 c 34.6 e 0.52 c 0.26 b 0.32 b 0.36 b 0.39 b

CT11891-3-3-3-M 31.0 b 12.6 d 22.7 e 0.42 c 0.28 b 0.27 b 0.31 b 0.29 b

4 Meses Branco 29.0 b 18.5 d 35.2 e 0.48 c 0.40 b 0.44 b 0.27 b 0.33 b

CNA 6687 28.0 b 21.4 c 45.7 d 0.52 c 0.42 b 0.44 b 0.41 b 0.54 b

CNA 4128 27.0 b 18.8 d 41.0 d 0.54 c 0.47 b 0.44 b 0.47 b 0.51 b

IAC 25 26.9 b 18.2 d 36.9 e 0.53 c 0.40 b 0.44 b 0.47 b 0.41 b

CNA 5166 26.5 b 19.0 d 39.3 d 0.54 c 0.48 b 0.35 b 0.39 b 0.34 b

Arroz Branco Precoce 26.2 b 19.5 d 41.6 d 0.50 c 0.50 b 0.46 b 0.46 b 0.48 b

IREM 656 25.9 b 19.6 d 44.5 d 0.48 c 0.32 b 0.43 b 0.51 b 0.41 b

BRA 032051 25.6 b 15.2 d 40.9 d 0.40 c 0.34 b 0.41 b 0.37 b 0.32 b

AB 062048 24.7 b 16.1 d 39.7 d 0.44 c 0.35 b 0.29 b 0.27 b 0.37 b

BRS Pepita 24.5 b 19.9 d 48.6 d 0.38 c 0.26 b 0.49 a 0.47 b 0.50 b

CNA 7864 24.4 b 20.2 d 38.1 e 0.52 c 0.35 b 0.40 b 0.37 b 0.47 b

CT11632-3-3-M 23.3 b 38.8 a 82.2 b 1.51 a 0.85 a 0.56 a 0.47 b 0.53 b

BRA 052053 22.6 b 15.4 d 44.0 d 0.65 c 0.30 b 0.29 b 0.34 b 0.36 b

BRA 052034 22.1 b 25.0 c 47.7 d 0.71 c 0.47 b 0.41 b 0.37 b 0.45 b

Noventinha 20.8 b 19.4 d 38.2 e 0.57 c 0.34 b 0.42 b 0.44 b 0.33 b

BRA 01600 19.9 b 26.4 c 50.1 d 0.56 c 0.45 b 0.64 a 0.45 b 0.32 b

BRA 01596 12.4 b 21.4 c 40.1 d 0.62 c 0.52 b 0.66 a 0.39 b 0.37 b

Farroupilha 9.6 b 37.4 a 99.5 a 1.13 b 0.51 b 0.42 b 0.69 a 0.66 a

Mean b(2) 24.7 20.8 44.5 0.60 0.41 0.42 0.41 0.42

General mean 33.4 23.8 46.9 0.69 0.47 0.46 0.46 0.51

Means followed by the same letters in the columns do not differ by Scott-Knott’ test at 0.05 probability level.

(1) Means of the most productive group according to Scott-Knott’ test. (2) Means of the least productive group according to Scott-Knott’ test.

(5)

Table 3: Grain yield (GY), leaf biomass (LeafBio), stem biomass (StemBio) and root density in the soil layers of 0-0.2, 0.2-0.4, 0.4-0.6, 0.6-0.8 and 0.8-1.0 m depth of well-watered rice genotypes

GY LeafBio StemBio Root density (mg cm-3)

(g per column) 0-0.2 m 0.2-0.4 m 0.4-0.6 m 0.6-0.8 m 0.8-1.0 m

CNA 6187 119.7 a 35.6 b 75.0 b 0.91 b 0.53 c 0.57 a 0.77 a 0.80 b

BRA 052045 118.4 a 38.5 b 65.1 c 1.41 a 0.70 b 0.65 a 0.67 a 0.56 c

Guapa 112.9 a 39.3 b 75.4 b 0.89 b 0.61 b 0.56 a 0.74 a 0.60 c

AB 062138 112.3 a 33.9 b 61.5 c 0.97 b 0.42 c 0.55 a 0.66 a 0.83 b

Arroz Mato Grosso 112.1 a 39.1 b 73.9 b 0.88 b 0.86 a 0.88 a 0.81 a 0.87 b

CNA 4098 111.6 a 32.1 b 56.8 c 0.53 c 0.50 c 0.33 b 0.61 a 0.80 b

BRA 02601 110.5 a 39.2 b 81.1 b 1.15 b 0.56 b 0.82 a 0.99 a 1.02 b

Rio Paranaíba 109.9 a 42.3 a 69.5 b 1.10 b 0.61 b 0.73 a 0.73 a 0.71 c

AB 062041 108.5 a 28.3 c 59.4 c 0.79 c 0.65 b 0.64 a 0.61 a 0.61 c

AB 062037 107.7 a 32.3 b 63.7 c 1.03 b 0.58 b 0.55 a 0.60 a 0.61 c

BRA 052034 107.5 a 31.6 c 59.7 c 0.60 c 0.39 c 0.46 b 0.40 b 0.57 c

Guaporé 106.1 a 43.4 a 59.9 c 0.87 b 0.69 b 0.59 a 0.77 a 0.93 b

CNA 4140 102.9 a 36.7 b 68.6 b 1.01 b 1.03 a 0.67 a 0.82 a 0.79 b

BRA 01600 102.3 a 31.2 c 68.6 b 1.01 b 0.49 c 0.58 a 0.64 a 0.69 c

Urucuí 102.2 a 26.6 c 58.3 c 0.68 c 0.44 c 0.36 b 0.51 b 0.64 c

CT 11632-3-3-M 98.4 a 43.2 a 86.1 b 1.65 a 1.09 a 0.87 a 0.73 a 0.92 b

BRA 032051 97.8 a 24.1 d 66.5 c 0.75 c 0.45 c 0.47 b 0.69 a 0.68 c

BRA 052023 96.3 a 29.4 c 65.2 c 0.56 c 0.77 b 0.52 a 0.48 b 0.64 c

CNA 5018 96.1 a 45.5 a 83.6 b 1.41 a 0.53 c 0.72 a 0.68 a 0.88 b

BRS Esmeralda 95.7 a 31.1 c 57.5 c 0.63 c 0.68 b 0.70 a 0.61 a 0.82 b

CNA 4128 95.6 a 24.9 d 59.3 c 0.95 b 0.88 a 0.67 a 0.75 a 0.91 b

BRA 052053 95.1 a 24.6 d 59.8 c 0.85 b 0.39 c 0.46 b 0.49 b 0.57 c

CNA 4137 93.6 a 21.1 d 50.1 d 0.55 c 0.60 b 0.54 a 0.59 a 0.62 c

BRA 032033 91.1 a 27.7 c 66.7 c 0.71 c 0.62 b 0.70 a 0.90 a 1.03 b

BRS Pepita 91.0 a 25.8 c 55.8 c 0.62 c 0.35 c 0.52 a 0.60 a 0.74 c

CNA 7864 90.8 a 25.1 d 56.9 c 0.87 b 0.74 b 0.50 a 0.62 a 0.66 c

IAPAR 9 90.1 a 24.2 d 50.8 d 0.70 c 0.55 c 0.51 a 0.57 a 0.58 c

BRSMG Caravera 89.6 a 23.4 d 52.3 d 0.55 c 0.45 c 0.27 b 0.39 b 0.56 c

Mean a(1) 102.3 32.1 64.5 0.88 0.61 0.58 0.66 0.74

AB 062048 88.2 b 20.5 d 48.9 d 0.44 c 0.38 c 0.36 b 0.33 b 0.38 c

TOX 503-4-115-B-B 87.7 b 37.7 b 76.9 b 1.29 a 0.61 b 0.67 a 0.70 a 0.83 b

BRA 01596 87.2 b 24.1 d 42.3 d 0.37 c 0.29 c 0.19 b 0.22 b 0.32 c

CNA 6687 85.1 b 26.7 c 57.3 c 0.70 c 0.50 c 0.37 b 0.46 b 0.72 c

CNA 7680 83.0 b 25.9 c 62.0 c 0.74 c 0.45 c 0.51 a 0.69 a 0.99 b

CNA 7451 81.7 b 24.4 d 64.9 c 0.59 c 0.54 c 0.46 b 0.60 a 0.65 c

Douradão 81.2 b 27.3 c 53.9 d 0.48 c 0.28 c 0.28 b 0.42 b 1.48 a

4 Meses Branco 80.3 b 22.0 d 52.2 d 0.54 c 0.43 c 0.32 b 0.47 b 0.47 c

Guarani 80.0 b 21.5 d 53.3 d 0.70 c 0.59 b 0.57 a 0.58 a 0.85 b

Arroz Branco Precoce 78.8 b 24.1 d 53.1 d 0.76 c 0.63 b 0.54 a 0.64 a 0.75 b

BRS Bonança 78.4 b 26.9 c 52.1 d 1.15 b 0.58 b 0.48 b 0.65 a 0.90 b

CNA 5166 77.3 b 23.7 d 50.2 d 0.41 b 0.40 c 0.32 b 0.36 b 0.54 c

Mean b(2) 82.4 25.4 55.6 0.68 0.47 0.42 0.51 0.74

IREM 247 71.1 c 21.4 d 55.8 c 0.44 c 0.40 c 0.38 b 0.51 b 0.50 c

CNA 6682 68.9 c 26.5 c 59.5 c 0.61 c 0.36 c 0.36 b 0.45 b 0.49 c

Farroupilha 68.9 c 37.6 b 106.9 a 1.31 a 0.60 b 0.60 a 0.48 b 0.85 b

CT 11891-3-3-3-M 67.5 c 19.1 d 38.5 d 0.36 c 0.26 c 0.29 b 0.32 b 0.46 c

IAC 25 67.2 c 24.7 d 56.7 c 0.68 c 0.44 c 0.38 b 0.52 b 0.59 c

IREM 656 64.1 c 27.2 c 53.5 d 0.97 b 0.52 c 0.53 a 0.72 a 0.91 b

BRSMG 355 58.6 c 22.2 d 53.0 d 0.52 c 0.36 c 0.41 b 0.58 a 0.98 b

Noventinha 49.2 c 23.7 d 44.6 d 0.39 c 0.23 c 0.28 b 0.31 b 0.45 c

Mean c(3) 64.4 25.3 58.6 0.66 0.40 0.40 0.49 0.65

General mean 91.0 29.3 61.3 0.79 0.54 0.51 0.59 0.72

Means followed by the same letters in the columns do not differ by Scott-Knott’ test at 0.05 probability level.

(1) Means of the most productive group according to Scott-Knott’ test. (2) Means of the intermediate productive group according to Scott-Knott’ test. (3) Means of the least productive group according to Scott-Knott’ test.

(6)

with the lowest P content and 0.45 mg cm-3 with the P content of 200 mg dm-3. Since, for the same P treatments, the shoot biomass (leaves + stems) was 69.2 and 72.3 g, the root:shoot ratio was higher for the lowest P content, corroborating the previous authors.

Since the genotypes were tolerant to P-deficient soils, the water deficit had more impact on grain yield than the P supply. As the water deficit was imposed at panicle emission stage, and root weight density peaks at around flowering (Kato & Okami, 2010), the higher root density, although not significant, may have contributed to minimize the effect of water deficit and explain the highest grain yield at the lowest P content. These results corroborate the association between the tolerance to P deficiency and adaptation to abiotic stresses (Chin et al., 2010; 2011).

Regarding the well-watered treatment, as the genotypes did not suffer water deficit, the increase in root density as a response to P deficiency is less important to define the grain yield than the P supply. The plant phosphorus uptake is related to the diffusive flux of phosphorus in soil and this is influenced by the soil moisture and P concentration in the soil (Costa et al., 2006).

The genotypes differed significantly for all the agronomic traits. Furthermore, it was observed that water regimes influenced differently grain yield, stem biomass and root density of genotypes in all layers evaluated except in the surface layer, as the water regime x genotype interaction was significant for these agronomic traits (Table 1).

Centrito et al. (2009), applying water deficit from the flowering stage until the beginning of physiological maturity, also found a significant decrease in above-ground dry mass and grain yield, that varied among rice genotypes, being the most productive those genotypes which showed higher photosynthesis and mesophyll and stomata conductances. Kamoshita et al. (2004) and Gui-marães et al. (2013; 2016) also observed genetic variation in rice performance when subjected to water deficit.

Differences among genotypes for the traits evaluated, in both water regimes, can be observed in Tables 2 and 3. As there was an interaction between water regime and genotype, probably the root density is not a constitutive trait for all genotypes. The root development as a constitutive trait gives advance preparation for the plant to support possible occurrences of water deficit. Considering that the water deficit periods are unpredictable, both in intensity, durability and time of occurrence, this, along with others, is an essential characteristic of cultivars recommended for areas with the occurrence of uneven rainfall distribution.

Ji et al. (2012) found that, for a sensitive rice cultivar, a 20-days drought stress at reproductive stage caused

reduction of 61% and 14% in root mass from 0 to 0.3 m and from 0.3 to 0.9 m, respectively. However, for a tolerant rice cultivar it was observed a reduction of 43% in root mass from 0 to 0.3 m but an increase of 72% from 0.3 to 0.9 m.

Scott-Knott’s test classified the genotypes in two and three groups in relation to grain yield under water deficit and under well-watered conditions, respectively (Tables 2 and 3). The most productive group under water deficit, with 54.2% of the genotypes evaluated, showed the following means: 40.8 g per columnof grain yield, 26.4 g per column of leaf biomass, 48.9 g per column of stem biomass and root density in the soil layers of 0-0.2, 0.2-0.4, 0.4-0.6, 0.6-0.8 and 0.8-1.0 m depth of 0.77, 0.52, 0.49, 0.50 and 0.59 mg cm-3, respectively (Table 2). Under well-watered conditions, the most productive group showed the following means: 102.3 g per columnof grain yield, 32.1 g per column of leaf biomass, 64.5 g per column of stem biomass and root density in the soil layers of 0-0.2, 0.2-0.4, 0.4-0.6, 0.6-0.8 and 0.8-1.0 m depth of 0.88, 0.61, 0.58, 0.66 and 0.74 mg cm-3, respectively (Table 3).

Grain yield under water deficit correlated positively and significantly with the root density in the deeper layers of the soil (Table 4). This was due, probably, to the biggest water uptake afforded by a deeper root system, which favored the accumulation of biomass in the leaves and stems. Matsuo et al. (2009), evaluating the performance of rice genotypes under water deficit conditions, observed a correlation between the water uptake capacity and the accumulation of biomass in shoots.

The leaf and stem biomass were positively correlated with grain yield and root density in all soil layers. Presumably, plants with higher leaf biomass also show greater leaf area, therefore, greater photosynthesis ability, which would lead to a greater accumulation of carbohydrates in the stems.

Among the 26 genotypes classified in the most productive group under water deficit, the genotypes AB 062037, AB 062041, AB 062138, Arroz Mato Grosso, BRA 02601, BRA 032033, BRA 052023, BRA 052045, BRS Esme-ralda, BRSMG Caravera, CNA 4098, CNA 4137, CNA 4140, CNA 5018, CNA 6187, Guapa, Guaporé, Rio Paranaíba and Urucuí were also classified in the most productive group under well-watered conditions (Tables 2 and 3). With few exceptions, this group of 26 genotypes is that with high root density in the deepest layers of soil (Table 2), which is in accordance with the result of the linear correlation analysis.

(7)

columns with the genotypes of the most productive group showed on average cumulative evapotranspiration of 30.1 L per column and those of the least productive group 27.0 L per column, for a similar period of 44 days after panicle emission. The three clusters defined for the well-watered conditions, in descending order of grain yield, showed cumulative evapotranspiration of 62.1, 52.5 and 47.8 L per column, respectively.

As the plants totally covered the soil in the columns at the panicle emission stage, transpiration accounted for most of the water lost to the atmosphere from this stage

to harvest. According to Blum (2009), since biomass production is tightly linked to transpiration, breeding for maximized soil moisture capture for transpiration is the most important target for yield improvement under water deficit. Zain et al. (2014) found that 15-day water deficit cycle reduced rice transpiration rate by 42% and, as it has a positive correlation with net photosynthesis rate, reduced grain yield.

Greater root length density increases the water storage capacity of the root zone, and a deeper root system is associated with more water uptake from the soil and with

Table 4: Pearson’s correlation coefficient among means of grain yield (GY), leaf biomass (LeafBio), stem biomass (StemBio) and root density in the soil layers of 0-0.2, 0.2-0.4, 0.4-0.6, 0.6-0.8 and 0.8-1.0 m depth, under water deficit. n = 48

Root density

0-0.2 m 0.2-0.4 m 0.4-0.6 m 0.6-0.8 m 0.8-1.0 m

GY 0.401 * 0.383 * 0.296 ns 0.228 ns 0.432 * 0.539 ** 0.443 *

LeafBio 0.922 ** 0.822 ** 0.716 ** 0.608 ** 0.724 ** 0.773 **

StemBio 0.785 ** 0.565 ** 0.584 ** 0.719 ** 0.692 **

Root density 0-0.2 m 0.727 ** 0.525 ** 0.618 ** 0.739 **

0.2-0.4 m 0.645 ** 0.593 ** 0.719 **

0.4-0.6 m 0.707 ** 0.647 **

0.6-0.8 m 0.854 **

ns, * and **: not significant, significant at 0.05 and 0.01 levels by t-test, respectively.

Variable LeafBio StemBio

(8)

better crop performance under drought conditions (Mishra & Salokhe, 2011). Kato & Okami (2010) noted that when the soil water potential at 20-cm depth was below -50 kPa the stomatal behavior reflected the rice root growth in the subsurface layer. These results suggest the role of vigorous root growth in soil water uptake and hence, in maintaining transpiration in upland rice crop.

CONCLUSIONS

The water deficit had more impact on grain yield than the P supply.

The genotypes AB 062037, AB 062041, AB 062138, Arroz Mato Grosso, BRA 02601, BRA 052045, CNA 4098, CNA 6187, Guapa, Guaporé and Rio Paranaíba were classified in the most productive group under both water regimes.

The most productive genotypes under water deficit showed higher root density in the deeper soil layers.

The most productive genotypes in the two water regi-mes were also those that showed the highest transpiration.

ACKNOWLEDGEMENTS

The authors would like to thank the funding agencies CNPq and FAPEG of the Brazilian government for the partial financial support for the research in this paper.

REFERENCES

Blum A (2009) Effective use of water (EUW) and not water-use efficiency (WUE) is the target of crop yield improvement under drought stress. Field Crops Research, 112:119-123.

Centrito M, Lauteri M, Monteverdi MC & Serraj R (2009) Leaf gas exchange, carbon isotope discrimination, and grain yield in contrasting rice genotypes subjected to water deficits during the reproductive stage. Journal of Experimental Botany, 60:2325-2339.

Chin JH, Gamuyao R, Dalid C, Bustamam M, Prasetiyono J, Moeljopawiro S, Wissuwa M & Heuer S (2011) Developing rice with high yield under phosphorus deficiency: Pup1 sequence to application. Plant Physiology, 156:1202-1216.

Chin JH, Lu X, Haefele SM, Gamuyao R, Ismail A, Wissuwa M & Heuer S (2010) Development and application of gene-based markers for the major rice QTL Phosphorus uptake 1. Theoretical and Applied Genetics, 120:1073-1086.

Costa JPV da, Barros NF de, Albuquerque AW de, Moura Filho G & Santos JR (2006) Fluxo difusivo de fósforo em função de doses e da umidade do solo. Revista Brasileira de Engenharia Agrícola e Ambiental, 10:828-835.

Crusciol CAC, Soratto RP, Arf O & Mateus GP (2006) Yield of upland rice cultivars in rainfed and sprinkler-irrigated systems in the Cerrado region of Brazil. Australian Journal of Experi-mental Agriculture, 46:1515-1520.

Dingkuhn M, Luquet D, Kim H, Tambour L & Clement-Vidal A (2006) EcoMeristem, a model of morphogenesis and competition among sinks in rice. 2. Simulating genotype responses to phosphorus deficiency. Functional Plant Biology, 33:325-337.

Guimarães CM, Castro AP de, Stone LF & Oliveira JP de (2016) Drought tolerance in upland rice: identification of genotypes and agronomic characteristics. Acta Scientiarum. Agronomy, 38:201-206.

Guimarães CM, Stone LF, Rangel PHN & Silva AC de L (2013) Tolerance of upland rice genotypes to water deficit. Revista Brasileira de Engenharia Agrícola e Ambiental, 17:805-810. Ji K, Wang Y, Sun W, Lou Q, Mei H, Shen S & Chen H (2012)

Drought-responsive mechanisms in rice genotypes with contrasting drought tolerance during reproductive stage. Journal of Plant Physiology, 169:336-344.

Kamoshita A, Rodriguez R, Yamauchi A & Wade LJ (2004) Genotypic variation in response of rainfed lowland rice to prolonged drought and dewatering. Plant Production Science, 7:406-420.

Kato Y & Okami M (2010) Root growth dynamics and stomatal behaviour of rice (Oryza sativa L.) grown under aerobic and flooded conditions. Field Crops Research, 117:09-17. Luquet D, Zhang BG, Dingkuhn M, Dexet A & Clément-Vidal A

(2005) Phenotypic plasticity of rice seedlings: case of phosphorus deficiency, Plant Production Science, 8:145-151. Matsuo N, Ozawa K & Mochizuki T (2009) Genotypic differences

in root hydraulic conductance of rice (Oryza sativa L.) in response to water regimes. Plant and Soil, 316:25-34. Mishra A & Salokhe VM (2011) Rice root growth and physiological

responses to SRI water management and implications for crop productivity. Paddy and Water Environment, 9:41-52. Otani T & Ae N (1996) Sensitivity of phosphorus uptake to

change in root length and soil volume. Agronomy Journal, 88:371-375.

Pinheiro B da S, Castro E da M de & Guimarães CM (2006) Sustainability and profitability of aerobic rice production in Brazil. Field Crops Research, 97:34-42.

Wissuwa M & Ae N (2001) Genotypic variation for tolerance to phosphorus deficiency in rice and the potential for its exploitation in rice improvement. Plant Breeding, 120:43-48. Wissuwa M, Gamat G & Ismail AM (2005) Is root growth under phosphorus deficiency affected by source or sink limitations? Journal of Experimental Botany, 56:1943-1950.

Yang C, Yang L, Yang Y & Ouyang Z (2004) Rice root growth and nutrient uptake as influenced by organic manure in continuously and alternately flooded paddy soils. Agricultural Water Management, 70:67-81.

Imagem

Table 1: Summary of variance analysis for grain yield (GY, g per column), leaf biomass (LeafBio, g per column), stem biomass (StemBio, g per column) and root density (mg cm -3 ) in the soil layers of 0-0.2, 0.2-0.4, 0.4-0.6, 0.6-0.8 and 0.8-1.0 m depth
Table 2: Grain yield (GY), leaf biomass (LeafBio), stem biomass (StemBio) and root density in the soil layers of 0-0.2, 0.2-0.4, 0.4- 0.4-0.6, 0.6-0.8 and 0.8-1.0 m depth of rice genotypes under water deficit
Table 3: Grain yield (GY), leaf biomass (LeafBio), stem biomass (StemBio) and root density in the soil layers of 0-0.2, 0.2-0.4, 0.4- 0.4-0.6, 0.6-0.8 and 0.8-1.0 m depth of well-watered rice genotypes
Figure 1: Cumulative evapotranspiration of soil columns cropped with upland rice genotypes, from panicle emission to harvest, according to statistic clusters

Referências

Documentos relacionados

VI - apresentar as propostas de avaliação e atualização dos documentos com vistas a determinar sua destinação final, elaborando o Plano de Destinação de Documentos de Arquivo e

Para que se possa tentar direccionar com mais facilidade os sujeitos em estudos futuros, a fim de obtermos a valência das memórias, fica a proposta de alterar

Contudo, apesar desta inovação, Freud ([1904/1905]1989) considerava o tratamento psicanalítico impróprio para os casos de psicose, mas não descartou que através

A Figura 29 apresenta os resultados dos ensaios da concentração do rejeito de cromita para uma ampla faixa de tamanhos empregando-se um concentrador Falcon SB-40, onde foram

O alargamento do campo de aplicação da denúncia espontânea no Direito Aduaneiro, proposto no texto legal para permitir a exclusão, também, da imposição de penalidades de

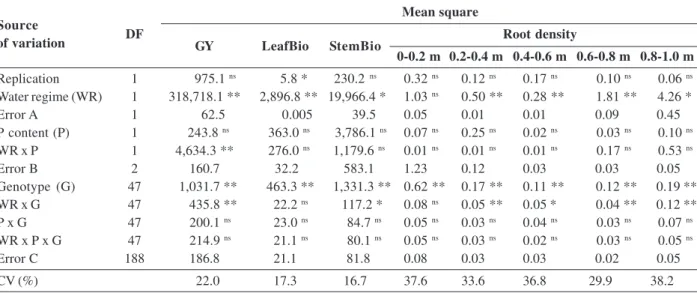
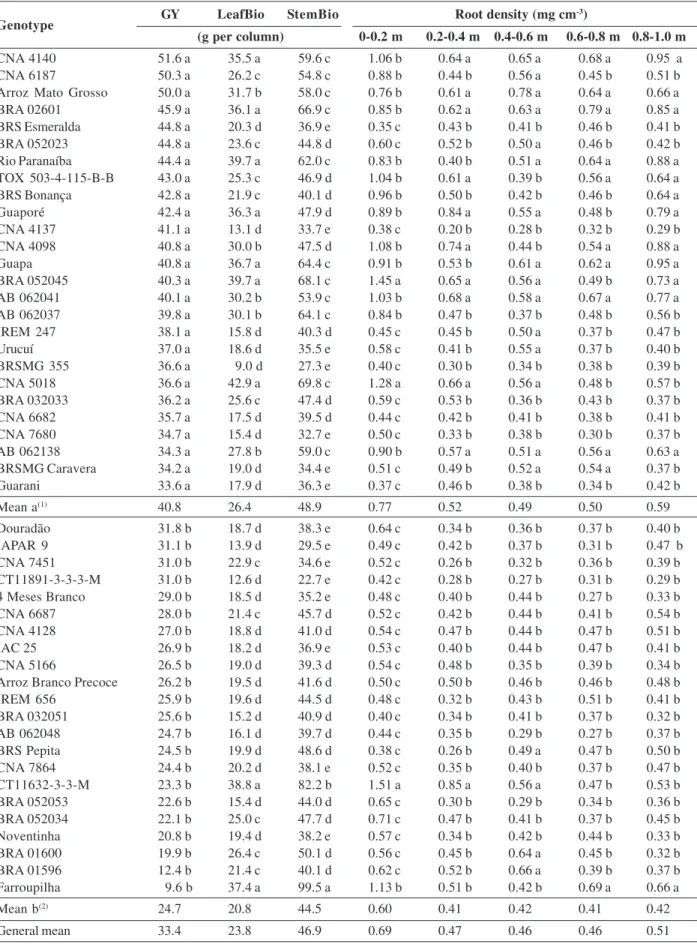
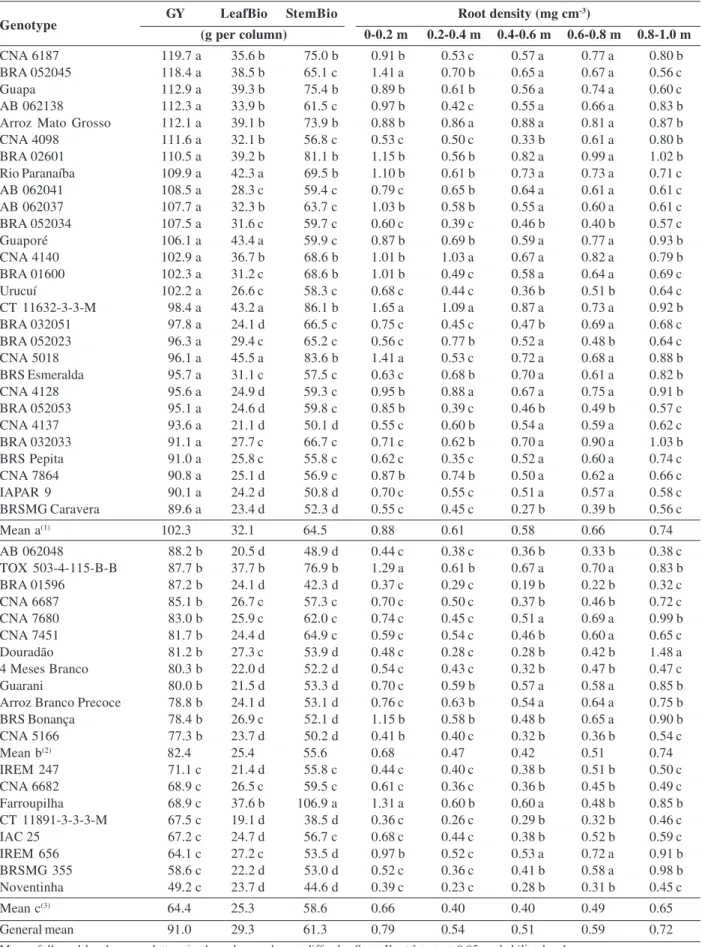
Regarding the importance of choice of rice cultivars tolerant to drought, the present study aimed to evaluate the traits related to productivity, in rice genotypes, under

O projeto proposto para essas alunas do 6° semestre de Letras/Espanhol foi justamente unir vários saberes, contextualizando-o com a realidade da disciplina que é obter o profundo

Petrópolis fomos convencidos de que a prática não se apresenta salutar, por questões técnicas. Não somente técnicas, mas as que envolvem os Direitos Fundamentais”. Esse é um