Vol.53, n. 4: pp.785-791, July-August 2010
ISSN 1516-8913 Printed in Brazil BRAZILIAN ARCHIVES OF
BIOLOGY AND TECHNOLOGY
A N I N T E R N A T I O N A L J O U R N A L
Genetic Variation and Interrelationships of Agronomic
Characteristics in Durum Wheat under two Constructing
Water Regimes
Reza Talebi
1*, Farzad Fayyaz
1and Amir Mohammad Naji
21
College of Agriculture; Islamic Azad University; Branch of Sanandaj; Iran. 2College of Agriculture; Shahed University; Tehran - Iran
ABSTRACT
This work aimed to study the grain yield components and plant characteristics related to grain yield. Twenty-four durum wheat genotypes from the ICARDA durum wheat breeding program were grown during 2006-2007 under rainfed and irrigated conditions using a complete randomized block design with three replicate in west of Iran. Correlation and path analysis were carried out. Results showed that there was strong positive association of grain yield with the number of seed /spike, biomass and harvest index. Grain yield was negatively associated with spike length and plant height in different moisture conditions. Comparatively, high genetic variation was found in grain yield and other characteristics. Hierarchical cluster analysis was used as a tool to classify the genotypes according to their grain yield ability under optimum and drought stress conditions. Among the genotypes, one of three groups of genotypes were characterized by high grain yield in optimum and drought stress conditions. These genotypes could be used as source of germplasm for breeding for drought tolerance.
Key words
:
Durum wheat, drought stress, yield components, path analysis* Author for correspondence: talebi_rsvz@yahoo.com
INTRODUCTION
Durum wheat ((Triticum durum Desf.) is a
monocotyledonous plant of the Gramineae family
and of the Triticeae tribe and belongs to the genus Triticum. For commercial production and human consumption, durum wheat is the second most important Triticum species, next to common wheat (Triticum aestivum L.). Grain yield in small-cereals can be analyzed in terms of three primary yield components (number of spikes m−2, number of grains spike−1 and mean grain weight) that
appear sequentially with later-developing
components under the control of earlier-developing ones (Garcia del Moral et al., 1991; Simane et al., 1993). In the Mediterranean region,
the magnitude attained by these grain yield components could be limited by low and unpredictable seasonal rainfall as well as higher temperatures towards the end of the crop cycle. In this region, most rain falls during autumn and winter, and water deficit occurs in the spring, resulting in moderate stress for rain-fed wheat around anthesis, which increases in severity throughout grain filling (Garcia del Moral et al., 2005). Therefore, it appears necessary to study the physiology of crop development, as the effects of certain environmental factors on crop growth and
grain yield differ depending upon the
adverse growing conditions (Slafer et al., 1996; Garcia del Moral et al., 2002). Grain yield is the
result of many characteristics which are
interdependent. Breeders always look for genetic variation among the characteristics to select the desirable types. Some of these characters are highly associated among themselves and with grain yield. As in all cultivated plants, the main objective of growing wheat is for high grain yield and high quality crops. Since genotypic and environmental factors are the main components for determining the yield and quality in plants, a primary aim should be the determination of effects of genotypic factors for selection. As the effect of environment on grain yield and quality in plants is not inherited, effect of genotypic factors on grain yield and quality in plant breeding research need to be examined. In addition, simple correlation does not consider the complex relationships between the various characteristics related the dependent variables (Garcia del Moral et al, 2005). Correlation coefficients show relationships among independent variables. But, it is not sufficient to describe this relationship when the causal relationship among variables is needed (Korkut et al., 1993). So, reasons of the path analysis usage are different. They could be mentioned as follows (Ulukan et al. 2003):
• To indicate the relative importance of
certain factors contributing to grain yield reduction by any factors,
• To unravel opposing effects between
variables along different paths of influence, which may obscure the importance of certain factors along those paths and
• To determine which variables need to be
measured to enables wheat’s biological yield. In other words, path analysis is used to determine the amount of direct and indirect effect of the causal components on the effect component (Güler et al., 2001). For this reason, Khoshnazar et al. (2000), Kolte et al. (2000), Stringam et al. (2002), Güler et al (2001), Ulukan et al. (2003) and Talebi et al. (2007) determined the direct and indirect effects of various plant characteristics on grain yield and grain yield components by using the path analysis in rapeseed, chickpea and faba bean. The objectives of this work were: (i) to evaluate the
effects of water availability on several
characteristics determining the development of grain yield components in durum wheat and its influence on grain yield, and (ii) to use
path-coefficient analysis to investigate the main developmental processes influencing grain yield formation under the optimum and rain-fed conditions.
MATERIALS AND METHODS
Twenty four durum wheat (Triticum durum Desf.)
were chosen for the study based on their reputed differences in grain yield performance under irrigated and non-irrigated conditions. Seeds were hand drilled and each genotype was sown in three rows of 2.0 m, with row to row distance of 0.30 m. The experiment was laid out in randomized complete block design (RCBD) with three replications. Irrigated plots were watered at tillering, joining, flowering and grain filling stage. Non-irrigated plots were grown under rain-fed conditions. Sowing was done in November in all the experiments. Fertilizer was applied before sowing (50 kg N ha-1 and 30 kg P ha-1) and at stem elongation (50 kg N ha-1). The total dry weight and grain yield (g/m2) were measured by harvesting each plot at crop maturity. Six plants were randomly chosen from each plot to measure the number of grain per spike (grain/spike), plant height and spike length. Total leaf chlorophyll content was estimated in intact flag leaves using a portable chlorophyll meter (CCM-200, Opti-Science, England). At least 5 flag blades were measured per plant in anthesis stage. Canopy temperature measurements were made during the vegetative and early reproductive growth periods. A hand-held infrared thermometer (Teletemp model AG-42, Fullerton, CA) was used to monitor the canopy temperature. The instrument was held so as to view the crop at an angle of 30◦ from the horizontal at right angles to the rows at a distance of 2.0 m from the sample row. This procedure was followed to minimize the influence of exposed soil. Each canopy temperature was the average of three regarding recorded from different points in each plot. Variance analysis for grain yield and other related characteristics were performed over trails after verifying the homogeneity of trail variance error using Bartlett’s test. Least
significant difference (LSD) values were
the characteristics, path-coefficient analyses were performed using a combination of the methods described by Garcia del Moral et al. (1991) and Dofing and Knight (1992). Before computing the path coefficients, data were transformed to decimal logarithms in order to convert the
relationships between the variables from
multiplicative to additive, and subsequently standardize them (Garcia del Moral et al., 1991).
RESULTS AND DISCUSSION
Sensitivity of the genotypes to drought stress
In this experiment, the observed variation in the grain yield of the genotypes was assumed to be due to differences in water availability. The average grain yield per area, per plant and other yield components are listed in Table 1. As expected, grain yield and all yield components, except canopy temperature, were significantly higher under irrigated conditions. The effect of water reduction under rain-fed conditions were more marked on biomass, yield (g/m2 and g/plant),
number of seed/spike and plant height. Garcia del Moral et al. (2005) also reported that number of spike m-2 and grain spike-1 seriously decreased due to water deficit in durum wheat. Drought susceptibility index (S) varied in genotypes from 0.45 to 1.50 (Table 2). This results was expected since genotypes had low S value, should have a smaller reduction in yield under drought. This was in agreement with results that were reported by Sio-se Mardeh et al. (2006) and Denciĉ et al (2000) in wheat. According to Bruckner and Frohberg (1987), genotypes with low S values were presumed to be drought resistant because they exhibited a smaller than average reduction in grain yield under stress compared with favorable
conditions. Nevertheless, the drought
susceptibility index alone appear to have serious limitations for the quantifications of genotypes reaction to drought conditions because it is based on minimizing yield reduction in stress compared with favorable conditions. Therefore, selection for S would tend to reduce yield in favorable environment.
Table 1 - Basic statistic parameters for agronomic traits in genotypes in “near optimal” (N.O.) and drought strees (D.S.) conditions.
Mean SE
Plant Height N.O 74.52* 9.69
D.S 59.51* 10.09
Canopy temperature N.O 21.5* 0.87
D.S 37.23* 2.32
Chlorophyll content N.O 47.58 2.77
D.S 45.12 2.14
Biomass N.O 15.43** 4.31
D.S 7.26** 1.7
No. of seeds/spike N.O 40.92* 7.78
D.S 30.65* 6.85
Spike length N.O 6.29* 0.97
D.S 4.56* 0.94
Spike yield (gr) N.O 4.26 1.84
D.S 2.68 0.77
Harvest index N.O 0.42 0.06
D.S 0.38 0.13
Yield (g/m2) N.O 320.68* 78.6
Table 2 - Grain yield (g/m2) and drought susceptibility index (S) 0f durum genotypes in irrigated (Yp) and rain-fed (Ys) conditions.
No. Genotypes Yp Ys S
1 Beltagy-3 212 130 0.773585
2 Omrabi5 282.5 180 0.725664
3 Adnan-1 355 87.5 1.507042
4 Adnan-2 470 160 1.319149
5 Mgnl3/Ainzen-1 297.5 170 0.857143
6 Stj3/Bcr/Lks4/3/Ter-3 257.5 187 0.547573
7 Haurani27 230 177.5 0.456522
8 Stj3//Bcr/Lks4/3/Ter-3 440 162.5 1.261364
9 Beltagy-2 430 147.5 1.313953
10 Beltagy-4 300 190 0.733333
11 Korifla 505 185 1.267327
12 Ter-1/Mrf1/Stj2 315 182.5 0.84127
13 Ter-1//Mrf1/Stj2 362.5 112.5 1.37931
14 Ter1/3/Stj3//Bcr/Lks4 290 163.3 0.873793
15 Ter1/3/Stj3//Bcr/Lks4 300 199.5 0.67
16 Waha 312.5 145 1.072
17 Beltagy-1 275 120 1.127273
18 Mrf1/Stj2//Gdr2/Mgnl1 357.5 142.5 1.202797
19 Azeghar-1//Blrn/Mrf-2 254.5 185 0.546169
20 Gidara2 250 187.5 0.5
21 Bicrederaa-1/Azeghar-2 275 207 0.494545
22 Azeghar-1/6/Zna-1/5/Awl1/4/Ruff//Jo/Cr/3/F9.3 242.5 92.5 1.237113
23 Msbl-1//Krf/Hcn 400 187.5 1.0625
24 Darl-4/5/cbc//N0//Nia/3/Lfd/4 282.5 117.5 1.168142
Mean 320.68** 159.13**
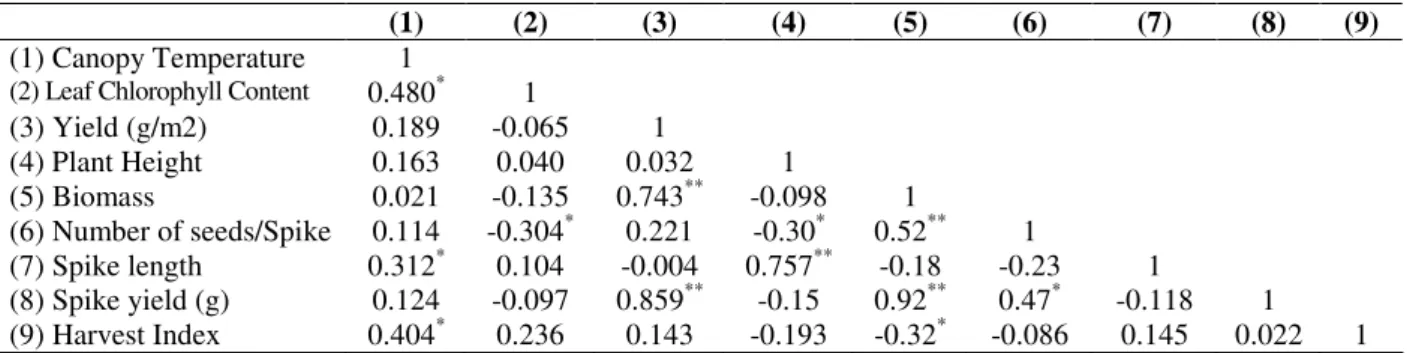
Correlation among characteristics
The phenotypic correlation among the various characteristics in both well-watered and rainfed conditions are presented in Tables 3 and 4, respectively. Biomass and spike yield (g/plant) showed positive significant correlation with grain yield and spike length showed negative correlation with grain yield in both the environments. Attarbashi et al (2002) and Subhani and Chowdhry (2000) also reported similar findings in wheat. Spike yield showed positive correlation with plant yield (g/m2) and biomass in both environments and in well-watered condition had positive correlation
with number of seed/plant and negative correlation with leaf chlorophyll content and plant height, but in rainfed conditions it had positive correlation with leaf chlorophyll content and plant height and had negative correlation with number of number of seed/plant (Tables 3 and 4). In this experiment, the phenotypic correlation between grain yield with plant height and spike yield was not significant. These results indicated that selection for spike compactness (Dens ear) might be possible without hampering the grain yield. This was in agreement with observation of Denciĉ et al, (2000) in wheat.
Table 3 - Simple correlation coefficient between some morphological and physiological characters in 24 durum wheat genotypes under well-watered condition.
(1) (2) (3) (4) (5) (6) (7) (8) (9) (1) Canopy Temperature 1
(2) Leaf Chlorophyll Content 0.480* 1
(3) Yield (g/m2) 0.189 -0.065 1
(4) Plant Height 0.163 0.040 0.032 1
(5) Biomass 0.021 -0.135 0.743** -0.098 1
(6) Number of seeds/Spike 0.114 -0.304* 0.221 -0.30* 0.52** 1
(7) Spike length 0.312* 0.104 -0.004 0.757** -0.18 -0.23 1
Table 4 - Simple correlation coefficient between some morphological and physiological characters in 24 durum wheat genotypes under rain-fed condition.
(1) (2) (3) (4) (5) (6) (7) (8) (9) (1) Canopy Temperature 1
(2) Leaf Chlorophyll Content 0.146 1
(3) Yield (g/m2) -0.158 0.083 1
(4) Plant Height 0.088 0.029 -0.009 1
(5) Biomass -0.191 0.309* 0.438* 0.124 1
(6) Number of seeds/Spike -0.359* -0.20 0.098 -0.241 0.028 1
(7) Spike length 0.276 0.109 -0.32* 0.490* 0.020 -0.169 1
(8) Spike yield (g) 0.393* 0.352* 0.412* 0.301* 0.329* -0.017 0.017 1 (9) Harvest Index 0.527*8 0.169 -0.176 0.210 -0.41* -0.022 -0.007 0.697** 1
Path analysis
The results of the path-coefficient analysis corresponding to the irrigated and rainfed conditions are shown in Table 5 and 6, respectively. This path analysis demonstrate the influence of grain yield components on grain yield as well as the process that determined the magnitude of these grain yield components, thereby providing a more complete view of how rainfed and irrigated conditions affect grain yield formation in durum wheat. In well-watered condition biomass, the number of seed/spike, spike yield (g/plant) and harvest index showed more direct positive effects on yield (Table 5). Spike yield showed the highest indirect effect on yield through the biomass and number of seed/plant. In
rainfed condition spike length, spike yield (g/plant) and harvest index showed negative direct effect on grain yield (Table 6). Variation in water regimes caused different responses in the genotype harvest index. This was in agreement with previous reports by other researchers (Destro et al. 2001). Biomass showed most direct positive effect on grain yield in this environment. In well-watered condition, canopy temperature had positive indirect effect on grain yield through all of characteristics, but in rainfed condition this trait had negative indirect effect on grain yield through most of other characteristics. This agreed with the hypothesis that plant with low canopy temperature had high photosynthesis rate and consequently more production (Hirayama et al, 2006).
Table 5 - The direct and indirect contribution (Underline indicates direct effect) of various characters to seed yield in durum wheat in well-watered condition.
X1 X2 X3 X4 X5 X6 X7 X8
Correlation value with yield(g/m2)
Canopy Tamprature (X1) (0.046) 0.017 0.046 -0.023 -0.022 -0.062 0.131 0.051 -0.15
Leaf Chlorophyll Content (X2) 0.022 (0.036) 0.011 0.014 0.057 0.021 0.103 0.029 0.08
Plant height (X3) 0.007 0.001 (-0.015) 0.01 0.055 -0.149 -0.159 -0.25 -0.009
Biomass (X4) 0.009 -0.005 -0.029 (0.288) -0.097 0.035 0.973 -0.041 0.43
Number of seeds/spike (X5) 0.005 0.011 -0.087 -0.055 (0.186) 0.044 0.497 -0.011 0.098
Spike length (X6) 0.014 0.003 0.218 0.018 0.042 (-0.196) -0.125 0.018 -0.32
Spike yield (X7) 0.005 -0.004 -0.044 -0.097 -0.088 0.023 (1.058) 0.002 0.14
Harvest índex (X8) 0.018 0.008 -0.056 0.033 0.015 -0.029 0.023 (0.126) -0.17
Table 6 - The direct and indirect contribution (Underline indicates direct effect) of various characters to seed yield in durum wheat in rain-fed condition.
X1 X2 X3 X4 X5 X6 X7 X8
Correlation value with yield(g/m2)
Canopy Tamprature (X1) (0.13) 0.018 0.011 -0.025 -0.046 0.035 0.05 0.067 -0.158
Leaf Chlorophyll Content (X2) 0.005 (0.036) 0.001 0.01 -0.008 0.003 0.012 0.006 0.083
Plant height (X3) 0.018 0.006 (0.212) 0.025 -0.051 0.103 0.063 0.044 -0.009
Biomass (X4) -0.017 0.111 0.044 (0.37) 0.007 0.007 0.118 -0.152 0.438
Number of seeds/spike (X5) -0.041 -0.024 -0.028 0.002 (0.115) -0.02 -0.002 -0.003 0.098
Spike length (X6) -0.122 -0.046 -0.222 -0.01 0.076 (-0.452) -0.008 0.002 -0.32
Spike yield (X7) -0.002 -0.002 -0.001 -0.001 0.00 -0.001 (-0.003) 0.001 0.139
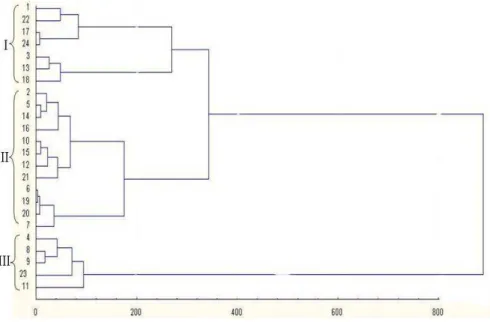
Cluster analysis
The objective of cluster analysis was to define the degree of relatedness in yielding ability under drought stress and optimum conditions in durum wheat genotypes. The cluster of the genotypes can be divided into three groups (Fig 1). Genotypes group I comprised those which averaged the lowest yields under both optimum and drought stress conditions. Twelve genotypes were placed in group II. These genotypes had high yields in both the environments and showed less reduction in yield in drought stress condition and had low value of drought susceptibility index (S). Group III
was the high sensitive genotypes that have high
yielding in optimum condition and with
significantly reduction showing low yields in drought stress condition. The results of the cluster analysis showed that only simultaneous evaluation of germplasm under optimum and drought stress conditions could reveal the most valuable source for drought stress tolerance. This was in fall
arrangement with CIMMYT,s approach to
breeding for drought tolerance which advocated parallel testing of germplasm under both favorable and stress conditions (Rajram et al, 1996).
Figure 1 - Dendogram of cluster analysis of durum wheat genotypes classified according to yield ability in well-watered and rainfed conditions
.
CONCLUSIONS
Grain yield decreased significantly under water stress conditions mainly as a results of reduction in biomass, number of seed/spike and plant height. Path analysis revealed that for genotypes grown under optimum conditions, there was significant effect of biomass and spike yield on grain yield, while under drought stress conditions, biomass and plant height had more positive direct effect on grain yield. Some traits such as harvest index and plant height showed difference response and effect on grain yield in both the environments. Cluster analysis assorted the genotypes in three groups.
Second group genotypes achieved the highest yield in both the environments.
These genotypes could be successfully grown under both favorable and stress conditions. Finally, the differential responses of these genotypes to drought stress were mainly due to differences in their ability to maximize the grain yield production. To develop new genotypes with improved high vegetative biomass, spike yield and consequently grain yield, as proved in this study, breeders would need access to parents with
considerable improvements in these
REFERENCES
Attarbashi, M. R.; Galeshi, S.; Soltani, A.; Zinali, E. (2002), Relationship of phenology and physiological traits with grain yield in wheat under rain-fed conditions. Iranian Journal of Agricultural Science, 33, p. 8-21.
Bruckner, P.L.; Frohberg, R.C. (1987), Stress tolerance and adaptation in spring wheat. Crop Science, 27, p.31–36.
Denciĉ, S.; Kastori, R.; Kobiljski, B; Duggan, B. (2000), Evaluation of grain yield and its components in wheat cultivars and landraces under near optimal and drought conditions. Euphytica, 113, p.43-52. Destro, M.; Miglioranza, E.; Aria, C.A.A.; Vandram,
J.M.; de Almieda, J.C.V. (2001), Main Stem and Tiller Contribution to Wheat Cultivars yield Under Different Irrigation Regimes. Brazilian Archives of Biology and Technology, 44, p.325-330.
Dofing, S. M.; Knight, C.W. (1992), Alternative model for path analysis of small-grain yield. Crop Science, 32, p.487–489.
Garc´ıa del Moral, L.F.; Miralles, D.J.; Slafer, G.A. (2002), Initiation and appearance of vegetative and reproductive structures throughout barley development. In: G.A. Slafer, J.L. Molina, R. Savin, J.L. Araus and I. Romagosa (Eds.), Barley Science: Recent Advances from Molecular Biology to Agronomy of Yield and Quality, p. 243–268. Food Products Press, The Harworth Press.,New York. Garcia del Moral, L.F.; Ramos, J.M.; Garcia del Moral,
M.B.; Jimenez-Tejada, P. (1991), Ontogenetic approach to grain production in spring barley based on path-coefficient analysis. Crop Science, 31, p.1179–1185.
Garcia de Moral, L.F.; Rharrabti, Y.; Elhani, S.; Martos, V.; Royo, C. (2005), Yield formation in Mediterranean durum wheat under two contrasting water regimes based on path-coefficient analysis. Euphytica, 146, p. 203-212.
Guler, M.; Adak, M.S.; Ulukan, H. (2001), Determining relationships among yield and some yield components using path coefficient analysis in chickpea (Cicer arietinum L.). European Journal of Agronomy, 4, p.161-166.
Hirayama M.; Wada, Y.; Nemoto, H. (2006), Estimation of drought tolerance based on leaf temperature in upland rice breeding. Breeding Science, 56, p.47-54.
Khoshnazar, P.R.; Ahmadi, M.R.; Ghanadha, M.R (2000), A study of adaptation and yield capacity of rapeseed (Brassica napus L.) cultivars and lines. Iranian Journal of Agricultural Science, 31, p.341-352.
Kolte, S.J.; Awasthi, R.P.; Vishwanath (2000), Divya mustard: a useful source to creat alternaria black spot tolerance dwarf varieties of oilseed brassica. Plant varieties and Seeds, 13, p.107-111.
Korkut, Z.K.I.; Bilir, S. (1993), The studies path coefficient and correlation of durum wheat. Symposium of Durum Wheat and Its Products, Ankara, p, 183-187.
Rajaram, S.; Braun, H.J.; Van Ginkel, M. (1996), CIMMYT’s approach to breed for drought tolerance. Euphytica, 92, p.147-153.
SAS Institute Inc., (1997), SAS/STAT Software: Changes and Enhancements through Release 6.12. Cary, N.C.
Simane, B.; Struik, P.C.; Nachit, M.M.; Peacock, J. M. (1993), Ontogenic analysis of field components and yield stability of durum wheat in water-limited environments. Euphytica, 71, p.211-219.
Sio-Se Marde, A.; Poustini, K.; Mohammadi, V. (2006), Evaluation of drought resistance indices under various environmental conditions. Field Crop researches, 98, p.222-229.
Slafer, G.A.; Calderini, D.F.; Miralles, D.J. (1996), Yield components and compensation in wheat: Opportunities for further increasing yield potential. In: M.P. Reynolds, S. Rajaramand A. McNab (Eds.), Increasing yield potential in wheat: Breaking the Barriers, p.101–133.CIMMYT, Mexico.
Stringam, G.R.; Degenhardt, D.F.; Thaigarajah, M.R.; Bansal, V.K.; Hawkins, G.P. (2002), Kelsey summer rape. Canadian Journal of Plant Science, 82, p.559-560.
Subhani, G.M.; Chowhdry, M.A. (2000), Correlation and path coefficient analysis in bread wheat under drought stress and normal conditions. Pakistan Journal of Biological Sciences, 3, p.72-77.
Talebi, R.; Fayaz, F; Jelodar, N.A. (2007), Correlation and path coefficient analysis of yield and yield components of chickpea (Cicer arietinum L) under dry land condition in the west of Iran. Asian Journal of Plant Sciences, 6. 1151-1154.
Ulukan, H.; Guler, M.; Keskin, S.D.D.K. (2003), A path coefficient analysis some yield and yield components in faba bean ( Vicia faba L.) genotypes. Pakistan Journal of Biological Sciences, 6, p.1951-1955.