Introduction
The literature is robust regarding the practice of physical activities for the management of patients with diabetes mellitus, especially type 2 diabetes mellitus (T2DM) 1,2. The positive effect of physical activity programs can be identified by the improvement in glycemic control according to the glycated hemoglobin (HbA1c) exam, since glycemia is evaluated over a long period, reflecting the glucose concentrations within of the last 120 days 3.
It is already well established that both types of physical exercise, i.e. aerobic and strength, bring innumerable benefits to patients with T2DM 4,5, such as increased maximal oxygen utilization (VO2max) and cardiopulmonary fitness, as well as peripheral adaptations, represented by the increased transport and oxidation of fatty acids, improved capillary density 6 and mitochondrial capacity 7.
Additionally, combined training has shown positive results for glycemic control, as seen by HbA1c analysis 2,8. However, it is known that hyperglycemic peaks experienced on a day to day basis and between physical training sessions have been strongly associated with the development of diabetes complications 9, regardless of the values of fasting glycemia and HbA1c 10. In this sense, little is known about the effects of successive physical training sessions, especially of the programs that combine strength and aerobic in the same
session, on the capillary glycemia of patients with T2DM. In view of the above, the present study investigated the behavior of glycemia in subjects with T2DM during 36 sessions of a combined training program.
Methods
Design
This is a single arm clinical study, an analysis of secondary data from Bassi et al.2, which was registered in the Brazilian Registry of Clinical Trials (protocol RBR-492q8z). In addition, the study procedures were approved by the Research Ethics Committee of the University Center of Araraquara (protocol 1318/11). In this sense, individuals with a clinical diagnosis of T2DM according to the Brazilian Society of Diabetes 3 were interviewed and evaluated, considering the inclusion and exclusion criteria of the study.
Participants
Participants were recruited through advertisements in newspapers, local magazines and flyers. All those who Original Article (short paper)
Glycemic behavior in patients with type 2 diabetes during a short period
of a combined training program
Daniela Bassi1,2, Almir Vieira Dibai-Filho3, Leonardo Hesley Durans1, Renata Gonçalves Mendes4, Flávia Cristina Rossi Caruso4, Vivian Maria Arakelian4, Audrey Borghi-Silva4
1Universidade Ceuma, Department of Physical Therapy, São Luís, MA, Brazil;
2Universidade Ceuma, Postgraduate Program in Management and Health Services, São Luís, MA, Brazil; 3Universidade Federal do Maranhão, UFMA, Department of Physical Education, São Luís, MA, Brazil; 4Universidade Federal de São Carlos, UFSCar, Department of Physical Therapy, São Carlos, SP, Brazil
Abstract — Aim: The present study investigated the behavior of glycemia in subjects with type 2 diabetes (T2DM) during 36 sessions of a combined training program. Methods: This is a single arm clinical study with 20 patients with T2DM submitted to combined exercise training (strength and aerobic exercise). The sessions occurred on alternate days, 3x/week, lasting ~ 80 minutes, totaling ~ 240 minutes/week, for 12 weeks, over a total of 36 sessions. Capillary glycemia was measured before and 10 to 15 minutes after the end of each combined exercise session. Results: There was a significant reduction (p<0.05) in glycemia after application of the combined training program in 27 (75%) of the 36 sessions. Regarding the maintenance of this reduction after about 48 hours, no significant differences were identified (p>0.05). When investigating the cumulative effect of the 36 sessions of combined training program on capillary glycemia, no significant differences were observed (p>0.05). Conclusion: Glycemia exhibits a behavior of reduction immediately after concurrent strength and aerobic training programs in patients with T2DM. However, the immediate reduction of glycemia is not maintained until 48 hours, nor is there a cumulative effect of the 36 training sessions on baseline glycemia.
responded to the advertisements were prescreened by phone to confirm interest in, followed by in person with the aim of verifying the criteria of eligibility for, the study prior to clinic-based enrollment visits. All of the enrolled subjects provided written informed consent. Participants with T2DM, of both sexes, were recruited to this study. Of these, 20 subjects agreed to participate in combined physical training, consisting of strength and aerobic exercise.
Sample size was calculated based on a previous study by Mikus, Oberlin, Libla, Boyle, Thyfault11. Sample size was determined using Ene Software, version 3.0 (Autonomous University of Barcelona, Spain), considering a significance level of 0.05 and a power of 0.80. We considered for the calculation the difference between the mean of 0.3 mmol/L and the standard deviation of 0.4 mmol/L. Based on these criteria, at least 16 participants were necessary.
The inclusion criteria were: 1) individuals with T2DM with a sedentary lifestyle for at least 6 months according to the American Heart Association criteria 12. The exclusion criteria were: 1) a confirmed diagnosis of any heart disease, 2) uncontrolled hypertension, 3) any musculoskeletal disorders, 4) any confirmed diagnosis of respiratory disease, and 5) confirmed autonomic neuropathy.
All participants were instructed to maintain their usual medical care and received dietary advice on healthy eating by a nutritionist; however, there was no specific dietary intervention with regard to eating habits.
Strength and endurance training program
Combined exercise training consisted of individually supervised sessions under the supervision of exercise specialists. Sessions occurred on alternate days, 3x/week, lasting ~ 80 minutes, totaling ~ 240 minutes/week, for 12 weeks, over a total of 36 sessions.
The sessions included: 1) 5 min warm-up; 2) combined training protocol for 60 min; and 3) 5 min of cool-down. The determination of the loads for the 1 repetition maximal test (1RM) was applied, gradually increasing the resistance until the volunteer could perform no more than one repetition 13. The equipment was familiarized by the individuals, for
three previous sessions of the 1RM determination. The order of training was alternated with each session, meaning that the aerobic training was followed by strength training in the first session, and in the next session the strength training was followed by aerobic training; this was in order to avoid any bias.
The aerobic training was performed with heart rate corresponding to 60-70% of peak VO2 for a period of 30 minutes per session on a stationary bicycle 14. Strength training was performed with the intensity of 60-80% of 1RM, as recommended by the American College of Sports Medicine 12,15. The program consisted of eight strength
exercises, with the major muscle groups being worked out, as recommended by the American Diabetes Association 16. The subjects performed four exercises for the upper limbs: biceps with free weights, seated paddling, triceps and supine; and four exercises for the lower limbs: leg press, extensor chair, calf, and flexor chair. Each exercise consisted of three sets of 10-12 repetitions. The amount of weight lifted was progressively increased at each session in order to maintain consistent repetitions, that is, with correct and complete movements during the training program. A rest period of 2-3 minutes between the sets was performed allowing maximum muscle recovery.
Capillary glycemia
Capillary glycemia was measured before and 10 to 15 minutes after the end of each combined exercise session using an Accu-Chek Active portable gauge (Roche Diagnostics GmbH, Mannheim, Germany), according to the manufacturer’s instructions. If the blood glucose was >13.9 mmol/L (or 250 mg/dL) before starting the exercise, the session would be cancelled, and if it was >13.9 mmol/L more than twice in one week, the patient would be referred for a medical visit.
Statistical analysis
Initially, the normality of the data was verified by means of histograms. After normal distribution was determined, the comparisons between glycemia values throughout the 36 treatment sessions were performed using the repeated measures analysis of variance (ANOVA) post hoc Bonferroni. Data processing was performed in SPSS, version 17.0 (Chicago, IL, USA), assuming a significance level of 5%.
Results
Table 1. Demographical and clinical characteristics for individuals with type 2 diabetes mellitus (T2DM) at baseline.
Variables Mean (standard deviation)
Gender (F/M) 8/12
Age (years) 49.40 (5.54)
Weight (kg) 82.18 (18.88)
Height (cm) 1.68 (0.11)
BMI (kg/m2) 28.96 (5.13)
HbA1c Pre Training Period (%) 8.33 (1.69)
HbA1c Post Training Period (%) 7.30 (1.20)
Duration of T2DM (years) 5.70 (5.50)
Cholesterol (mg/dL) 195.00 (47.89)
Data are reported as means (SD). BMI: body mass index, HbA1c: Glycated haemoglobin.
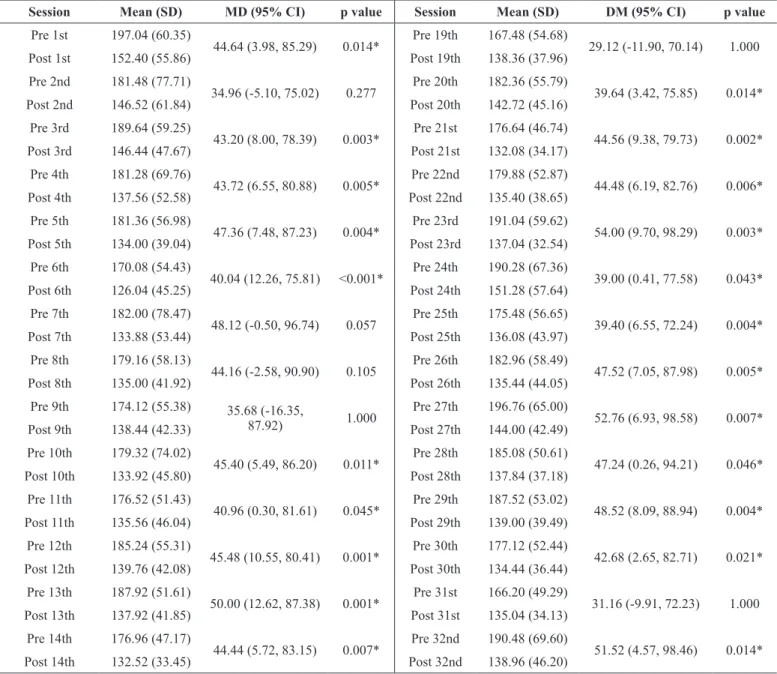
Table 2 . Comparison of blood glucose values (mg/dL) before and after each session of strength and aerobic training program.
Session Mean (SD) MD (95% CI) p value Session Mean (SD) DM (95% CI) p value
Pre 1st 197.04 (60.35)
44.64 (3.98, 85.29) 0.014* Pre 19th 167.48 (54.68) 29.12 (-11.90, 70.14) 1.000
Post 1st 152.40 (55.86) Post 19th 138.36 (37.96)
Pre 2nd 181.48 (77.71)
34.96 (-5.10, 75.02) 0.277 Pre 20th 182.36 (55.79) 39.64 (3.42, 75.85) 0.014*
Post 2nd 146.52 (61.84) Post 20th 142.72 (45.16)
Pre 3rd 189.64 (59.25)
43.20 (8.00, 78.39) 0.003* Pre 21st 176.64 (46.74) 44.56 (9.38, 79.73) 0.002*
Post 3rd 146.44 (47.67) Post 21st 132.08 (34.17)
Pre 4th 181.28 (69.76)
43.72 (6.55, 80.88) 0.005* Pre 22nd 179.88 (52.87) 44.48 (6.19, 82.76) 0.006*
Post 4th 137.56 (52.58) Post 22nd 135.40 (38.65)
Pre 5th 181.36 (56.98)
47.36 (7.48, 87.23) 0.004* Pre 23rd 191.04 (59.62) 54.00 (9.70, 98.29) 0.003*
Post 5th 134.00 (39.04) Post 23rd 137.04 (32.54)
Pre 6th 170.08 (54.43)
40.04 (12.26, 75.81) <0.001* Pre 24th 190.28 (67.36) 39.00 (0.41, 77.58) 0.043*
Post 6th 126.04 (45.25) Post 24th 151.28 (57.64)
Pre 7th 182.00 (78.47)
48.12 (-0.50, 96.74) 0.057 Pre 25th 175.48 (56.65) 39.40 (6.55, 72.24) 0.004*
Post 7th 133.88 (53.44) Post 25th 136.08 (43.97)
Pre 8th 179.16 (58.13)
44.16 (-2.58, 90.90) 0.105 Pre 26th 182.96 (58.49) 47.52 (7.05, 87.98) 0.005*
Post 8th 135.00 (41.92) Post 26th 135.44 (44.05)
Pre 9th 174.12 (55.38) 35.68 (-16.35,
87.92) 1.000
Pre 27th 196.76 (65.00)
52.76 (6.93, 98.58) 0.007*
Post 9th 138.44 (42.33) Post 27th 144.00 (42.49)
Pre 10th 179.32 (74.02)
45.40 (5.49, 86.20) 0.011* Pre 28th 185.08 (50.61) 47.24 (0.26, 94.21) 0.046*
Post 10th 133.92 (45.80) Post 28th 137.84 (37.18)
Pre 11th 176.52 (51.43)
40.96 (0.30, 81.61) 0.045* Pre 29th 187.52 (53.02) 48.52 (8.09, 88.94) 0.004*
Post 11th 135.56 (46.04) Post 29th 139.00 (39.49)
Pre 12th 185.24 (55.31)
45.48 (10.55, 80.41) 0.001* Pre 30th 177.12 (52.44) 42.68 (2.65, 82.71) 0.021*
Post 12th 139.76 (42.08) Post 30th 134.44 (36.44)
Pre 13th 187.92 (51.61)
50.00 (12.62, 87.38) 0.001* Pre 31st 166.20 (49.29) 31.16 (-9.91, 72.23) 1.000
Post 13th 137.92 (41.85) Post 31st 135.04 (34.13)
Pre 14th 176.96 (47.17)
44.44 (5.72, 83.15) 0.007* Pre 32nd 190.48 (69.60) 51.52 (4.57, 98.46) 0.014*
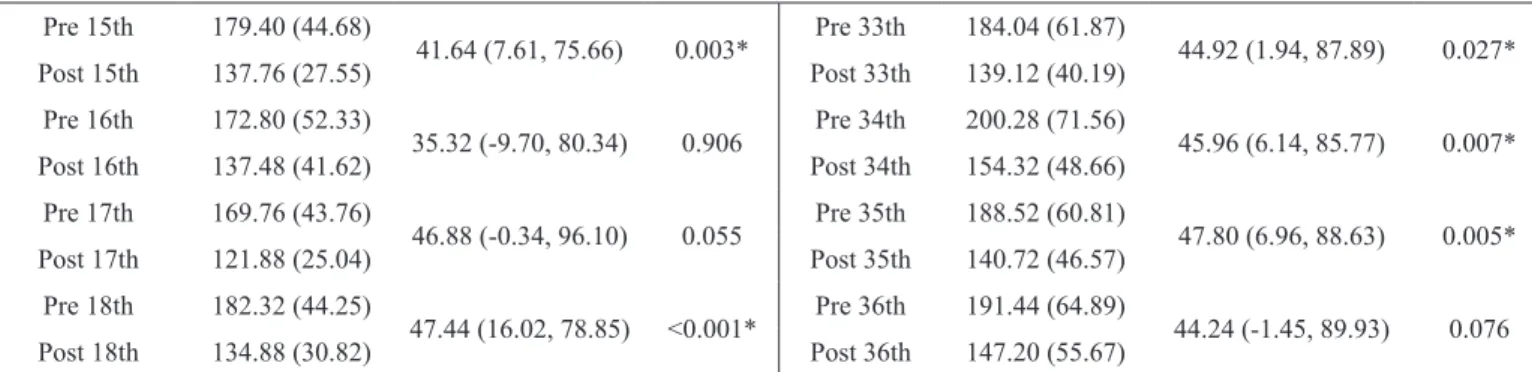
Pre 15th 179.40 (44.68)
41.64 (7.61, 75.66) 0.003* Pre 33th 184.04 (61.87) 44.92 (1.94, 87.89) 0.027*
Post 15th 137.76 (27.55) Post 33th 139.12 (40.19)
Pre 16th 172.80 (52.33)
35.32 (-9.70, 80.34) 0.906 Pre 34th 200.28 (71.56) 45.96 (6.14, 85.77) 0.007*
Post 16th 137.48 (41.62) Post 34th 154.32 (48.66)
Pre 17th 169.76 (43.76)
46.88 (-0.34, 96.10) 0.055 Pre 35th 188.52 (60.81) 47.80 (6.96, 88.63) 0.005*
Post 17th 121.88 (25.04) Post 35th 140.72 (46.57)
Pre 18th 182.32 (44.25)
47.44 (16.02, 78.85) <0.001* Pre 36th 191.44 (64.89) 44.24 (-1.45, 89.93) 0.076
Post 18th 134.88 (30.82) Post 36th 147.20 (55.67)
SD: Standard deviation; MD: Mean difference; CI: Confidence interval of difference; *Significant difference (p < 0.05, Repeated measures ANOVA post hoc Bonfer -roni).
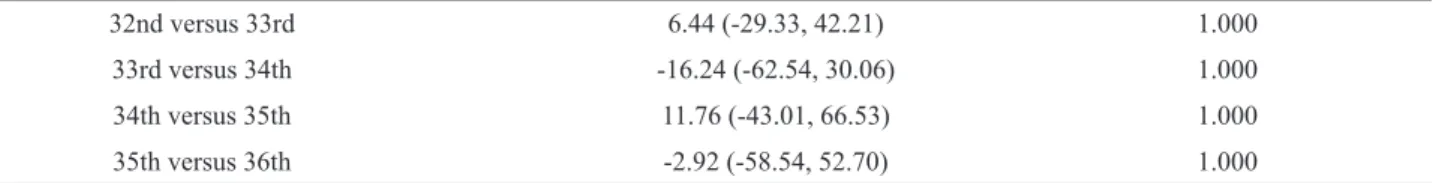
Table 3. Comparison of blood glucose values (mg/dL) before each session of strength and aerobic training program.
Sessions MD (95% CI) p value
1st versus 2nd 15.56 (-41.19, 72.31) 1.000
2nd versus 3rd -8.16 (-69.71, 53.39) 1.000
3rd versus 4th 8.36 (-37.08, 53.80) 1.000
4th versus 5th -0.08 (-62.18, 62.02) 1.000
5th versus 6th 11.28 (-34.98, 57.54) 1.000
6th versus 7th -11.92 (-69.81, 45.97) 1.000
7th versus 8th 2.84 (-45.70, 51.38) 1.000
8th versus 9th 5.04 (-50.92, 61.00) 1.000
9th versus 10th -5.20 (-60.35, 49.95) 1.000
10th versus 11th 2.80 (61.33, 66.93) 1.000
11th versus 12th -8.72 (-53.92, 36.48) 1.000
12th versus 13th -2.68 (-54.96, 49.60) 1.000
13th versus 14th 10.96 (-44.40, 66.32) 1.000
14th versus 15th -2.44 (-46.23, 41.35) 1.000
15th versus 16th 6.60 (-43.81, 57.01) 1.000
16th versus 17th 3.04 (-46.11, 52.19) 1.000
17th versus 18th -12.56 (-55.00, 29.88) 1.000
18th versus 19th 14.84 (-24.45, 54.13) 1.000
19th versus 20th -14.88 (-73.46, 43.70) 1.000
20th versus 21st 5.72 (-48.17, 59.61) 1.000
21st versus 22nd -3.24 (-39.47, 32.99) 1.000
22nd versus 23rd -11.16 (-61.98, 39.66) 1.000
23rd versus 24th 0.76 (-66.69, 68.21) 1.000
24th versus 25th 14.80 (-33.92, 63.52) 1.000
25th versus 26th -7.48 (-49.21, 34.25) 1.000
26th versus 27th -13.80 (-65.11, 37.51) 1.000
27th versus 28th 11.68 (-48.13, 71.49) 1.000
28th versus 29th -2.44 (-42.78, 37.90) 1.000
29th versus 30th 10.40 (-34.59, 55.39) 1.000
30th versus 31st 10.92 (-29.68, 51.52) 1.000
32nd versus 33rd 6.44 (-29.33, 42.21) 1.000
33rd versus 34th -16.24 (-62.54, 30.06) 1.000
34th versus 35th 11.76 (-43.01, 66.53) 1.000
35th versus 36th -2.92 (-58.54, 52.70) 1.000
MD: Mean difference; CI: Confidence interval of difference. No significant difference (p > 0.05, Repeated measures ANOVA post hoc Bonferroni).
Table 4. Comparison of blood glucose values (mg/dL) after each session of strength and aerobic training program.
Sessions MD (95% CI) p value
1st versus 2nd 5.88 (-34.23, 45.99) 1.000
2nd versus 3rd 0.08 (-42.89, 43.05) 1.000
3rd versus 4th 8.88 (-35.46, 53.22) 1.000
4th versus 5th 3.56 (-39.65, 46.77) 1.000
5th versus 6th 7.96 (-23.60, 3952) 1.000
6th versus 7th -7.84 (-47.28, 31.60) 1.000
7th versus 8th -1.12 (-35.25, 33.01) 1.000
8th versus 9th -3.44 (-39.92, 33.04) 1.000
9th versus 10th 4.52 (-26.92, 35.96) 1.000
10th versus 11th -1.64 (-48.68, 45.40) 1.000
11th versus 12th -4.20 (-33.39, 24.99) 1.000
12th versus 13th 1.84 (-33.35, 37.03) 1.000
13th versus 14th 5.40 (-36.97, 47.77) 1.000
14th versus 15th -5.24 (-42.25, 31.77) 1.000
15th versus 16th 0.28 (-39.97, 40.53) 1.000
16th versus 17th 15.60 (-21.60, 52.80) 1.000
17th versus 18th -13.00 (-45.10, 19.10) 1.000
18th versus 19th -3.48 (-32.77, 25.81) 1.000
19th versus 20th -4.36 (-50.28, 41.56) 1.000
20th versus 21st 10.64 (-30.23, 51.51) 1.000
21st versus 22nd -3.32 (-22.11, 15.47) 1.000
22nd versus 23rd -1.64 (-35.92, 32.64) 1.000
23rd versus 24th -14.24 (-66.43, 37.95) 1.000
24th versus 25th 15.20 (-17.93, 48.33) 1.000
25th versus 26th 0.64 (-30.98, 32.26) 1.000
26th versus 27th -8.56 (-35.90, 18.78) 1.000
27th versus 28th 6.16 (-29.36, 41.68) 1.000
28th versus 29th -1.16 (-24.56, 22.24) 1.000
29th versus 30th 4.56 (-21.19, 30.31) 1.000
30th versus 31st -0.60 (-30.41, 29.21) 1.000
31st versus 32nd -3.92 (-40.10, 32.26) 1.000
32nd versus 33rd -0.16 (-23.75, 23.43) 1.000
33rd versus 34th -15.20 (-48.13, 17.73) 1.000
34th versus 35th 13.60 (-20.27, 47.47) 1.000
35th versus 36th -6.48 (-36.66, 23.70) 1.000
Discussion
We observed in the present study that capillary glycemia presents an immediate reduction after performing the combined training. However, there is no maintenance of this reduction over time, that is, in a period of time equal to or greater than 48 hours.
The global literature has presented favorable results in the context of the improvement of long-term glycemic control evaluated by means of HbA1c in subjects with T2DM 2,12 and practitioners of combined physical exercise programs 2,8,17. However, in the present study, we observed that the efficacy of the hypoglycemic effects evaluated through capillary glycemia during a physical training program, even when combined, are limited to a short period of time, that is, a maximum of 48 hours.
Corroborating our study, another investigation aimed to evaluate the glycemic behavior of individuals with T2DM after a single exercise session with mild to moderate intensity and identified that both the capillary glycemia levels and the amplitude of their fluctuation were lower after the session of exercise. Thus, this study was conclusive in showing the beneficial effects of physical exercise within 24 hours after the session 5.
Systematic review and meta-analysis with the objective of identifying the effect of strength training on glycemic control of individuals with T2DM suggests that such exercise modality can be recommended even in the early stages of the disease, especially for those with poor glycemic control evaluated by HbA1c 12. However, even in the case of a systematic review, there were no reports of glycemic control in the intra-training period (over successive training sessions).
The present study expected to find a glycemic control window longer than 48 hours, since the combination of aerobic exercises, which are known to improve fasting glycemia 18,19, and strength exercises, which are better at glycemic control over time evaluated by HbA1c 2,8. In this scenario, an interesting recent study conducted with children with type 1 diabetes mellitus aimed to evaluate the association of cardiorespiratory fitness with glycemic variability, and observed that the two are negatively correlated. Thus, lower glycemic variability indicates the better physical fitness of the individual 20.
In the present study, we observed that capillary glycemia decreases after each combined training session, but is not maintained for more than 48 hours. This fact can be explained by exercise stimulates blood glucose disposal, in addition, induces a transient increase in whole-body insulin sensitivity for 48 h 18. Holloszy (2005) shows that the acute glucose lowering effect of exercise results from high muscle glucose uptake determined by increased insulin sensitivity induced by muscle contraction 21, in addition, King; Baldus, Sharp et al. (1995)22 already showed this effect it lasted up to 72 h after a single exercise bout 22. Afterwards, Figueira et al. (2013)23 using continuous glucose monitoring, does not confirm the long glucose reduction after the combined exercise sessions (strength and aerobic exercises), corroborating our study23. It is known that physical exercise determines the increase in insulin sensitivity,
which is achieved by the increase of the GLUT4 protein, which is determined by the AMPK activity in the increased skeletal muscle 21,24. It has already been demonstrated in literature, for a long time these changes occur very rapidly after the exercise onset and can last 16 h after the intervention 24. It is noteworthy that a high carbohydrate diet is associated with the development of glycogen super compensation, preventing an increase in the insulin response 25, while the carbohydrate free diet maintains an increase in GLUT4 and insulin response for days after exercise 26. In the present study, patients were instructed to maintain their usual carbohydrate intake, which could justify the reduced duration of the exercise-induced hypoglycemic effect. However, it is emphasized that HbA1c at the end of the same training program was significantly reduced according to a previous study carried out by our group 2, suggesting that the beneficial effects of exercise on long-term glycaemic control, showed by HbA1c, can be ascribed to the cumulative effects of the succeeding bouts of exercise. Due to the implications of glycemic variation in patients with T2DM, it is still necessary to search for more specific physical exercises and/or different loads or forms of performance that aim to reduce glycemic variations and maintain glycemic capillaries at values close to normal for a longer period of time.
There are some limitations to the current study, including the non-use of continuous glucose monitoring. It is known that the continuous monitoring equipment of blood glucose would be the most indicated, but it is worth noting the high cost of the equipment. However, capillary glycemia was measured before and after each training session.
Conclusion
Glycemia exhibits a behavior of reduction immediately after concurrent strength and aerobic training programs in patients with T2DM. However, the immediate reduction of glycemia is not maintained until 48 hours, nor is there a cumulative effect of the 36 training sessions on baseline glycemia.
References
1. Colberg SR, Sigal RJ, Fernhall B, Regensteiner JG, Blissmer BJ, Rubin RR, et al. Exercise and type 2 diabetes: the American College of Sports Medicine and the American Diabetes Association: joint position statement executive summary. Diabetes Care. 2010 Dec;33(12):2692–6. 2. Bassi D, Mendes RG, Arakelian VM, Caruso FCR, Cabiddu
R, Júnior JCB, et al. Potential Effects on Cardiorespiratory and Metabolic Status After a Concurrent Strength and Endurance Training Program in Diabetes Patients — a Randomized Controlled Trial. Sport Med - Open. 2016 Dec;2(1):31.
4. Yardley JE, Iscoe KE, Sigal RJ, Kenny GP, Perkins BA, Riddell MC. Insulin Pump Therapy Is Associated with Less Post-Exercise Hyperglycemia than Multiple Daily Injections: An Observational Study of Physically Active Type 1 Diabetes Patients. Diabetes Technol Ther. 2013 Jan;15(1):84–8.
5. Church TS, Blair SN, Cocreham S, Johannsen N, Johnson W, Kramer K, et al. Effects of Aerobic and Resistance Training on Hemoglobin A 1c Levels in Patients With Type 2 Diabetes. JAMA. 2010 Nov;304(20):2253.
6. Porter C, Reidy PT, Bhattarai N, Sidossis LS, Rasmussen BB. Resistance Exercise Training Alters Mitochondrial Function in Human Skeletal Muscle. Med Sci Sports Exerc [Internet]. 2015 Sep [cited 2018 Jan 16];47(9):1922–31. Available from: http://www.ncbi.nlm.nih.gov/pubmed/25539479 7. Lundby C, Jacobs RA. Adaptations of skeletal muscle
mitochondria to exercise training. Exp Physiol [Internet]. 2016 Jan 1 [cited 2018 Jan 16];101(1):17–22. Available from: http://doi.wiley.com/10.1113/EP085319
8. Liu Y, Liu S-X, Cai Y, Xie K-L, Zhang W-L, Zheng F. Effects of combined aerobic and resistance training on the glycolipid metabolism and inflammation levels in type 2 diabetes mellitus. J Phys Ther Sci. 2015 Jul;27(7):2365–71. 9. Hirsch IB. Glycemic Variability and Diabetes Complications: Does It Matter? Of Course It Does! Diabetes Care [Internet]. 2015 Aug [cited 2018 Jan 16];38(8):1610–4. Available from: http://www.ncbi.nlm.nih.gov/pubmed/26207054
10. Suh S, Kim JH. Glycemic Variability: How Do We Measure It and Why Is It Important? Diabetes Metab J [Internet]. 2015 Aug 1 [cited 2018 Jan 16];39(4):273. Available from: https://synapse.koreamed.org/DOIx.php?id=10.4093/ dmj.2015.39.4.273
11. Mikus CR, Oberlin DJ, Libla J, Boyle LJ, Thyfault JP. Glycaemic control is improved by 7 days of aerobic exercise training in patients with type 2 diabetes. Diabetologia. 2012 May;55(5):1417–23.
12. Colberg SR, Sigal RJ, Fernhall B, Regensteiner JG, Blissmer BJ, Rubin RR, et al. Exercise and type 2 diabetes: the American College of Sports Medicine and the American Diabetes Association: joint position statement. Diabetes Care. 2010 Dec;33(12):e147-67.
13. Owen N, Healy GN, Matthews CE, Dunstan DW. Too much sitting: the population health science of sedentary behavior. Exerc Sport Sci Rev. 2010 Jul;38(3):105–13.
14. Wilborn C, Greenwood M, Wyatt F, Bowden R GD. The effects of exercise intensity and body position on cardiovascular variables during resistance exercise. JEP Online. 2004;7(4):29–36.
15. Sigal RJ, Kenny GP, Wasserman DH, Castaneda-Sceppa C, White RD. Physical Activity/Exercise and Type 2 Diabetes: A consensus statement from the American Diabetes Association. Diabetes Care [Internet]. 2006 Jun 1 [cited 2018 Jan 17];29(6):1433–8. Available from: http://www. ncbi.nlm.nih.gov/pubmed/16732040
16. Donnelly JE, Blair SN, Jakicic JM, Manore MM, Rankin JW, Smith BK. American College of Sports Medicine
Position Stand. Appropriate physical activity intervention strategies for weight loss and prevention of weight regain for adults. Med Sci Sports Exerc. 2009 Feb;41(2):459–71. 17. Ishiguro H, Satoru Kodama B, Chika Horikawa B, Kazuya Fujihara B, Ayumi Sugawara Hirose B, Reiko Hirasawa B, et al. In Search of the Ideal Resistance Training Program to Improve Glycemic Control and its Indication for Patients with Type 2 Diabetes Mellitus: A Systematic Review and Meta-Analysis. Sport Med [Internet]. 2016 [cited 2017 Dec 21];46:67–77. Available from: https://link.springer.com/ content/pdf/10.1007%2Fs40279-015-0379-7.pdf
18. Van Dijk J-W, Tummers K, Stehouwer CDA, Hartgens F, Van Loon LJC. Exercise Therapy in Type 2 Diabetes Is daily exercise required to optimize glycemic control?
19. Ghana Medical Association. B, Moses MO, Eghan BA, Sarpong PA. Ghana medical journal. [Internet]. Vol. 51, Ghana Medical Journal. Ghana Medical Association; [cited 2018 Jan 16]. 120-127 p. Available from: https://www.ajol. info/index.php/gmj/article/view/162100
20. Liubaoerjijin Y, Terada T, Fletcher K, Boulé NG. Effect of aerobic exercise intensity on glycemic control in type 2 diabetes: a meta-analysis of head-to-head randomized trials. Acta Diabetol [Internet]. 2016 Oct 2 [cited 2018 Jan 16];53(5):769–81. Available from: http://www.ncbi.nlm. nih.gov/pubmed/27255501
21. Holloszy JO. Exercise-induced increase in muscle insulin sensitivity. J Appl Physiol [Internet]. 2005 Jul [cited 2018 Jun 16];99(1):338–43. Available from: http://www.ncbi. nlm.nih.gov/pubmed/16036907
22. King DS, Baldus PJ, Sharp RL, Kesl LD, Feltmeyer TL, Riddle MS. Time course for exercise-induced alterations in insulin action and glucose tolerance in middle-aged people. J Appl Physiol [Internet]. 1995 Jan [cited 2018 Jun 16];78(1):17–22. Available from: http://www.ncbi.nlm.nih. gov/pubmed/7713807
23. Figueira FR, Umpierre D, Casali KR, Tetelbom PS, Henn NT, Ribeiro JP, et al. Aerobic and Combined Exercise Sessions Reduce Glucose Variability in Type 2 Diabetes: Crossover Randomized Trial. Song Y, editor. PLoS One [Internet]. 2013 Mar 11 [cited 2018 Jun 16];8(3):e57733. Available from: http://www.ncbi.nlm.nih.gov/pubmed/23536769 24. Ren JM, Semenkovich CF, Gulve EA, Gao J, Holloszy JO.
Exercise induces rapid increases in GLUT4 expression, glucose transport capacity, and insulin-stimulated glycogen storage in muscle. J Biol Chem [Internet]. 1994 May 20 [cited 2018 Jun 16];269(20):14396–401. Available from: http://www.ncbi.nlm.nih.gov/pubmed/8182045
25. Host HH, Hansen PA, Nolte LA, Chen MM, Holloszy JO. Glycogen supercompensation masks the effect of a traininginduced increase in GLUT-4 on muscle glucose transport. J Appl Physiol [Internet]. 1998 Jul [cited 2018 Jun 16];85(1):133–8. Available from: http://www.ncbi.nlm. nih.gov/pubmed/9655766
Cycling Exercise: Spinning with a Continuous Glucose Monitoring System. Diabetes Technol Ther [Internet]. 2006 Dec [cited 2018 Jun 16];8(6):627–35. Available from: http:// www.ncbi.nlm.nih.gov/pubmed/17109594
Corresponding author
Daniela Bassi. Universidade
Ceuma, Centro de Ciências da Saúde, Departamento de Fisioterapia, Rua Josué Montello, 1, Jardim Renascença, São Luís, MA, Brasil.
Email: [email protected]
Manuscript received on May 6, 2018 Manuscript accepted on July 2, 2018