DOI: http://dx.doi.org/10.5007/1980-0037.2015v17n1p91
original article
Licence Creative Commom
CC
RBCDH
1 Federal University of Santa Ca-tarina. Physical efort Laboratory. Sports Center. Florianopolis, SC. Brazil.
2 Federal University of Santa Ca-tarina. Biomechanics Laboratory. Sports Center. Florianopolis, SC. Brazil;
3 Italian Football Federation. Foo-tball Training and Biomechanics Laboratory. Technical Department. Coverciano, Florence, Italy.
Received: 03 April 2014 Accepted: 12 May 2014
Efects of four weeks of repeated sprint
training on physiological indices in futsal
players
Efeito de quatro semanas de treinamento de
sprints
repetidos sobre índices isiológicos em atletas de futsal
Paulo Cesar do Nascimento1
Ricardo Dantas De Lucas1
Juliano Dal Pupo2
Francimara Budal Arins1
Carlo Castagna3
Luiz Guilherme Antonacci Guglielmo1
Abstract– he aim of this study was to investigate the efects of short repeated-sprint ability (RSA) training on the neuromuscular and physiological indices in U17 futsal players during the competitive period. Fourteen players were divided into two groups: intervention group (n = 8) and control group (n = 6). Both groups performed a repeated maximal sprint test (40-m MST), intermittent shuttle-running test (Carminatti’s test) and vertical jumps before and ater the training period. he intervention group was submitted to an additional four-week repeated sprints program, twice a week, while the control group maintained their normal training routine. here was no signiicant interaction between time and groups for all variables analysed (p > 0.05). However, a signiicant main efect was observed for time (p < 0.01) indicating an increase on speed at heart rate delection
point (VHRDP)and the continuous jump performance while the peak lactate(40m-LACpeak)
and sprint decrement decreased ater training, in both groups. Still, based on efect sizes (ES) the greater changes with practical relevance were veriied for intervention group
in important variables such as peak velocity (ES = 0,71), VHRDP (ES = 0,83) and
40m-LACpeak (ES = 1,00). his study showed that RSA-based and normal training routine are equally efective in producing changes in the analysed variables during a short period of intervention. However, the efect size suggests that four weeks of RSA training would be a minimum time that could induce the irst changes of futsal player’s physical itness.
Key words: Aerobic capacity; Blood lactate; Repeated-sprint ability; Team sports; Com-petitive period.
I
NTRODUCTION
Futsal is the indoor version of soccer, a 5-a-side game played on a court with reduced dimensions (40 x 20 m) and unlimited substitutions are per-mitted during the matches. Consequently, physical demands of the game
may result in being very high1. Analysis of movement demands during
the 40-minute period (2 x 20 min of stop-time) characterizes futsal as an intermittent and high-intensity modality that requires both aerobic and
anaerobic metabolism1-4. One must consider that despite appearing to be
similar, the modality have intrinsic diferences in comparison with the soccer, among which one must consider the characteristics of the move-ment pattern whereas the futsal shows the execution of a greater number of runs of high intensity , sprints and changes of direction, resulting in a greater demand for braking and accelerations therefore, there is a claim to a greater degree of anaerobic pathways to supplement the energy demand of metabolism1,3.
he repeated-sprints ability (RSA) has been considered as one of the most important aspects for futsal players’ performance3-5. It has been shown
that during oicial matches, professional futsal players spent at least 20% of the game-time in high-intensity actions (i.e., sprinting and high-intensity
running)1,3. he physiological demand of RSA and several actions
dur-ing futsal matches have similar metabolic responses (e.g., decrease in pH muscle level, creatine phosphate, ATP and an important demand on both glycolytic and oxidative systems)1,4,6,7.
An eicient strategy to develop some physiological markers for team sports8 seems to be the repeated-sprints performed with directional changes
and therefore could be adopted as a training model to improve futsal play-ers’ performance. According to previous studies, RSA-based training might promote improvement in the ability to repeat high intensity exercise, and increases of aerobic itness in non-athletes9-12 and team-sport athletes8,13.
Although RSA-based training has been used for the physical training, there is no suicient scientiic information in the literature regarding the physiological and neuromuscular impact from this training model on fut-sal, especially during a competitive period4,5. Oliveira et al.5 have reported
that 2-3 oicial matches played per week during in-season for high level futsal players was enough to maintain aerobic itness and improve the best sprint of RSA, even with observed low physical training demand. In comparison to professional futsal players, the frequency of oicial weekly matches observed in amateur players during competitive season is only once a week supposedly requiring additional training sessions.
METHODOLOGICAL PROCEDURES
Participants
Subjects selection was intentional non-probabilistic. Eighteen amateur male U17 futsal players (16.7 ± 0.5 years, 68.5 ± 6.6 kg, 176.6 ± 4.5 cm and 10.1 ± 4.0% body fat) volunteered to participate in this study. All players were from the same team located in Florianópolis, SC, Brasil. he main inclusion criterion to participate in this investigation was that all subjects should be involved in a systematic training program in the last four years. he athletes had competed at the regional level usually playing one oicial match per week. he participants were divided randomly into two groups: intervention (GRSA, n = 10) and control (GCONTROL, n = 8). However, during the period of the study, there were two participants in each group that presented muscle injuries during the matches and were withdrawn from the study. hus, the inal sample size was 8 for GRSA and 6 for GCONTROL.
Written informed consent was received from all participants and legal guardians of the under-age players ater a brief but detailed explanation about the aims, beneits and risks involved with this investigation. All pro-cedures were approved by the ethics committee of the Federal University of Santa Catarina, Florianopolis, Brazil (number 224/08), in accordance to the Helsinki declaration.
Design
he GRSA performed a short period of four weeks of the RSA-based
train-ing program, with a frequency of two sessions per week. However, on the
others days of week, both groups (GRSA and GCONTROL) maintained their
normal training routine (Table 1 and 2). In the irst (i.e., pretest) and the sixth week (i.e., post testing) the players performed the following assess-ments: 1) determining the vertical jumping performance, 2) progressive distance intermittent shuttle-running protocol, and 3) repeated maximal sprint test. Prior to each testing session, stretching and warm-up exercises were performed for about 20 min. he entire study period (testing and intervention) took place during the competitive season and it was incor-porated into the daily routine of team training (2 hours per day, 5 days a week). he tests were applied at the same time of the day, at least 24 hours apart, and all the athletes were instructed to maintain a similar nutrition and hydration routine before the performance evaluations. Players were familiarized with these tests, since during the season the players were submitted to these protocols.
Training Protocol
During the four weeks of the season, the GRSA was submitted to additional two sessions per week of a training protocol adapted from the model
proposed by Ferrari Bravo et al.8 All RSA-based training which consists
consists of three sets of six sprints, with 20 s of passive recovery between the sprints and 4 min of passive recovery between the sets. All sprints were
performed with 180o direction changes every 10 m. he distance of 10 m,
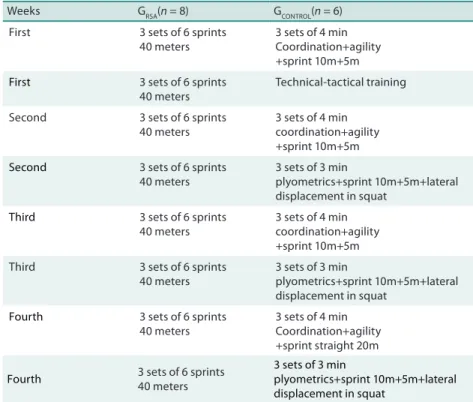
instead of 20 m was adopted in the present study in order to adjust to the shorter displacement of futsal players during a game. At the end of each repeated sprint intervention session the distance the athletes travelled was 720 m. During the entire intervention period both groups performed the training established by the coaches at the beginning of the season (e.g., tactical and technical training, drills), except for the days in which the GRSA performed the additional repeated sprints and GCONTROL maintained the normal work routine (Table 1 and Box 1).
Table 1. Training conducted by control group during the eight sessions of additional sprint training for intervention group.
Weeks GRSA(n = 8) GCONTROL(n = 6)
First 3 sets of 6 sprints
40 meters
3 sets of 4 min Coordination+agility +sprint 10m+5m
First 3 sets of 6 sprints 40 meters
Technical-tactical training
Second 3 sets of 6 sprints
40 meters
3 sets of 4 min coordination+agility +sprint 10m+5m
Second 3 sets of 6 sprints 40 meters
3 sets of 3 min
plyometrics+sprint 10m+5m+lateral displacement in squat
Third 3 sets of 6 sprints 40 meters
3 sets of 4 min coordination+agility +sprint 10m+5m
Third 3 sets of 6 sprints
40 meters
3 sets of 3 min
plyometrics+sprint 10m+5m+lateral displacement in squat
Fourth 3 sets of 6 sprints 40 meters
3 sets of 4 min Coordination+agility +sprint straight 20m
Fourth 3 sets of 6 sprints
40 meters
3 sets of 3 min
plyometrics+sprint 10m+5m+lateral displacement in squat
GRSA = Intervention group. GCONTROL = Control group.
Aerobic indices measurements
he progressive distance intermittent shuttle-running protocol (Carmin-atti’s test -TCAR)15,16 was performed by the futsal players to determine the
aerobic indices. his test has been shown highly reliable (ICC = 0.94, CV = 1.4% for PV) for soccer players.15 Carminatti’s test consists of
progres-sive intermittent shuttle runs performed between 2 lines set at progresprogres-sive distances. he test protocol considers a starting speed of 9 km·h-1 and a
by a constant frequency (i.e. 6 s) audio cue (beep), which determines the running speed to be performed between the parallel lines demarcated in the ground and marked by cones. he test ends when the subject fails to stay on time with the audio cues on the front line for 2 successive occasions (i.e. objective criteria) or the perceived inability on the part of the subject to cover more distance at the attained speed level (i.e. subjective criteria). Four experienced stafs from research team were responsible for making sure that the participants fulilled the testing criteria and to control pos-sible pacing strategy. his control held by verbal encouragement to the players when they presented exhaustion signals. he heart rate (HR) was recorded at the end of each stage by means of a frequency (Polar, model S610i; Kempele, Finland) for subsequent calculation of the HR delection
point (HRDP), through the mathematical method named Dmax17. he
velocity of HRDP (VHRDP) was deined as the speed for the HRDP and
considered as an aerobic capacity index. he highest speed achieved (peak velocity – PV) by the athletes during the test was considered as an aerobic
power index. A previous study16 showed no signiicant diference of PV
obtained during Carminatti’s test with the velocity at maximal oxygen uptake (vVO2max) obtained on the traditional treadmill incremental test.
Box 1. Training program conducted by both groups during the period four weeks of intervention.
Days
Monday Tuesday Wednesday Thursday Friday Saturday Sunday
Weeks 1 (pre-test) NT 10% warm-up 20% TPC 40 % technical 30% tactical intermittent shuttle-running test (Carminatti’s test) vertical jump performance repeated maximal sprint test (40m-MST) NT 10% warm-up 20% TPC 40 % technical 30% tactical Rest Rest 2 NT 10% warm-up 20% TPC 40 % technical 30% tactical RSA 10% warm-up 20% RSA 50% technical 20% tactical NT 10% warm-up 50 % technical 40% tactical RSA 10% warm-up 20% RSA 50% technical 20% tactical NT 10% warm-up 20% TPC 40 % technical 30% tactical
NT
10% warm-up 20% TPC 40 % technical 30% tactical Rest 3 NT 10% warm-up 20% TPC 40 % technical 30% tactical
NT
10% warm-up 20% TPC 40 % technical 30% tactical RSA 10% warm-up 20% RSA 50% technical 20% tactical Game ~70 min NT 10% warm-up 50 % technical 40% tactical RSA 10% warm-up 20% RSA 50% technical 20% tactical Rest 4 RSA 10% warm-up 20% RSA 50% technical 20% tactical NT 10% warm-up 50 % technical 40% tactical RSA 10% warm-up 20% RSA 50% technical 20% tactical NT 10% warm-up 20% TPC 40 % technical 30% tactical Rest Game ~70 min Game ~70 min 5 Rest NT 10% warm-up 20% TPC 40 % technical 30% tactical RSA 10% warm-up 20% RSA 50% technical 20% tactical NT 10% warm-up 50 % technical 40% tactical RSA 10% warm-up 20% RSA 50% technical 20% tactical Game
~70 min Rest
6 (post testing) NT 10% warm-up 20% TPC 40 % technical 30% tactical intermittent shuttle-running test (Carminatti’s test) vertical jump performance repeated maximal sprint test (40m-MST) NT 10% warm-up 50 % technical 40% tactical
Game
~70 min Rest
Anaerobic indices measurements
To determine the anaerobic indices, a repeated maximal sprint test (40-m MST) was performed as proposed by Baker et al.18. he protocol consists of
eight sprints of 40 m with two changes of direction (180°) and 20 s of pas-sive recovery period between each sprint. Measures of best and mean time in the 40-m MST showed very good test-retest reliability (ICC=0.92 and 0.91, respectively)19. his test consists of a run starting from the midpoint
between 20 m, marked by a pair of photocells, to the irst mark 10 m away, followed by a return of 20 m running in the opposite direction until the second mark and inishing with a run of 10 m to pass photocells again. he time was electronic recorded by a pair of photocells (CEFISE Speed Test 6.0; 0.001 s resolution; São Paulo, Brazil) placed a meter above loor level, ap-proximately on the height of the hips. To prevent any erroneous timing start due the arms movement the starting line was brought forward 50 cm. he timer was started automatically when athletes passed through the infrared signal from the photocells and stopped when they passed the photocells at 40 m. he best time (40m-BT), mean time (40m-MT) and percentage decrement score (40m-Sdec) were measured in the sprints. he 40m-Sdec was calculated using the following equation: [(Σ 8TIMES / BT * 8) -1] * 100 20.
Blood Lactate measurements
To determine the peak blood lactate concentration (40m-LACpeak) in the repeated maximal sprint test, 25 µL of blood samples were collected from the earlobe using a heparinized capillary ater 1st, 3rd, 5th, 7th and 10th minutes of recovery. he blood
was stored in polyethylene microtube covers (Eppendorf) and subsequently the lactate concentrations were assessed using an electrochemical analyzer (YSI 2700 STAT; Yellow Springs, OH, USA), calibrated according to the manufacturer’s
recommendations before each analysis. he 40m-LACpeak was considered as
the highest value of lactate concentration obtained during the recovery period.
Vertical jumps measurements
To evaluate the lower limbs muscular power, athletes performed three counter movement jumps (CMJ) and one set of continuous jumps (CJ) for 15 s with the hands on the hips 21. he tests were performed on a piezoelectric force
platform (QUATTRO JUMP, model 9290AD; Winterthur, Switzerland), oper-ating at a frequency of 500 Hz. Jump height was calculated by double ground reaction force (GRF) integration. First, the acceleration curve was calculated by dividing GRF values by body mass, measured on the platform itself. Ater that, a trapezoidal integration of the acceleration curve was used to obtain the velocity curve. he latter was integrated again to obtain distance at each time point of the movement, and the greatest vertical distance was entered as the jump height22. he mean height of the three CMJ was used in the analysis.
S
tatistical analyses
groups. Assumptions of sphericity were assessed using the Mauchly test and any violations were corrected using the Greenhouse-Geisser correc-tion factor. he level of signiicance adopted was set at p < 0.05. Further, to analyze the magnitude of the efects caused by the training, the efect sizes (ES) were calculated as the diference between the means divided by the mean standard deviation to characterize the practical (clinical) signiicance rather than the statistical signiicance, according to Hedges and Olkin23. he
following criteria for efect sizes were used: < 0.1 = trivial, 0.1–0.3 = trivial/ small, 0.3–0.5 = small, 0.5–0.7 = small/moderate, 0.7–1.1 = moderate, 1.1–1.3 = moderate/large, 1.3–1.9 = large, 1.9–2.1 = large/very large and > 2.1 = very large, which were adopted according to the criteria established by Battern-ham and Hopinks.24 Analyses were performed using the Statistical Package
for Social Sciences Windows® (SPSS Inc. version 15.0; Chicago, IL, USA).
RESULTS
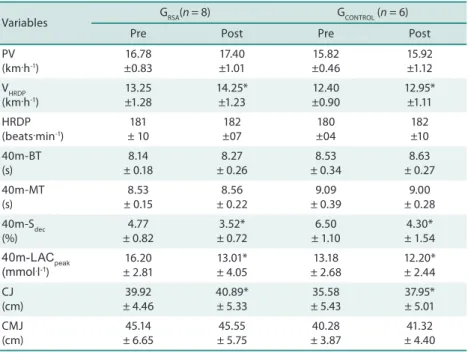
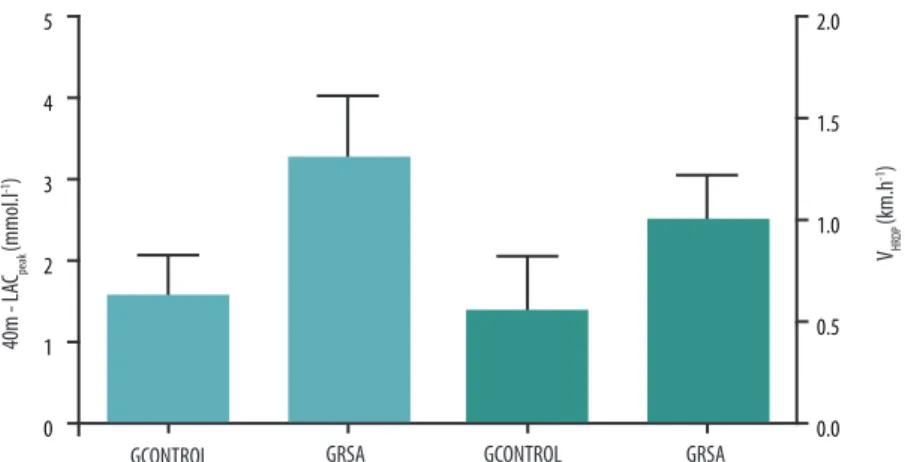
he indices assessed before and ater the short training period in both groups (GRSA, GCONTROL) are described in Table 2. No signiicant interaction (time vs. group) was observed for variables analysed (p > 0.05). However, a signiicant main efect for time was observed for VHRDP (F = 19.95; p < 0.001), 40m-LACpeak (F = 12.70; p = 0.003), 40m-Sdec (F = 18.53; p = 0.001) and CJ performance (F = 7.67; p = 0.017). his result indicates an improvement on VHRDP and CJ while 40m-LACpeak and 40m-Sdec decreased ater 4-week period, in both groups. However, the ES presented in Table 3 showed a trend of greater changes for GRSA compared to GCONTROL (Figure 1).
Table 2. Aerobic and anaerobic variables and jump performances of both groups before and after the training period.
Variables GRSA(n = 8) GCONTROL (n = 6)
Pre Post Pre Post
PV (km.h-1)
16.78 ±0.83 17.40 ±1.01 15.82 ±0.46 15.92 ±1.12 VHRDP (km.h-1)
13.25 ±1.28 14.25* ±1.23 12.40 ±0.90 12.95* ±1.11 HRDP (beats.
min-1)
181 ± 10 182 ±07 180 ±04 182 ±10 40m-BT (s) 8.14 ± 0.18 8.27 ± 0.26 8.53 ± 0.34 8.63 ± 0.27 40m-MT (s) 8.53 ± 0.15 8.56 ± 0.22 9.09 ± 0.39 9.00 ± 0.28 40m-Sdec (%) 4.77 ± 0.82 3.52* ± 0.72 6.50 ± 1.10 4.30* ± 1.54 40m-LACpeak
(mmol.l-1)
16.20 ± 2.81 13.01* ± 4.05 13.18 ± 2.68 12.20* ± 2.44 CJ (cm) 39.92 ± 4.46 40.89* ± 5.33 35.58 ± 5.43 37.95* ± 5.01 CMJ (cm) 45.14 ± 6.65 45.55 ± 5.75 40.28 ± 3.87 41.32 ± 4.40
Table 3. Efect sizes and absolute change for all variables measured.
Variables
GRSA(n = 8) GCONTROL(n = 6)
Absolute change
Efect
size Descriptor
Absolute
change Efect size Descriptor
PV (km.h-1)
0.62
± 0.92 0.71 Moderate
0.10
± 0.93 0.13
Trivial/ small
VHRDP (km.h-1)
1.00
± 0.62 0.83 Moderate
0.55
± 0.67 0.55
Small/ moderate
HRDP (bpm)
1.75
±6.84 0.21
Trivial/ small
1.17
± 9.37 0.25
Trivial/ small
40m-BT (s)
0.13
± 0.23 0.87 Moderate
0.09
± 0.27 0.33 Small
40m-MT (s)
0.04
± 0.20 0.20
Trivial/ small
-0.09
± 0.18 0.27
Trivial/ small
40m-Sdec (%)
-1.25
± 1.01 1.79 Large
-2.19
± 1.95 1.72 Large
40m-LACpeak (mmol.l-1)
-3.18
± 2.38 1.00 Moderate
-0.98
± 1.82 0.39 Small
CJ (cm)
0.96
± 2.52 0.22
Trivial/ small
2.37
± 1.74 0.45 Small
CMJ (cm)
0.41
± 2.81 0.09 Trivial
1.03
± 2.0 0.25
Trivial/ small
GRSA = Intervention Group. GCONTROL = Control Group. PV = Peak velocity. VHRDP = velocity corresponding at heart rate delection point. HRDP = heart rate delection point. 40m-BT = Best time. 40m-MT = Mean time. 40m-Sdec = percentage decrement score. 40m-LACpeak = peak of lactate concentration. CJ = Continuous jump. CMJ = Counter movement jump.
Figure 1. Absolute change for 40m-LACpeak and VHRDP. 40m-LACpeak = peak of lactate concentration (blue bar). VHRDP = velocity corresponding at heart rate delection point (green pattern).
D
ISCUSSION
he main inding in this study indicates that there was a marked
improve-ment in both groups in indices related to aerobic (VHRDP) and anaerobic
(40m-Sdec, 40m-LACpeak) performance as well as vertical jump performance (CJ), demonstrating that both RSA and normal training routine are equally efective in producing changes in the analysed variables in a short period of intervention during the season.
observed no diferences in the analysed variables between groups (RSA and interval training groups). On the other hand, recent studies utilizing RSA training intervention have reported signiicant increases in indices related to anaerobic and aerobic power8,10,however in a greater period of time than
what has been employed in the present investigation. he researchers have attributed these indings to an increase in both glycolytic26,27 and oxidative
enzymes activity,9, 26 muscle bufering capacity9,28 and ionic regulation28.
Additionally, Spencer et al.6 observed that the energetic supply of repeated
short sprints requires ATP resynthesis from each energy system. herefore, a wide range of metabolic aerobic and anaerobic adaptations can be ex-pected to result from such training10. It is important to highlight that most
of the aforementioned studies were conducted with active or untrained populations, compared to trained athletes in the present investigation.
In the present study we hypothesized that a short period of RSA-based training during the competitive phase would improve indices mainly related to the aerobic power (i.e. peak velocity) in futsal players, since this index is also inluenced by underlying capacities (i.e. anaerobic capacity
and muscle power)14. However, this hypothesis was not conirmed in this
investigation. hough, the ES showed greater improvements with
practi-cal signiicance of PV in the GRSA (moderate) when compared to GCONTROL
(trivial). From a practical view, this represents a considerable
improve-ment in aerobic power performance (0.6 Km·h-1; 3.8%). his percentage
of improvement is more than twice the typical error reported to the PV (CV = 1.4 %)15, suggesting an efective change triggered by the RSA
train-ing. Considering that PV may be an index determined by the anaerobic
capacity, muscle power and neuromuscular skill to run at high speeds14,
the ‘moderate’ ES calculated for GRSA, may be justiied by physiological
adaptations that are inherent to RSA training. Studies2,6 have shown that
subjects with greater aerobic power have superior ability to resist fatigue during repeated sprints, especially during the latter stages.
he index related to aerobic capacity (i.e. VHRDP) increased signiicantly in both groups, but represented a greater percentage of change (+7.7%) in the GRSA (ES = 0.83, moderate). he aerobic capacity seems to be positively afected by the RSA training as demonstrated by Ferrari Bravo et al.8 which
assessed the ventilatory threshold in soccer players ater seven weeks of RSA training sessions during a competitive phase. his may suggest im-portant changes in the performance of futsal players since the oxidative metabolism pathways are essential for phosphocreatine resynthesis during the recovery from high-intensity exercise such as repeated sprints2,6,9. his
suggests that individuals with an elevated aerobic itness should be able to resynthesize phosphocreatine faster between repeated sprints6,8,10 allowing
the athletes to perform a greater number of sprints at maximum or near
maximum intensity during matches2.
in the GRSA. From a practical point of view, one can observe that the players sustained the same maximal intensity with a lower induction of metabolic acidosis, which could result in better performances during matches. Futsal match dynamics difer to soccer, mainly due to constant substitution of players as well as the dimensions of the court. hus, one could consider a massive contribution of anaerobic pathways during a match. According to Dawson et al.10 the rapid rate of phosphocreatine resynthesis appears
to be a signiicant functional adaptation of the RSA training. hus, the short period of RSA-based training would be a minimum period of time in which positive adaptations of anaerobic metabolism could be observed.
he sprint training also appears to inluence the anaerobic capacity as demonstrated by Tønnessen et al.29 that applied a protocol of intermittent
sprint training with alactic anaerobic characteristics (3-5 sets, 4-5 repeti-tions of 40 m, recovery time between sprints 90 s and 10 min between sets) for 10 weeks (once a week) with 10 soccer players. Interestingly, the authors found signiicant improvements in mean time of the RSA test (10x 40 m) for both intervention and control groups, although the intervention group improved mean time with greater magnitude than the control group. hus, the researchers concluded that the extra RSA training may provide anaerobic metabolic adaptations. In contrast to the present study, Ferrari Bravo et al.8 observed a signiicant decrease in the 40m-MT values (2.1%);
on the other hand, no signiicant diferences in the 40m-Sdec was found
ater seven weeks of RSA training in the group of soccer players. A possible explanation may be attributed to the fact that these authors applied a test with characteristics very similar to the training protocol used. his way, the
values of the variables 40m-MT and 40m-Sdec may have been a consequence
of the greater speciicity from the method of evaluation, which may have inluenced the particular adaptations.
he non-signiicant changes in the 40m-BT ater training in the present study corroborates the indings of the literature for soccer players8.On the
other hand, using a sample group of 30 students, Markovic et al.13 observed
that ater 10 weeks of sprint training there was an improvement of 3.1% in a single sprint performance. In addition, Dawsom et al.10 observed similar
efects when analyzing nine physically active subjects during a six-week period. hus, it appears that sprint training causes signiicant changes in anaerobic performance; however, it seems to depend on a speciic model of sprints (i.e. volume of training) and the level of the subject’s physical itness. Whereas a wide range of performance and metabolic adaptations can be expected as a result from such training, especially in subjects who are not well-trained either aerobically or anaerobically10.
In addition to the physiological variables measured, we examined the inluence of the RSA-based training on neuromuscular parameters as verti-cal jump performance. his variable that relects lower limb muscle power22
importance of lower limb muscle power in the sprints with changes of direc-tion, which require a braking force followed by a propulsive force, factors that can determine the performance of these actions2,3,6,30.Lakomy and Haydon30
suggest that the muscle contraction during RSA, required for acceleration and deceleration of body mass, may be beneicial to the improvement of muscle power and the ability to change directions. In the present study, there was no signiicant improvement in CMJ for both groups. he short period of training intervention and the characteristics of RSA training might explain this result. On the other hand, Dawson et al.10 and Markovic et al.13
demon-strated that RSA training with volumes considerably larger than the present research (a greater number of repetitions, sets, distances, and sessions per week) was capable of improving muscle power in CMJ in physically active subjects ater 6 and 10 week interventions, respectively. Still, Tønnessen et al.29
in the aforementioned study, found signiicant improvements in CMJ ater 10 weeks of sprint training in U17 soccer players. Markovic et al.13 suggested
that signiicant improvements in CMJ power and height, obtained from sprint training may be explained by fast and eicient utilization of elastic energy in stretch-shortening muscle cycles and increased strength and power of knee extensor muscles, strongly engaged in the actions of fast running.
Regarding CJ, there was a signiicant main efect for time, showing an increase in performance for both groups. his result might be explained by characteristics of this 15-s continuous jump test, since it is determined
by both metabolic and neuromuscular factors.21 he reasons for the
non-signiicant diferences found between groups may be attributed to the plyometric training performed by GCONTROL during the intervention period, that is considered a valid alternative when the aim is the improvement of
muscular power levels13. Future studies monitoring electromyography
ac-tivity during RSA may indicate whether such increases in muscular power would be due to neural or muscular adaptations.
A limitation of the present study was the inal sample size. here were two subjects in each group who did not complete the study due to muscle injury during the matches. Other limitation was the short period of train-ing intervention due to the periodization of the team. hus, the results of the present study should be interpreted with caution.
CONCLUSION
he short period of RSA-based training was not enough to induce im-provements diferent from those observed in normal training routines, i.e., both were equally efective in producing changes in the analyzed vari-ables. However, the efect size showed that RSA training induced greater improvements with practical signiicance in variables related to aerobic power and aerobic capacity, as well as lactic anaerobic capacity, suggesting that four weeks would be a minimum training time that could enhance the physical itness of futsal players.
indings and points out that the methodology used could be an alternative way to improve the aerobic and anaerobic capabilities. hus, this method seems to be more suitable to team sport athletes. Nevertheless, we believe that the proposed training should be conducted for a longer periods of time compared to that used in this intervention. Also, given the impor-tance of the neuromuscular aspects on futsal performance, additional power and strength training may be required to improve muscle power and short-sprint ability, considering that these aspects have not improved with 4-week RSA training.
Acknowledgments
We express our gratitude to all athletes and coaches involved in this study, as well as, all the laboratory staf (Physical efort Laboratory and Biome-chanics Laboratory) whom participated in data collection.
REFERENCES
1. Barbero-Alvarez JC, Soto VM, Barbero-Alvarez V, Granda-Vera J. Match analysis
and heart rate of futsal players during competition. J Sports Sci 2008;26(1):63-73.
2. Bishop D, Girard O, Mendez-Villanueva A. Repeated-sprint ability - part II:
recom-mendations for training. Sports Med 2011;41(9):741-56.
3. Castagna C, D’Ottavio S, Vera JG, Alvarez JC. Match demands of professional
Futsal: A case study. J Sci Med Sport 2009;12(4):490-4.
4. Castagna C, Barbero-Alvarez J. Physiological demands of an intermittent
futsal-oriented high-intensity test. J Strength Cond Res 2010;24(9):2322-9.
5. Oliveira RS, Leicht AS, Bishop D, Barbero-Álvarez JC, Nakamura FY. Seasonal
changes in physical performance and heart rate variability in high level futsal players. Int J Sports Med 2013;34(5):424-30.
6. Spencer M, Bishop D, Dawson D, Goodman C. Physiological and Metabolic
Re-sponses of Repeated-Sprint Activities: Speciic to Field-Based Team Sports. Sports Med 2005;35(12): 1025-44.
7. Wragg CB, Maxwell NS, Doust JH. Evaluation of the reliability and validity of a
soc-cer-speciic ield test of repeated sprint ability. Eur J Appl Physiol 2000;83(1):77-83.
8. Ferrari Bravo D, Impellizzeri FM, Rampinini E, Castagna C, Bishop D, Wislof
U. Sprint vs. Interval Training in Football. Int J Sports Med 2008;29(8):668-74.
9. Burgomaster KA, Hughes SC, Heigenhauser GJ, Bradwell SN, Gibala MJ. Six
ses-sions of sprint interval training increases muscle oxidative potential and cycle endurance capacity in humans. J Appl Physiol 2005;98(6):1985-90.
10. Dawson B, Fitzsimons M, Green S, Goodman C, Carey M, Cole K. Changes in
performance, muscle metabolites, enzymes and ibre types ater short sprint train-ing. Eur J Appl Physiol Occup Physiol 1998;78(2):163-9.
11. Ortenblad N, Lunde PK, Levin K, Andersen JL, Pedersen PK. Enhanced
sarcoplas-mic reticulum Ca(2+) release following intermittent sprint training. Am J Physiol Regul Integr Comp Physiol 2000;279(1):152-60.
12. Rodas G, Ventura JL, Cadefau JA, Cusso R, Parra J. A short training program
for the rapid improvement of both aerobic and anaerobic metabolism. Eur J Appl Physiol 2000; 82(5-6):480-6.
13. Markovic G, Jikic I, Milanovic, D, Metikos, D. Efects of sprint and plyometric
training on muscle function and athletic performance. J Strength Cond Res 2007;21(2):543-9.
Corresponding author
Paulo Cesar do Nascimento Rua Silvio Possobon, 70. Apt 1009, Abraão,
CEP: 88085-190, Florianópolis. SC. Brasil.
Email: [email protected]
itness. Sports Med 2000;29(6):373-86.
15. Da Silva JF, Guglielmo LGA, Carminatti LJ, De Oliveira FR, Dittrich N, Paton C.
Validity and reliability of a new test (Carminatti’s test) for soccer players compared to laboratory-based measures. J Sports Sci 2011;29(15):1621-8.
16. Dittrich N, Da Silva JF, Castagna C, De Lucas RD, Guglielmo LGA. Validity of
Carminatti’s test to determine physiological indices of aerobic power and capacity in soccer and futsal players. J Strength Cond Res 2011;25(11):3099-106.
17. Kara M, Gökbel H, Bediz C, Ergene N, Uçok K, Uysal H. Determination of the
heart rate delection point by the Dmax method. J Sports Med Phys Fitness 1996;36(1):31-4.
18. Baker J, Rasbotton R, Hazeldine R. Maximal shuttle running over 40m as a measure
of anaerobic performance. Br J Sports Med 1993;27(4):228-32.
19. Glaister M, Hauck H, Abraham CS, Merry KL, Beaver D, Woods B, et al.
Familiari-zation, reliability, and comparability of a 40-m maximal shuttle run test. J Sports Sci Med 2009;8(1):77-82.
20. Fitzsimmons M, Dawson B, Ward D, Wilkinson A. Cycling and running tests of
repeated sprint ability. Aust J Sci Med Sport 1993;25(1):82-7.
21. Bosco C. Strength Assessment with the Bosco’s test. Rome, ITA: Italian Society of
Sport Science. 1999.
22. Dal Pupo J, Detanico D, Santos SG. Kinetic parameters as determinants of vertical
jump performance. Rev Bras Cineantropom Desempenho Hum 2012;14(1):41-51.
23. Hedges LV, Olkin I. Statistical methods for meta-analysis. San Diego, CA:
Aca-demic Press. 1985.
24. Batterham AM, Hopkins WG. Making meaningful inferences about magnitudes.
Int J Sports Phys Perform 2006;1(1):50-7.
25. Noakes TD. Implications of exercise testing for prediction of athletic performance:
a contemporary perspective. Med Sci Sports Exerc 1988;20(4):319-30.
26. Gibala MJ, Mcgee S. Metabolic adaptations to short-term high-intensity interval
training: a little pain for a lot of gain? Exerc Sport Sci Rev 2008;36(2):58-63.
27. Macdougall JD, Hicks AL, Macdonald JR, Mckelvie RS, Green HJ, Smith KM.
Muscle performance and enzymatic adaptations to sprint interval training. J Appl Physiol 1998;84(6): 2138-42.
28. Gibala MJ, Little JP, Van Essen M, Wilkin GP, Burgomaster KA, Safdar A, et
al. Short-term sprint interval versus traditional endurance training: similar initial adaptations in human skeletal muscle and exercise performance. J Physiol 2006;575(Pt 3):901-11.
29. Tønnessen E, Shalfawi SAI, Haugen T, Enoksen E. he efect of 40-m repeated
sprint training on maximum sprinting speed, repeated sprint speed endurance, vertical jump, and aerobic capacity in young elite male soccer players. J Strength Cond Res 2011;25(9):2364-70.
30. Lakomy J, Haydon DT. he efects of enforced, rapid deceleration on performance