Gliclazide and be dtim e insulin are m o re
e fficie nt than insulin alo ne fo r type 2
diabe tic patie nts with sulfo nylure a
se co ndary failure
Unidade de Diabetes, Departamento de Medicina, Hospital da Universidade Estadual do Rio de Janeiro, Rio de Janeiro, RJ, Brasil
A.C.S. Chazan and M.B. Gomes
Abstract
To determine the effects of combined therapy of gliclazide and bedtime insulin on glycemic control and C-peptide secretion, we studied 25 patients with type 2 diabetes and sulfonylurea secondary failure, aged 56.8 ± 8.3 years, with a duration of diabetes of 10.6 ± 6.6 years, fasting plasma glucose of 277.3 ± 64.6 mg/dl and a body mass index of 27.4 ± 4.8 kg/m2. Patients were submitted to three therapeutic regimens lasting 2 months each: 320 mg gliclazide (phase 1), 320 mg gliclazide and bedtime NPH insulin (phase 2), and insulin (phase 3). At the end of each period, glycemic and C-peptide curves in response to a mixed meal were determined. During combined therapy, there was a decrease in all glycemic curve values (P<0.01). Twelve patients (48%) reached fasting plasma glucose <140 mg/dl with a significant weight gain of 64.8 kg (43.1-98.8) vs 66.7 kg (42.8-101.4) (P<0.05), with no increase in peptide secretion or decrease in HbA1. C-Peptide glucose score (C-peptide/glucose x 100) increased from 0.9 (0.2-2.1) to 1.3 (0.2-4.7) during combined therapy (P<0.01). Despite a 50% increase in insulin doses in phase 3 (12 U (9-30) vs 18 U
(11-60); P<0.01) only 3 patients who responded to combined therapy maintained fasting plasma glucose <140 mg/dl (P<0.02). A tendency to a higher absolute increase in C-peptide (0.99 (0.15-2.5) vs 0.6
(0-2.15); P = 0.08) and C-peptide incremental area (2.47 (0.22-6.2) vs 1.2
(0-3.35); P = 0.07) was observed among responders. We conclude that combined therapy resulted in a better glucose response to a mixed meal than insulin alone and should be tried in type 2 diabetic patients before starting insulin monotherapy, despite difficulties in predicting the response.
Co rre spo nde nce
A.C.S. Chazan Rua do Catete, 311/812 22220-001 Rio de Janeiro, RJ Brasil
E-mail: chazan@ altavista.net
Received December 30, 1998 Accepted August 14, 2000
Ke y wo rds
·Diabetes mellitus type 2
·C-Peptide
·Secondary failure
Intro ductio n
Sulfonylurea (SU) secondary failure is the lack of continued response to SU despite initial successful treatment. After excluding those patients who did not adhere to their diets, those given inadequate dosage, those
with metabolic stress (1), or those who were, in fact, insulin dependent (2), it seems that secondary failure is determined by the dis-ease itself (3).
experimental evidence that at the time of secondary failure to SU, evening insulin plus daytime oral agents are more effective than a single injection of insulin, and just as effec-tive as a more complex multiple injection regimen without an oral agent (5,6). Several investigators have used C-peptide measure-ments in order to identify non-insulin de-pendency (7) or best responders to com-bined therapy (8,9), but there is no universal consensus about the method of stimulus ap-plication to be used to assess residual beta-cell function in type 2 diabetic patients.
The objective of the present study was to evaluate the pancreatic reserve on the basis of the C-peptide response to a mixed meal in order to identify the good responders to com-bined therapy among a group of 25 second-ary failure type 2 diabetic patients.
Patie nts and Me tho ds
Twenty-five outpatients with diabetes type 2 (18 female, 7 male), attending the Diabetes Clinic of the Rio de Janeiro State University, Rio de Janeiro, RJ, Brazil, who satisfied the National Diabetes Data Group criteria (10), aged 56.8 ± 8.3 years, with known diabetes duration of 10.6 ± 6.6 years, fasting plasma glucose (FPG) of 277.3 ± 64.6 mg/dl and a body mass index (BMI) of 27.4 ± 4.8 kg/m2, were invited to participate
in this study after its approval by the Medical Ethics Committee of the University.
Patients were selected if they had SU secondary failure, defined as at least two FPG values >180 mg/dl during a run-in pe-riod of two months of maximum dosage of SU (20 mg glibenclamide, N = 15; 320 mg gliclazide, N = 7; 500 mg chlorpropamide, N = 2, and 30 mg glipizide, N = 1), excluding clinical illness and dietetic flaws (3). On that occasion dietary orientation was optimized and instructions in self-monitoring of the urine glucose test were given.
The exclusion criteria were creatinine clearance below 70 ml min-1 1.73 m-2, the
presence of any ophthalmopathy which pre-vented insulin self-application, or symptoms of marked hyperglycemia (polyuria, poly-dipsia, weight loss).
The study consisted of three phases, each lasting two months: gliclazide (320 mg) (phase 1), gliclazide (320 mg) and bedtime NPH insulin (phase 2), and insulin as mono-therapy (phase 3).
Before entering the study, a washout pe-riod of 15 days was applied to all patients, except those who were using gliclazide (N = 7). For those using 320 mg/day gliclazide, the run-in period corresponded to phase 1.
At the end of phase 1, the criterion for eligibility for phase 2 was persistence of secondary failure to respond to gliclazide as described above.
Patients were seen at 2-week intervals, when the presence of hypoglycemia symp-toms and the results of the urine tests for glucose were checked.
During phase 2, the initial insulin dose was 6-10 U per night, varying according to patient weight (6 U for lean patients, 8 U for overweight patients and 10 U for obese pa-tients). The insulin doses were adjusted to obtain FPG <140 mg/dl.
Gliclazide was discontinued at the begin-ning of phase 3 and insulin doses were ad-justed to obtain FPG <140 mg/dl. Patients with FPG <140 mg/dl at the end of phases 2 and 3 were considered to be responders to combined therapy or to insulin as mono-therapy (11).
intake. Blood sampling was performed be-fore the ingestion of the meal and at 30, 60 and 120 min after ingestion. In our previous observations this test meal was able to stimu-late the C-peptide response in a group of nondiabetic controls (12).
Glucose was measured by an automated enzymatic colorimetric method (Cobas Mira Roche, Reutkroz, Switzerland). C-Peptide was measured by radioimmunoassay (Diag-nostic Product Corporation, Los Angeles, CA, USA; sensitivity: 0.05 ng/ml), after the removal of insulin antibody by precipitation with polyethylene glycol. Serum was stored at -20o
C for a maximum period of 3 months. The intra- and interassay coefficients of variation were 7 and 9.1%, respectively. HbA1 was determined by ion exchange chro-matography (Boehringer-Mannheim, Mann-heim, Germany), with a reference range of 4.5-8%.
The following parameters of the glucose and C-peptide curves were analyzed: 1) ba-sal value (BV); 2) peak value (PV): the highest value above the basal one after the standard meal stimulation. In patients who showed no increase after stimulation, PV was considered to be equal to BV; 3) abso-lute increase: absoabso-lute difference between PV and BV; 4) percent increase (PI): percent difference between PV and BV; 5) incre-mental area under the curve (IAUC): area below the curve and above baseline; 6) total area under the curve (TAUC): area below the curve. IAUC and TAUC were obtained by a numerical integral calculation.
The beta-cell sensitivity to glucose stim-ulation was evaluated for each patient by the following index, calculated as (C-peptide/ glucose ratio) x 100 (13).
Statistical analysis
The three treatments were compared by the Friedman test followed by the Wilcoxon signed rank test with Bonferroni correction. The data for responders and nonresponders
to combined therapy were compared by the Mann-Whitney U-test. Spearmans rank cor-relation was used to test the degree of asso-ciation between the variables studied. Pa-tients who showed no increment were ex-cluded from this analysis. These analyses were performed using the statistical program Statistica, version 5.0, for Windows. The results are expressed as median and range. A two-sided P value less than 0.05 was consid-ered to be significant.
Re sults
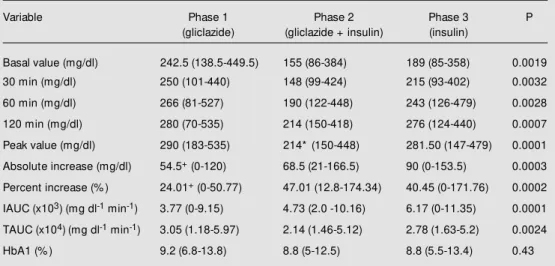
During combined therapy 12 patients (48%) reached FPG <140 mg/dl. No incre-ment in C-peptide secretion (Table 1) or decrease in HbA1 (Table 2) was noted. The C-peptide glucose score increased (0.9 (0.2-2.1) vs 1.3 (0.2-4.7); P = 0.008) during com-bined therapy with no difference between phases 1 and 3. Combined therapy resulted in weight gain (64.8 kg (43.1-98.8) vs 66.7 kg (42.8-101.4); P = 0.005), with no change in systolic blood pressure (Table 3). An in-crease in insulin dose was observed during phase 3 in comparison to phase 2 (0.19 U/kg (0.13-0.39) vs 0.27 U/kg (0.15-0.77); P = 0.001) (Table 3). Despite this increase in insulin doses in phase 3, only three patients among the responders to combined therapy maintained FPG <140 mg/dl (P<0.02). Mild hypoglycemia (self-reported), not confirmed by the capillary glucose test, was recorded in 7 patients (28%) in phase 2 and in 5 patients (20%) in phase 3.
phase 2 in comparison to phase 1 (68.5 mg/ dl (21-166) vs 54.5 mg/dl (0-120); P = 0.009). An increase in glucose PI was found in phase 2 in comparison to phase 1 (47.01% (12.8-174.34) vs 24.01% (0-50.77); P = 0.0001) and in phase 3 in comparison to phase 1 (40.45% (0-171.76) vs 24.01% (0-50.77); P = 0.0006). In all three phases, a correlation
between glucose PV and glucose BV (rS = 0.86, P<0.01; rS = 0.72, P<0.01; rS = 0.78, P<0.01, respectively) and between glucose TAUC and glucose BV (rS = 0.94, P<0.01; rS = 0.88, P<0.01; rS = 0.88, P<0.01, respectively) was observed. C-peptide PV was correlated with the basal C-peptide in all three phases (rS = 0.83, P<0.01;
Table 1 - C-Peptide response to a test meal and C-peptide/glucose score at the end of each treatment phase.
Data are reported as median (minimum-maximum). A significant difference in C-peptide/glucose score w as found betw een the 3 phases (Friedman test), w ith a difference betw een phase 2 and phase 1 (* P = 0.008, Wilcoxon test). IAUC and TAUC: Incremental and total area under the curve.
Variable Phase 1 Phase 2 Phase 3 P
(gliclazide) (gliclazide + insulin) (insulin)
Basal value (ng/ml) 2.05 (0.4-3.8) 1.9 (0.6-4.85) 1.2 (0.15-4.95) 0.61
30 min (ng/ml) 2.5 (0.31-4.15) 2.1 (0.4-8.2) 1.5 (0.3-6.2) 0.35
60 min (ng/ml) 2.8 (0.34-5.3) 2.3 (0.3-4.6) 1.5 (0.2-5.3) 0.26
120 min (ng/ml) 2.4 (0.47-5.9) 2.1 (0.5-6.1) 1.75 (0.4-5.7) 0.06
Peak value (ng/ml) 2.9 (0.6-5.9) 2.5 (0.7-8.2) 2.5 (0.6-6.2) 0.26
Absolute increase (ng/ml) 0.7 (0-2.5) 0.5 (0-3.35) 0.36 (0-3.07) 0.14
Percent increase (% ) 39.47 (0-110.25) 28.88 (0-87.09) 25.25 (0-900) 0.20
IAUC (ng ml-1 min-1) 52.50 (0-186.0) 31.50 (0-156.75) 35.25 (0-206.1) 0.22
TAUC (ng ml-1 min-1) 311.25 (50.4-581.7) 256.80 (56.25-648.75) 203.25 (54.75-669.75) 0.36
C-Peptide/glucose score 0.9 (0.2-2.1) 1.3*(0.2-4.7) 0.7 (0.1-2.3) 0.02
Table 2 -Plasma glucose response to a test meal and HbA1 at the end of each treatment phase.
Data are reported as median (minimum-maximum). HbA1: Glycated hemoglobin, IAUC and TAUC: incremen-tal and toincremen-tal area under the curve. * P<0.01, phase 1 vs 2 and phase 2 vs 3 (Wilcoxon test); +P<0.01, phase 1 vs 2 and phase 1 vs 3 (Wilcoxon test). A significant difference in glycemic curve parameters w as found betw een the 3 phases (Friedman test).
Variable Phase 1 Phase 2 Phase 3 P
(gliclazide) (gliclazide + insulin) (insulin)
Basal value (mg/dl) 242.5 (138.5-449.5) 155 (86-384) 189 (85-358) 0.0019
30 min (mg/dl) 250 (101-440) 148 (99-424) 215 (93-402) 0.0032
60 min (mg/dl) 266 (81-527) 190 (122-448) 243 (126-479) 0.0028
120 min (mg/dl) 280 (70-535) 214 (150-418) 276 (124-440) 0.0007
Peak value (mg/dl) 290 (183-535) 214* (150-448) 281.50 (147-479) 0.0001
Absolute increase (mg/dl) 54.5+ (0-120) 68.5 (21-166.5) 90 (0-153.5) 0.0003
Percent increase (% ) 24.01+ (0-50.77) 47.01 (12.8-174.34) 40.45 (0-171.76) 0.0002
IAUC (x103) (mg dl-1 min-1) 3.77 (0-9.15) 4.73 (2.0 -10.16) 6.17 (0-11.35) 0.0001
TAUC (x104)(mg dl-1 min-1) 3.05 (1.18-5.97) 2.14 (1.46-5.12) 2.78 (1.63-5.2) 0.0024
rS = 0.85, P<0.01; rS = 0.87, P<0.01, respec-tively).
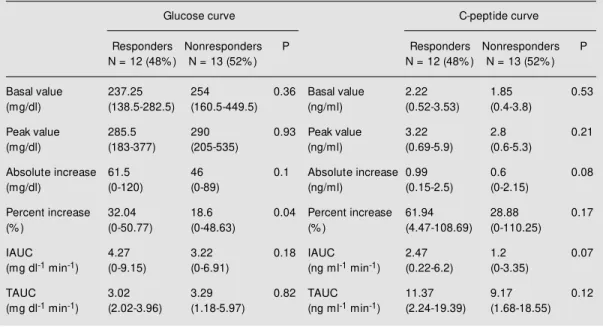
The glucose BV, the C-peptide BV, and the C-peptide/glucose score in phase 1 did not identify the patients who would respond or not to combined therapy (Table 4).
Age at diagnosis, diabetes duration and BMI did not differ between responders and nonresponders. Responders were older than
nonresponders (63.5 years (39-72) vs 55 years (44-60); P<0.035). Responders tended to show higher values of the variables that ex-press peptide increment after the meal: C-peptide absolute increase (0.99 ng/ml (1.15-2.5) vs 0.6 ng/ml (0-2.15); P = 0.08) and C-peptide IAUC (2.47 ng ml-1
min-1
(0.22-6.2) vs 1.2 ng ml-1
min-1
(0-3.35); P = 0.07) (Table 4).
Table 3 - Patient data during each treatment phase.
Data are reported as median (minimum-maximum). BM I: Body mass index, SBP: systolic blood pressure, DBP: diastolic blood pressure. * P = 0.005 vs phase 1 (Wilcoxon test). A significant difference in body w eight and BM I w as found betw een the 3 phases (Friedman test) and in insulin dose (phase 2 vs phase 3; Wilcoxon test).
Clinical data Phase 1 Phase 2 Phase 3 P
(gliclazide) (gliclazide + insulin) (insulin)
Body w eight (kg) 64.8 (43.1-98.8) 66.7* (42.8-101.4) 65.8 (42.7-104) 0.016
BM I (kg/m2) 26.19 (18.17-37.41) 26.78* (18.05-37.51) 26.49 (18-37.74) 0.016
SBP (mmHg) 150 (110-180) 140 (110-180) 140 (110-170) 0.08
DBP (mmHg) 80 (70-100) 80 (60-100) 80 (60-90) 0.53
Insulin dose (U) - 12 (9-30) 18* (11-60) 0.001
Insulin dose (U/kg) - 0.19 (0.13-0.39) 0.27* (0.15-0.77) 0.001
Table 4 - Glucose and C-peptide responses to a test meal at the end of phase 1 (gliclazide) by responders and nonresponders to combined therapy.
Data are reported as median (minimum-maximum). A significant difference in percent increase of glucose w as found in responders (M ann-Whitney test). IAUC and TAUC: Incremental and total area under the curve.
Glucose curve C-peptide curve
Responders Nonresponders P Responders Nonresponders P N = 12 (48% ) N = 13 (52% ) N = 12 (48% ) N = 13 (52% )
Basal value 237.25 254 0.36 Basal value 2.22 1.85 0.53
(mg/dl) (138.5-282.5) (160.5-449.5) (ng/ml) (0.52-3.53) (0.4-3.8)
Peak value 285.5 290 0.93 Peak value 3.22 2.8 0.21
(mg/dl) (183-377) (205-535) (ng/ml) (0.69-5.9) (0.6-5.3)
Absolute increase 61.5 46 0.1 Absolute increase 0.99 0.6 0.08
(mg/dl) (0-120) (0-89) (ng/ml) (0.15-2.5) (0-2.15)
Percent increase 32.04 18.6 0.04 Percent increase 61.94 28.88 0.17
(% ) (0-50.77) (0-48.63) (% ) (4.47-108.69) (0-110.25)
IAUC 4.27 3.22 0.18 IAUC 2.47 1.2 0.07
(mg dl-1 min-1) (0-9.15) (0-6.91) (ng ml-1 min-1) (0.22-6.2) (0-3.35)
TAUC 3.02 3.29 0.82 TAUC 11.37 9.17 0.12
D iscussio n
The combination of SU and bedtime in-sulin has been indicated in the treatment of secondary failure of oral agents because it can reduce insulin doses and simplify insu-lin therapy in patients with diabetes type 2. Nowadays, most of the patients usually start combined therapy earlier than ours did, al-though the criteria for patient selection for this type of treatment have not been fully established.
The presence of residual insulin secre-tion, with a minimal basal C-peptide >1 ng/ ml (9) and/or poststimulus levels >1.8 ng/ml (14) have been pointed out as a prerequisite for a good response to combined therapy. According to these parameters, we expected a good response to combined therapy in 22 patients (88%) since their C-peptide levels prior to insulin use were above these levels. However, only 12 patients (48%) were able to maintain their FPG levels below 140 mg/ dl and 8 of them (32%) normalized them. Despite the heterogeneity of our sample con-cerning age, duration of diabetes and BMI distribution which could have influenced our results, our data are similar to others (15-17). Nevertheless the exact mechanism un-derlying the non-response to combined therapy in some patients has not been estab-lished.
Two of the three patients who had C-peptide levels below these levels had BMI under 25 kg/m2 and diabetes duration less
than 5 years, but all three were ³35 years old at the diagnosis of diabetes. One of them responded to combined therapy, and the oth-ers had their FPG improved with this therapy. In these patients, the presence of glutamic acid decarboxylase antibody should be in-vestigated in order to exclude latent autoim-mune diabetes mellitus in adults (18).
The better metabolic control achieved by our patients with combined therapy was not accompanied by an absolute increment in the beta-cell response to a mixed meal, but
we could demonstrate the reversibility of glucose toxicity by the increase in beta-cell sensitivity to the same stimulus, with the improvement in the C-peptide/glucose score. (13).
A decrease in HbA1 after combined therapy was not noted. Probably a longer duration of combined therapy would be nec-essary to produce a significant decrease in HbA1 (9,16,17,19). Recently it was demon-strated that there is a great individual differ-ence in time course in changing HbA1c to its lowest value, with a half-time ranging from 19.5 to 48.7 days (20).
When SU was withdrawn (phase 3), a 50% increase in insulin dose was observed, as also reported in other studies (9,11,14-17,21,22). Despite this increment, only three patients among those who responded to com-bined therapy maintained their FPG below 140 mg/dl in phase 3 (P<0.02). Certainly, more complex regimens of insulin therapy would be necessary to maintain the same level of control obtained during combined therapy (6).
Although there was a significant reduc-tion in all points of the glycemic curve dur-ing phase 2 compared to phases 1 and 3, a more marked decrease in fasting blood lev-els than in the postprandial points of the glycemic curve was observed. These results demonstrate a greater influence of combined therapy on FPG than on postprandial glu-cose (11,15,23). This fact may be attributed to the suppression of hepatic production of glucose by NPH insulin given at bedtime (11,24).
during combined therapy, but we did not determine the total glucose lost in 24-h urine collection (24) or dietary intake to support this hypothesis. Studying the causes of weight gain during insulin therapy, some authors demonstrated that the improvement in meta-bolic control promotes weight gain by de-creasing both basal metabolic rate and glu-cosuria (26).
As also observed in other studies (17,19), duration of disease, BMI and previous con-trol of the disease were not useful in predict-ing the response to combined therapy. In our study, only age was significantly different between responders and nonresponders to combined therapy. These results support the conclusions reached in review articles (25,27) that no clinical variable can predict the re-sponse to combined therapy in individual patients.
Although we demonstrated a good corre-lation between fasting and stimulated C-peptide, the former value did not differ be-tween responders and nonresponders to com-bined therapy. Thus, fasting C-peptide, which could be the easiest method to determine residual beta-cell function (28), was unable to predict a good response to combined
therapy in our sample.
On the other hand, a tendency to higher stimulated C-peptide values (C-peptide ab-solute increase and C-peptide IAUC) was observed among responders. Despite the small number of patients studied (32 pa-tients would be necessary to avoid a type 2 statistical error), this fact emphasizes that the functional test may be more useful to predict a good response to combined therapy than fasting C-peptide.
Although the design of our study was not ideal to affirm that combined therapy was most effective, we observed that combined therapy resulted in a better glycemic response to a mixed meal than insulin monotherapy at bedtime, and should be used in the manage-ment of patients with diabetes type 2 before starting insulin as monotherapy, despite dif-ficulties in predicting the response.
Ackno wle dgm e nts
We would like to thank Maria de Fátima R. Gonçalves, Eliete Leão S. Clemente, Dr. Helena Gazzola, and Dr. Trude Dimetz for laboratory assistance, and Servier from Bra-zil for the supply of Gliclazide tablets.
Re fe re nce s
1. Krall LP & Bradley RF (1962). “ Secondary failures” in the treatment of diabetes mel-litus w ith tolbutamide and w ith phen-formin. Diabetes, 2 (Suppl): S88-S91. 2. Groop LC, Pelkonen R, Koskim ies S,
Bottazzo GF & Doniach D (1986). Second-ary failure to treatment w ith oral antidia-betic agents in NIDDM . Diabetes Care, 9: 129-133.
3. Groop L, Schalin C, Franssila-Kallunki A, Widen E, Ekstrand A & Eriksson J (1989). Characteristics of NIDDM patients w ith secondary failure to oral antidiabetic ther-apy. American Journal of M edicine, 87: 183-190.
4. Riddle M C (1996). Combined therapy w ith a sulfonylurea plus evening insulin: Safe, reliable and becoming routine. Hormone and M etabolic Research, 18: 430-433. 5. Wolffenbuttel BHR, Sels J-P,
Rondas-Colbers G, M enheere P & Kruseman AC (1996). Comparison of different insulin regimens in elderly patients w ith NIDDM .
Diabetes Care, 19: 1326-1332.
6. Yki-Jarvinen H, Kauppila M , Kujansuu E, Lahti J, M arjanen T, Niskanen L, Rajala S, Ryysy L, Salo S, Seppälä Ptulokas T, Viikari J, Karjalainnen J & Taskinem M -J (1992). Comparison of insulin regimens in pa-tients w ith non-insulin-dependent diabe-tes mellitus. New England Journal of M edicine, 327: 1426-1433.
7. Service EJ, Rizza RA, Zimmerman BR, Dycy P, O’Brien P & M elton III L (1997). The classification of diabetes by clinical and C-peptide criteria. Diabetes Care, 20: 198-201.
8. Castillo M , Scheen AJ, Paolisso G & Lefevre PJ (1987). The addition of glipizide to insulin therapy in type-II diabetic
pa-tients w ith secondary failure to sulfonyl-urea is useful only in the presence of a significant residual insulin secretion. Acta Endocrinologica, 116: 364-372.
9. Quartraro A, Consoli G, Ceriello A & Giugliano D (1986). Combined insulin and sulfonylurea therapy in NIDDM w ith sec-ondary failure to oral drugs: a one year follow up. Diabetes and M etabolism, 12: 315-318.
10. National Diabetes Data Group (1979). Classification and diagnosis of diabetes mellitus and other categories of glucose intolerance. Diabetes, 28: 1039-1057. 11. Stenm an S, Groop P-H, Saloranta C,
206-213.
12. Pozzan R, Dimetz T, Gazolla HM & Gomes M B (1997). The C-peptide response to a standard mixed meal in a group of Brazil-ian type 1 diabetic patients. Brazilian Jour-nal of M edical and Biological Research, 30: 1169-1174.
13. Osei K (1986). Clinical evaluation of deter-minants of glycemic control. A new ap-proach using serum glucose, C-peptide, and body mass indexes in type II diabetic patients. Archives of Internal M edicine, 146: 281-285.
14. Ward WK, Bolgiano DC, M cKnight B, Hal-ter J & Porte Jr D (1984). Diminished ß-cell secretory capacity in patients w ith NIDDM . Journal of Clinical Investigation, 74: 1318-1328.
15. Aschner P & Kattah W (1992). Effects of the combination of insulin and gliclazide compared w ith insulin alone in type 2 dia-betic patients w ith secondary failure to oral hypoglycemic agents. Diabetes Re-search and Clinical Practice, 18: 23-30. 16. Groop LC, Widen E, Ekstrand A, Saloranta
C, Franssila-Kallunki A, Schalin-Jantti C & Eriksson J (1992). M orning or bedtime NPH insulin combined w ith sulfonylurea in treatment of NIDDM . Diabetes Care, 15: 831-834.
17. Ravnik-Oblak M & M revlje F (1995). Insu-lin versus a combination of insuInsu-lin and
sulfonylurea in the treatment of NIDDM patients w ith secondary oral failure. Dia-betes Research and Clinical Practice, 30: 27-35.
18. Zimmet PZ, Tuomi T, M ackay IR, Row ley M J, Know les W, Cohen M & Lang DA (1994). Latent autoimmune diabetes mel-litus in adults (LADA): the role of antibod-ies to glutamic acid decarboxylase in diag-nosis and prediction of insulin dependen-cy. Diabetic M edicine,11: 299-303. 19. Reaven GM , Fraze E, Chen NY,
Hollen-beck C & Chen YD (1989). The combined use of insulin and sulfonylurea therapy in pat ient s w it h NIDDM . Horm one and M etabolic Research, 21: 132-136. 20. Tahara Y & Shima K (1995). Kinetics of
HbA1c, glycated albumin and fructos-amine and analysis of their w eight func-tions against predicting plasma glucose level. Diabetes Care, 18: 440-447. 21. Gutniak M , Karlander SG & Efendid S
(1987). Glyburide decreases insulin re-quirement, increases beta-cell response to mixed meal, and does not affect insulin sensitivity: effects of short and long-term combined treatment in secondary failure to sulfonylurea. Diabetes Care, 10: 545-554.
22. Soneru IL, Agraw al L, M urphy JC, Law rence AM & Abraira C (1993). Com-parison of morning or bedtime insulin w ith
and w ithout glyburide in secondary sulfo-nylurea failure. Diabetes Care, 16: 896-901.
23. Simonson DC, Delprato S, Castellino P, Groop L & DeFronzo RA (1987). Effect of glyburide on glycemic control, insulin re-quirement, and glucose metabolism in in-sulin-treated diabetic patients. Diabetes, 36: 136-146.
24. Shank M L, Del Prato S & DeFronzo RA (1995). Bedtime insulin/daytime glipizide. Effective therapy for sulfonylurea failures in NIDDM . Diabetes, 44: 165-172. 25. Pugh JA, Wagner M L, Saw yer J, Ramirez
G, Tuley M & Friedberg S (1992). Is com-bination sulfonylurea and insulin therapy useful in NIDDM patients? Diabetes Care, 15: 953-959.
26. M äkimattila S, Nikkilä K & Yki-Järvinen H (1999). Causes of w eight gain during in-sulin therapy w ith and w ithout metformin in patients w ith type II diabetes mellitus.
Diabetologia, 42: 406-412.
27. Lebovitz HE & Pasmantier R (1990). Com-bination insulin-sulfonylurea therapy. Dia-betes Care, 13: 667-675.