Countries: data from the Global Burden of Disease, 1990 to 2016
Bruno Ramos Nascimento,
1Luisa Campos Caldeira Brant,
1Gláucia Maria Moraes de Oliveira,
2Marcus Vinícius Bolívar
Malachias,
3Gabriel Moreira Alves Reis,
1Renato Azeredo Teixeira,
1Deborah Carvalho Malta,
1Elisabeth França,
1Maria
de Fátima Marinho Souza,
4Gregory A. Roth,
5Antonio Luiz P. Ribeiro
1Universidade Federal de Minas Gerais (UFMG),1 Belo Horizonte, MG – Brazil
Universidade Federal do Rio de Janeiro,2 Rio de Janeiro, RJ - Brazil
Faculdade Ciências Médicas de Minas Gerais,3 Belo Horizonte, MG - Brazil
Ministério da Saúde, Brasília,4 DF - Brazil
University of Washington,5 Seattle, WA - USA
Mailing Address: Gláucia Maria Moraes de Oliveira •
Universidade Federal do Rio de Janeiro – R. Prof. Rodolpho P. Rocco, 255 – Prédio do HU 8º andar – sala 6, UFRJ. Postal Code 21941-913, Cidade Universitária, RJ – Brazil
E-mail: glauciam@cardiol.br, glauciamoraesoliveira@gmail.com Manuscript received December 08, 2017, revised manuscript March 21, 2018, accepted March 21, 2018
DOI: 10.5935/abc.20180098
Abstract
Background: Portuguese-speaking countries (PSC) share the influence of the Portuguese culture but have socioeconomic development patterns that differ from that of Portugal.
Objective: To describe trends in cardiovascular disease (CVD) morbidity and mortality in the PSC between 1990 and 2016, stratified by sex, and their association with the respective sociodemographic indexes (SDI).
Methods: This study used the Global Burden of Disease (GBD) 2016 data and methodology. Data collection followed international standards for death certification, through information systems on vital statistics and mortality surveillance, surveys, and hospital registries. Techniques were used to standardize causes of death by the direct method, as were corrections for underreporting of deaths and garbage codes. To determine the number of deaths due to each cause, the CODEm (Cause of Death Ensemble Model) algorithm was applied. Disability-adjusted life years (DALYs) and SDI (income per capita, educational attainment and total fertility rate) were estimated for each country. A p-value < 0.05 was considered significant.
Results: There are large differences, mainly related to socioeconomic conditions, in the relative impact of CVD burden in PSC. Among CVD, ischemic heart disease was the leading cause of death in all PSC in 2016, except for Mozambique and Sao Tome and Principe, where cerebrovascular diseases have supplanted it. The most relevant attributable risk factors for CVD among all PSC are hypertension and dietary factors.
Conclusion: Collaboration among PSC may allow successful experiences in combating CVD to be shared between those countries. (Arq Bras Cardiol. 2018; 110(6):500-511)
Keywords: Cardiovascular Diseases; Epidemiology; Mortality; Global Burden of Disease / trends.
Introduction
Cardiovascular diseases (CVD) are a major cause of death worldwide. Although CVD are not the first cause of death in many low- and middle-income countries, they account for 80% of the deaths and 88% of the premature deaths in
those countries.1 The control of infectious, maternal and child
diseases, the increase in life expectancy and the growing urbanization have contributed to the trend towards increasing the importance of CVD in low- and middle-income countries. The implementation of health policies, such as promotion of a
healthy lifestyle, access to primary and secondary prevention of CVD and treatment of acute cardiovascular events, is, thus,
essential for CVD control in all countries.1
Portuguese-speaking countries (PSC) were culturally
influenced by Portugal at different levels.2 The study of the
trends in morbidity and mortality from CVD in those countries can provide us useful data regarding the similarities and differences between them. Those data can provide an exchange of information between countries regarding well-succeeded actions for fighting CVD, in addition to allowing reflections on the influence of culture on the burden of CVD.
The “Global Burden of Disease Study” (GBD Study) is an important epidemiological observational study that uses metrics of morbidity and mortality related to major diseases, injuries and risk factors at global, at national and regional levels. One of the GBD Study objectives is to understand, by assessing the trends, the changes in the profile of the diseases
that affect the 21st century populations.3
2016, based on the estimates of the GBD 2016 Study, and to assess the association between those trends and the sociodemographic index (SDI) of those countries.
Methods
Portuguese-speaking countries
The PSC are the official members of the Community of Portuguese-Speaking Countries (CPLP), an international organization created in July 17, 1996, aimed at "deepening
the mutual friendship and cooperation between its members".2
The initial list of countries included Angola, Brazil, Cape Verde, Guinea-Bissau, Mozambique, Portugal and Sao Tome and Principe. In 2002, after its independence, Timor-Leste was accepted as a member. In 2014, Equatorial Guinea was accepted as a member, after Portuguese was adopted as the official language of the country. Table 1 and Figure 1 show the location and the demographic, social and economic characteristics of the PSC.
The GBD Study
The GBD Study is a multinational collaborative research project with the goal of producing consistent estimates of health loss due to over 333 diseases and injuries. A wide range of data sources (data of national surveillance, verbal autopsy and vital registration, published and unpublished registries of diseases, and published scientific literature) and methods are applyed to produce specific results with uncertainty intervals for age, sex and country for the years 1990-2016, and such results are annually updated for the entire temporal series. The present study is based on data from the GBD 2016 Study
and its previously detailed methodology.4-6
Definitions of CVD
The nine most common global causes of death and morbidity related to CVD and an additional category for ‘other CVD’ were considered, in addition to the estimates
of global morbidity and mortality grouped by CVD.7
The underlying cause of death was defined as CVD according to the International Classification of Diseases (ICD) codes, from the death certificate (DC), the basic document that informs the causes of death in countries with systems of vital statistics, such as Brazil. The following causes were analyzed, with their corresponding ICD-10 codes according to the GBD Study’s classification list of causes: 1- rheumatic fever with cardiac involvement (codes I01-I01.9, I02.0, I05-I09.9); 2-ischemic heart disease (codes I20-I25.9); 3- cerebrovascular disease (CbVD) (G45-G46.8, I60-I69.9); 4- hypertensive heart disease (I11); 5- cardiomyopathy and myocarditis (A39.52, B33.2-B33.24, D86.85, I40-I43.9, I51.4-I51.5); 6- atrial fibrillation and flutter (I48); 7- aortic aneurysm (I71); 8- peripheral artery disease (I70.2-I70.7, I73-I73.9); 9-endocarditis (A39.51, I33-I33.9, I38-I39.9). Garbage codes, such as heart failure (I50) and pulmonary embolism (I26), which do not define the pathology that caused the death, were redistributed to those specific causes based on the GBD methodology, according to algorithms defined in that study.
Regarding mortality, those causes were grouped based on the specific sequelae of disease (for example, ischemic heart disease due to acute coronary syndrome, chronic stable angina, chronic ischemic heart disease and ischemic cardiomyopathy). Adjustments were performed for data that did not comply with the specific definition of case (for example, electronic confirmation for the
clinical diagnosis).4,8,9
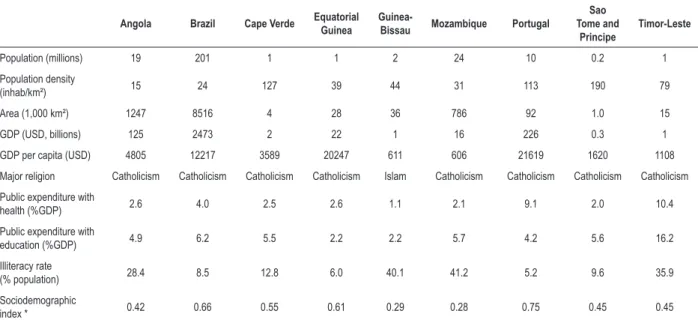
Table 1 – Demographic, social and economic characteristics of the Portuguese-speaking countries, 2013
Angola Brazil Cape Verde Equatorial Guinea Guinea-Bissau Mozambique Portugal
Sao Tome and
Principe
Timor-Leste
Population (millions) 19 201 1 1 2 24 10 0.2 1
Population density
(inhab/km²) 15 24 127 39 44 31 113 190 79
Area (1,000 km²) 1247 8516 4 28 36 786 92 1.0 15
GDP (USD, billions) 125 2473 2 22 1 16 226 0.3 1
GDP per capita (USD) 4805 12217 3589 20247 611 606 21619 1620 1108
Major religion Catholicism Catholicism Catholicism Catholicism Islam Catholicism Catholicism Catholicism Catholicism
Public expenditure with
health (%GDP) 2.6 4.0 2.5 2.6 1.1 2.1 9.1 2.0 10.4
Public expenditure with
education (%GDP) 4.9 6.2 5.5 2.2 2.2 5.7 4.2 5.6 16.2
Illiteracy rate
(% population) 28.4 8.5 12.8 6.0 40.1 41.2 5.2 9.6 35.9
Sociodemographic
index * 0.42 0.66 0.55 0.61 0.29 0.28 0.75 0.45 0.45
Statistical analysis
The statistical models of the GBD 2016 Study previously
reported were used.4-6 The source of data for the models are
available on-line at Global Health Data Exchange (http://ghdx. healthdata.org/).
Metrics of mortality and prevalence
The GBD 2016 Study used data available on causes of death in 195 countries. The information was collected according to international standards of death certification, using of information systems on vital statistics, mortality surveillance systems, survey, hospital registries and police
registries.4 The data sources have regional particularities,
such as in Brazil, where data were mainly obtained from the Mortality Information System (SIM) of the Brazilian Health
Ministry, by using an automated coding system.10 In Brazil,
all deaths require a medical DC provided by the attending physician. For the deaths occurring outside a healthcare facility, the causes are verified by the Death Verification Service, or by a civil agent when a physician is not available, and, in such
cases, the causes of death are not registered.11 Deaths due to
external causes are identified by a medical examiner at the Forensic Pathologist Service.
In addition, techniques to correct quality problems regarding the information about the causes of death were
used.9 Corrections were made for underreporting of deaths
and for causes considered not useful for the public health analysis, known as Garbage Codes. That term is used to describe causes that cannot or should not be considered as underlying causes of death, or that are unspecified within larger groups of causes. Algorithms of redistribution of Garbage Codes were developed by the GBD Study to
increase the validity of the estimates. For this redistribution into specific causes of death, evidence from several sources, such as medical literature, expert opinion and statistical
techniques, was considered.4,8,12
After treatment of data quality, the GBD 2016 Study used a variety of statistical models to determine the number of deaths per each cause, mainly by use of the Cause of Death Ensemble Model (CODEm) algorithm. To ensure that the number of deaths per cause does not exceed the total estimated number of deaths, a correction technique (CoCorrect) was used. Adjustment by this technique ensures that the sum of the estimated number of deaths per each cause does not exceed
100% of the estimated deaths in a certain year.13
The disease prevalence was estimated at a more detailed level of specific sequelae of disease, using as entry data the published systematic reviews of the scientific literature, as well as unpublished data of administrative registries and databases of the health system. Regression equations were used for data adjustment to define the standard case. The data presented were analyzed for the period from 1990 to 2016, and all analyses were stratified by sex and presented as absolute and age-standardized estimates, for the different PSC.
Metrics of burden of disease
The disability-adjusted life years (DALYs) combine information regarding premature death (years of life lost: YLLs) and disability caused by the condition (years lived with disability: YLDs) to provide a brief measure of the healthy years lost due to the condition. The YLLs were calculated by multiplying the deaths observed at each specific age in one year of interest by the reference age-specific life expectancy estimated by use of life table methods.
Figure 1 – Global map showing the location of the Portuguese-speaking countries, 2017.
Brazil Cape Verde Portugal
Guinea-Bissau Equatorial Guinea Sao Tome & Principe
The YLDs were calculated by multiplying disease prevalence (in number of cases/year) by a health-state-specific disability weight representing a degree of lost functional capacity. The process of estimating the burden of the disability has
been previously described in details.6 Briefly, the burdens
of disability were determined via home interviews in several countries, in which the participants were asked to choose
between lay descriptions of different health states.14,15
Adjustment for comorbidity was performed, simulating 40,000 individuals in each age-sex-country-year stratum exposed to the independent likelihood of developing each condition, based on the disease prevalence, with 95% uncertainty intervals (95% UI) reported for each estimate. Age-standardization was obtained via the direct method, applying a global age structure.
Sociodemographic index
The SDI is used as an estimate of the socioeconomic level of each country to assess its association with the CVD burden,
as a function of global epidemiological transition.4,8 Similarly to
the method used to calculate the Human Development Index, the SDI was calculated for each country or territory from 1990 to 2016. The SDI is the weighted geometric mean of income per capita, educational attainment and total fertility rate, and allows the comparison of the performance of each country to those of countries with a similar socioeconomic level.
The SPSS software, version 22.0 for Mac OSX (SPSS Inc.,
Chicago, Illinois), was used to perform the correlation (Spearman
correlation) between the country’s SDI and the variation of the age-standardized mortality rates from CVD between 1990 and 2016. A p-value < 0.05 was considered statistically significant.
Ethical considerations
This study was conducted in a public secondary database, without nominal identification, according to Decree 7.724, of May 16, 2012, and the Resolution 510, of April 7, 2016. The Brazilian GBD 2015 Study was approved by the Committee in Ethics and Research of the Minas Gerais Federal University (Project CAAE 62803316.7.0000.5149).
Results
Causes of mortality from CVD
The importance of CVD as the cause of death has increased in the PSC. In 1990, CVD were the main cause of death only in Brazil and Portugal, while, in the other countries, infectious diseases, such as diarrhea and respiratory infections, were the leading causes. In 2016, however, CVD became the leading cause of death in Cape Verde, Sao Tome and Principe and Timor-Leste, and ranked higher or maintained their ranks in the other countries (Figure 2A). Considering the causes of CVD, there was an increase in the proportional mortality from ischemic heart disease, which, in 2016, was the first cause of death in most countries studied, except for Mozambique and Sao Tome and Principe. In general, there was a reduction in proportional mortality from rheumatic heart disease (Figure 2B).
Trends in the mortality rates from CVD between 1990 and 2016
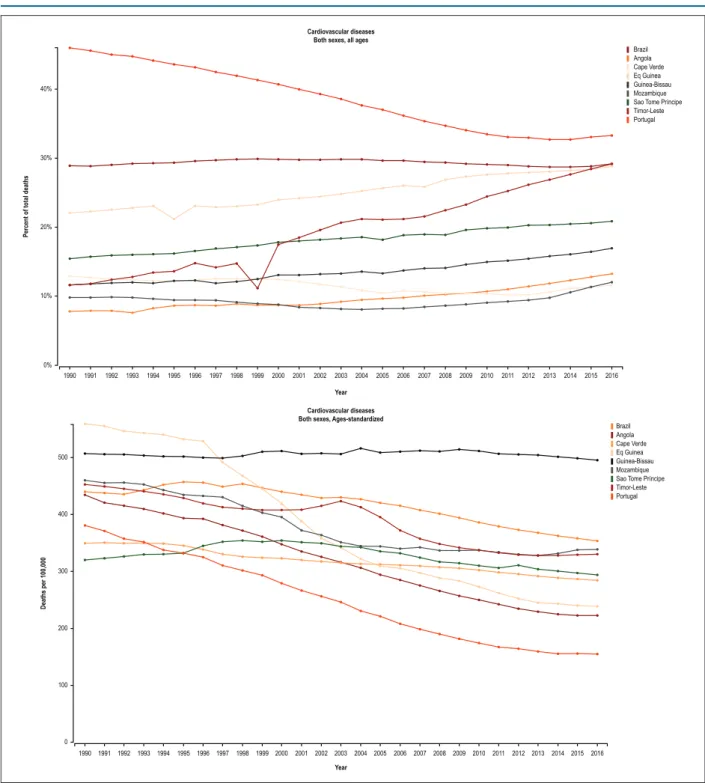
Figure 3 shows an important reduction in proportional mortality from CVD and in the age-standardized mortality rate from CVD in Portugal, revealing that the decline in mortality occurred at all age groups. In Brazil and in Equatorial Guinea, the proportion of deaths from CVD remained stable, while a consistent reduction was observed over the past 15 years in the age-standardized mortality rate, suggesting there was mainly a reduction in premature mortality from CVD. In the other countries, the proportion of deaths due to CVD increased, and the reduction in age-standardized mortality rate from CVD declined less expressively, suggesting an increasing impact of CVD in those countries.
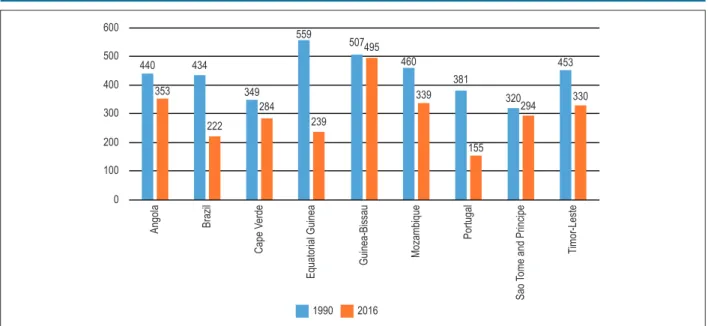
Although the proportional mortality from CVD decreased in the PSC from 1990 to 2016, the decline was heterogeneous among the countries. Figure 4 shows the age-standardized mortality rates for each PSC in 1990 and 2016.
Figure 5 reveals the positive correlation between the reduction in age-standardized mortality rates from CVD between 1990 and 2016 and the SDI of the country
(rs = 0.7; p = 0.04), suggesting a reduction in mortality from
CVD follows the improvement in the local socioeconomic conditions of the PSC.
Lost of healthy life years (DALY) due to CVD
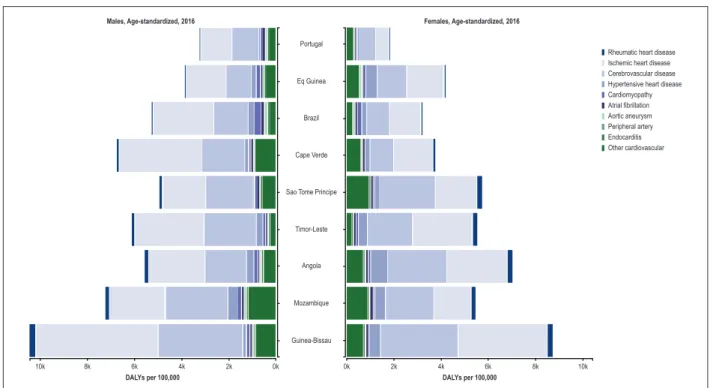
The trend in DALYs between 1990 and 2015 (Supplementary Figure 1) in the PSC is similar to that reported for the age-standardized mortality rate: there was a heterogeneous reduction in all countries, more expressive in those with better SDI. Regarding the specific causes of CVD, Figure 6 shows the importance of ischemic heart disease and CbVD in all countries, for both sexes. The loss of healthy life years was greater for men in all countries, except for Equatorial Guinea, Sao Tome and Principe and Angola, being mainly due to the other heart diseases. The importance of rheumatic heart disease, which is strictly related to socioeconomic conditions, for the loss of healthy years is evident in the countries with the lowest SDI.
Influence of the risk factors on CVD
Figure 7 reveals the risk factors attributed to the YLLs in each PSC. In general, of the classical risk factors and their determinants, arterial hypertension and dietary factors are the most important. The relevance of obesity is greater among women, being less important in Timor-Leste, despite the importance of metabolic risk factors in that country. The metabolic risk factors (high cholesterol, high blood sugar) have higher influence on the premature mortality from CVD in the countries with higher SDI (Portugal, Brazil and Equatorial Guinea). The relevance of the smoking habit is evenly greater for men, but heterogeneous among the countries. In addition, environmental risk factors, such as air pollution, are heterogeneous among the countries.
Figure 2 – Most common causes of death, considering age-standardized mortality, in the Portuguese-speaking countries in 1990 and 2016. A: All causes; B: From cardiovascular diseases. LRI = lower respiratory tract infection; NTD = neglected tropical diseases.
Diarrhea/LRI/other HIV/AIDS & tuberculosis Cardiovascular diseases Neonatal disorders Nutritional deficiencies NTDs & malária Unintentional inj Neoplasms Other group I Transport injuries War & disaster Digestive diseases Other non-communicable Chronic respiratory Diabetes/urog/blood/endo Cirrhosis Maternal disorders Self-harm & violence Neurological disorders Mental & substance use Musculoskeletal disorders
Diarrhea/LRI/other
HIV/AIDS & tuberculosis Cardiovascular diseases
Neonatal disorders
Nutritional deficiencies NTDs & malária Unintentional inj Neoplasms
Other group I Transport injuries
War & disaster Digestive diseases Other non-communicable Chronic respiratory Diabetes/urog/blood/endo Cirrhosis Maternal disorders Self-harm & violence Neurological disorders
Mental & substance use Musculoskeletal disorders
Brazil Cape Verde Eq Guinea Guinea-Bissau Mozambique Sao Tome Príncipe
Angola Portugal Timor-Leste
Brazil Cape Verde Eq Guinea Guinea-Bissau Mozambique Sao Tome Príncipe
Angola Portugal Timor-Leste
Both sexes, all ages, 1990, Percent of total deaths
Both sexes, all ages, 2016, Percent of total deaths
1
1
1 1 1 1
1
1 1
17
17 17 17
17 17 17 15 15 15 15 15 15 15 16 16 16 16 16 16 16
21 21 21
21 21 21 21 14 14 14 14 14 14 14 18
18 18 18
18
18
18
19 19 19
19
19
19
19
20 20 20
20 20 20 20 2 2 6 6 6 6 6 6 6 2 2 2 2 2 2 2 4 4 4 4 4 4 4 10 10 10 10 10 10 10 8 8 8 8 8 8 8 3 3 3 3 3 3 3 7 7 7 7 7 7 7 5 5 5 5 5 5 5 9 9 9 9 9 9 9 13 13 13 13 13 13 13 11 11 11
11 11 11
11 12 12 12 12 12 12 12 4 9 3 7 13 10 8 6 12 5 11 14 15 16 18 21 19 17 20 3 4 5 6 7 8 9 10 11 12 13 14 15 16 17 18 19 20 21 1 1 1 1 1 1 1 2 2 2 2 2 2 2 3 3 3 3 3 3 3 4 4 4 4 4 4 4 5 5 5 5 5 5 5 6 6 6 6 6 6 6 7 7 7 7 7 7 7 8 8 8 8 8 8 8 9 9 9 9 9 9 9 10 10 10 10 10 10 10 11 11 11 11 11 11 11 12 12 12 12 12 12 12 13 13 13 13 13 13 13 14 14 14 14 14 14 14 15 15 15 15 15 15 15 16 16 16 16 16 16 16 17 17 17 17 17 17 17 18 18 18 18 18 18 18 19 19 19 19 19 19 19 20 20 20 20 20 20 20 21 1 2 3 4 5 6 7 8 9 10 11 12 13 14 15 16 17 18 19 19 20 21 1 2 3 4 5 6 7 8 9 10 11 12 13 14 15 16 17 18 20 21 21 21 21 21 21 21
Brazil Cape Verde Eq Guinea Guinea-Bissau Mozambique Sao Tome Príncipe
Angola Portugal Timor-Leste
Both sexes, all ages, 1990, percent of total deaths
Brazil Cape Verde Eq Guinea Guinea-Bissau Mozambique Sao Tome Príncipe
Angola Portugal Timor-Leste
Both sexes, all ages, 2016, percent of total deaths
Cerebrovascular disease
Cerebrovascular disease Ischemic heart disease
Ischemic heart disease Hypertensive heart disease
Hypertensive heart disease Other cardiovascular diseases
Other cardiovascular diseases Rheumatic heart disease
Rheumatic heart disease Cardiomyopathy Cardiomyopathy Aortic aneurysm Aortic aneurysm Endocarditis Endocarditis Atrial fibrillation Atrial fibrillation Peripheral artery Peripheral artery 1 1 1 1
1 1 1
1 1 1 1 1 1 1 1 1 2 3 4 4 4 4
4 4 4
4
5 5 5
5 5 5 5 5 6 6
6 6 6 6 6 6
7 7 7 7 7 7 7 7 8 8 8 8 8 8 8 8 9 9
9 9 9
9 9 9
10
1
2 2 2 2 2
2
2
2
2
3 3
3 3 3 3 3 3
3
4 4
4 4 4 4 4
4
4
5 5 5
5 5 5 5 5 5 6 6 6 6 6 6
6 6 6
7
7
7 7 7 7
7 7 7 8 8 8 8
8 8 8
8
8 9
9
9
9 9 9
9
9 9
10 10 10 10 10 10
10
10 10
2 2
2
2
2 2 2
2
1
3
3
3
3 3 3 3
3 5 7 4 6 9 8
10 10 10 10 10 10 10
10
Discussion
Portuguese is the sixth most spoken language worldwide, by
244 million speakers,16 the fifth most commonly used language
over the Internet, by 82.5 million cybernauts, and the third
most commonly used language in the social media Facebook
and Twitter, by 58.5 million people.17 According to estimates
of the Portuguese government, considering the demographic evolution, by 2050, the number of Portuguese speakers will increase to 335 million. Africa should exceed Brazil in the use
of Portuguese within 50 years.16
Portuguese is the official language of eight countries (Portugal, Brazil, Angola, Mozambique, Guinea-Bissau, Cape Verde, Sao Tome and Principe, and Timor-Leste). Despite the incorporation of native words and the
grammatical and pronunciation changes characteristic of each country, their languages remain united to the Portuguese from Portugal, from which the PSC were colonies during the expansion of that nation. Independence from the Portuguese domination occurred at different points in time: Equatorial Guinea belonged to the Portuguese Empire only until 1778, being then given to Spain, while Brazil was a Portuguese colony until 1822. The other nations had their independence recognized by Portugal between 1973 and 1975. However, the cultural influence of Portugal on those countries has been striking, an example being Catholicism, the official religion in most of those countries, the predominance of the Portuguese surnames, in addition to the organization of the healthcare
Figure 3 – Mortality attributed to cardiovascular diseases in the Portuguese-speaking countries from 1990 to 2016. A. Proportional mortality from cardiovascular diseases (%), B. Age-standardized mortality rate from cardiovascular diseases (deaths/100,000).
40%
30%
20%
10%
0%
Percent of total deaths
Year
1990 1991 1992 1993 1994 1995 1996 1997 1998 1999 2000 2001 2002 2003 2004 2005 2006 2007 2008 2009 2010 2011 2012 2013 2014 2015 2016 Cardiovascular diseases
Both sexes, all ages
Brazil Angola Cape Verde Eq Guinea Guinea-Bissau Mozambique Sao Tome Príncipe Timor-Leste Portugal
Brazil Angola Cape Verde Eq Guinea Guinea-Bissau Mozambique Sao Tome Príncipe Timor-Leste Portugal Cardiovascular diseases
Both sexes, Ages-standardized
400 500
300
200
100
0
Deaths per 100,000
Year
1990 1991 1992 1993 1994 1995 1996 1997 1998 1999 2000 2001 2002 2003 2004 2005 2006 2007 2008 2009 2010 2011 2012 2013 2014 2015 2016
Despite their cultural identity, the socioeconomic development was heterogeneous among the PSC. In 2015, the SDI was as low as 0.28 and 0.29 in Guinea-Bissau and Mozambique, respectively, although, in Brazil (0.66) and Equatorial Guinea (0.61), the SDI was closer to that of Portugal (0.75). The same occurred with the Gross Domestic Product per capita (GDP per capita), quantified in United States dollars in that same year, ranging from 606 to 611
in Guinea-Bissau and Mozambique, and from 20,247 to 21,619 in Equatorial Guinea and Portugal, respectively. The percentages of public expenditures on health differed, representing, in 2013, 2% to 3% of the GDP of most PSC, except for Portugal and Timor-Leste, whose percentages were higher, ranging from 9.1% to 10.4%, respectively, while Brazil was at an intermediate level, currently at 4%
Figure 5 – Correlation between the change in mortality from cardiovascular diseases between 1990 and 2016 and the sociodemographic index (rs = 0.7; p = 0.04).
60
50
40
30
20
10
0
,20 ,30 ,40 ,50 ,60 ,70 ,80
Sociodemographic index
Change in mortality (%)
Country
Angola Brazil Cape Verde Guinea-Bissau Equatorial Guinea Mozambique Portugal
Timor-Leste Sao Tome Principe Figure 4 – Age-standardized mortality rate in the Portuguese-speaking countries in 1990 and 2016.
600
500
400
300
200
100
0
Angola Brazil
Cape V
erde
Equatorial Guinea
Guinea-Bissau Mozambique
Sao
Tome and Principe
Portugal
T
imor-Leste
1990 2016
440
353 434
222 349
284 559
239
507495 460
339 381
155 320
294 453
330
An important result of this study was to show that in all the PSC, except for Guinea-Bissau, reductions in age-standardized mortality rates from CVD were observed from 1990 to 2016. From a global perspective, the period was marked by a reduction in age-standardized mortality from CVD in all high-income and some middle-income countries, although
little change could be observed in most Sub-Saharan countries.7
In the PSC, a strong positive correlation was observed between the SDI and the reduction in the age-standardized mortality rates from CVD in the past 27 years. However, that pattern
was not homogeneous, suggesting that other factors19 could be
Figure 6 – Disability-adjusted life years (DALYs) for each cardiovascular disease for each Portuguese-speaking country, 2016.
Males, Age-standardized, 2016 Females, Age-standardized, 2016
Portugal
Eq Guinea
Brazil
Cape Verde
Sao Tome Principe
Timor-Leste
Angola
Mozambique
Guinea-Bissau
10k 8k 6k 4k 2k 0k 0k 2k 4k 6k 8k 10k
DALYs per 100,000 DALYs per 100,000
Rheumatic heart disease Ischemic heart disease
Hypertensive heart disease Cardiomyopathy Atrial fibrillation Aortic aneurysm Peripheral artery Endocarditis Other cardiovascular Cerebrovascular disease
Figure 7 – Influence of the risk factors on the years of life lost (YLLs) because of cardiovascular diseases, according to sex, in each Portuguese-speaking country in 2016.
Males, Age-standardized, 2016 Females, Age-standardized, 2016
Portugal
Eq Guinea Brazil
Cape Verde Sao Tome Principe
Timor-Leste Angola Mozambique
Guinea-Bissau
250% 200% 150% 100% 50% 0%
Percent of total YLLs
250% 200% 150% 100% 50% 0%
Percent of total YLLs
Air pollution Other environmental
Tobacco Alcohol & drug use Atrial fibrillation Dietary risks High fasting plasma glucose High total cholesterol High blood pressure High body-mass index Low bone mineral density Impaired kidney function Occupational risks
In Brazil and Portugal, that correlation was closer. The decline in age-standardized mortality rates in Brazil, associated with the increase in life expectancy, and the maintenance of a proportional mortality around 30%, from 1990 to 2016, point towards a greater relevance of
the reduction in the premature mortality component.20
The improvement in social inequality observed in Brazil and in some PSC might have contributed to that heterogeneous reduction in mortality as compared to the
It is worth noting that, of the total number of deaths occurring in the Sub-Saharan Africa in 2015, ischemic heart disease was the fifth cause of death, preceded by the infectious causes in both sexes, while hemorrhagic stroke was the
seventh, diabetes mellitus, the eighth, and ischemic stroke,
the fifteenth cause of death in both sexes.18 In 2016, however,
CVD were the first cause of death in almost all PSC, except for Guinea-Bissau, where CVD were the second cause of death, and Mozambique and Equatorial Guinea, where CVD were the third cause of death in both sexes. Ischemic heart diseases predominated in all PSC, except for Mozambique and Sao Tome and Principe, a different pattern from that observed
in the other Sub-Saharan countries,18 suggesting a similarity
between the PSC.
The DALYs were reduced in the PSC over the temporal series, from 1990 to 2016, probably reflecting an improvement
in the health care provided to those populations.22 The DALYs
were mainly due to ischemic heart disease and CbVD in those PSC. That reduction was greater in the countries with the highest SDI. However, in an analysis of the GBD Study from 1990 to 2013, the SDI did not explain the reduction in the DALYs due to CVD, mainly because of the heterogeneity of
the set of countries considered.22
The systolic and diastolic blood pressure levels decreased
from 1995 to 2015 in most high-income countries.23
That effect was not observed in most Sub-Saharan countries,23
and that could explain the predominance of the CbVD as the most important component of the mortality from CVD in Sub-Saharan countries, with the contribution of the increase
in body mass and dietary factors.24 The same has occurred in
the PSC, where arterial hypertension and dietary factors had a more relevant influence in both sexes for the DALYs due to CVD. It is worth noting the importance of the dietary risk factors in most PSC under the influence of the global dietary pattern, with ultra-processed foods and excessive amounts of sugars and fats, modifying healthier traditional dietary patterns. Those risk factors can be modified by promoting policies that favor healthy dietary habits, the taxation of ultra-processed foods, and the subsidies to healthy food, such as fruits
and vegetables.25,26
The African populations are characterized by a great genetic diversity, representing the repository of genetic material of modern humans, who spread around the world over the past 100,000 years, having genetic adaptations in response to different climates, diets, geographic environments
and infectious agents to which they have been exposed.27
The genetic variations of Sub-Saharan Africa have been
modelled by geographical and ethnolinguistic similarities.28
In addition, in the European populations, linguistic similarities have shown to be better predictors of genome differences as
compared to geographic differences.29 The complex genetic
interactions with the environmental and sociodemographic factors will be able to help us understand the heterogeneous
occurrence of CVD.30
Although the quality of the completeness of the data collected and estimates has varied between the different PSC,
there was an improvement in the recent years of the temporal
series,4 indicating the importance of the investment in national
systems of vital registration and verbal autopsy to understand the burden of CVD in those countries.
Limitations and strengths
The limitations of the analytical models of the GBD Study
have been previously discussed in detail.4-6,8 Despite the
improvement in the completeness of the data on prevalence and morbidity in some PSC, the estimates of the GBD 2016 Study indicate that the integrity and quality of those data are heterogeneous. For example, in Brazil and Portugal, the coverage of the data on death exceeds 95%, in contrast to very low or even absent indices in PSC of Sub-Saharan
Africa.4,8 The GBD Study models may have been inadequate
for the different countries in some groups of diseases, mainly the non-communicable ones and those under less strict epidemiological surveillance, such as the classification of Latin America as a non-endemic region for rheumatic heart disease,
which differs from primary data of prevalence.31,32
In addition, the sociocultural, demographic, economic and ethnic differences and particularities between the PSC are not captured by the GBD Study models. Such differences are frequently associated with life habits, health behaviors and risk factors that affect the global burden of CVD. Moreover, despite having the same colonization and cultural similarities, the historical factors and development pattern of the societies differ
significantly between the PSC.2
Despite those limitations, from the epidemiological point of view, the GBD Study is the most solid and comprehensive initiative to estimate the burden of CVD, being especially useful to enable standardized comparisons between countries, including the PSC, whose primary data are still scarce. Those limitations do not invalidate the importance of this study for the epidemiological evaluation of CVD in the PSC, aiming at the elaboration of educational, preventive and therapeutic strategies more adequate for each country’s reality, considering their sociodemographic, economic and cultural differences.
Conclusion
The data presented show great differences in the relative importance of the burden of CVD in the PSC and indicate that such differences relate to the socioeconomic conditions of the countries. Of the CVD, ischemic heart disease is the major cause of death in all PSC, except for Mozambique and Sao Tome and Principe, where CbVD is the major cause. The PSC share the most relevant risk factors for CVD: hypertension and dietary factors. Genetic factors, implicit in the cultural identity, factors inherent in the host, as well as the huge social inequality might have contributed to explain the mortality rates observed. Collaboration between the PSC might allow sharing successful experiences to confront CVD between those countries.
Author contributions
Conception and design of the research: Oliveira GMM, Malachias, MVB, Ribeiro AL; Acquisition of data: Reis GMA, Ribeiro AL, Brant LCC, Souza MFM, Malta DC, Teixeira RA; Roth GA; Analysis and interpretation of data: Brant LCC, Reis GMA, Ribeiro AL, Nascimento BR; Statistical analysis: Teixeira RA, Brant LCC, Ribeiro, AL, Roth GA; Obtaining financing: Souza MFM, França E; Writing of the manuscript: Nascimento, BR, Brant, LCC, Oliveira GMM; Critical revision of the manuscript for intellectual content: Todos os autores.
Potential Conflict of Interest
No potential conflict of interest relevant to this article was reported.
Sources of Funding
The Ministry of Health of Brazil was responsible for funding the GBD Brazil Study (Fundo Nacional de Saúde, grant number (17217.9850001 /17-018). Ribeiro was supported in part by CNPq (Bolsa de produtividade em pesquisa, 310679/2016-8 and IATS, 465518/2014-1) and by FAPEMIG (Programa Pesquisador Mineiro, PPM-00428-17).
Study Association
This study is not associated with any thesis or dissertation work.
Ethics approval and consent to participate
This study was approved by the Ethics Committee of the Universidade Federal de Minas Gerais under the protocol number 62803316.7.0000.5149. All the procedures in this study were in accordance with the 1975 Helsinki Declaration, updated in 2013. Informed consent was obtained from all participants included in the study.
1. World Health Organization. (WHO). Global action plan for the prevention and control of noncommunicable diseases 2013-2020. Geneva (Switzerland); 2013.
2. Comunidade dos Países de Língua Portuguesa - 2017 (CPLP). [Acesso em 2017 nov 110. Disponível em: https://www.cplp.org/
3. Institute for Health Netrics and Evaluation. Global Burden of Disease (GBD). Seattle (WA): University of Washington; 2017.
4. Naghavi M, Abajobir AA, Abaffati C. GBD Global, regional, and national age-sex specific mortality for 264 causes of death, 1980-2016: a systematic analysis for the Global Burden of Disease Study 2016. Lancet. 2017;390(10100):1151-210.
5. GBD 2016 Disease and Injury Incidence and Prevalence Collaborators. Global, regional, and national incidence, prevalence, and years lived with disability for 328 diseases and injuries for 195 countries, 1990-2016: a systematic analysis for the Global Burden of Disease Study 2016. Lancet. 2017;390(10100):1211-59.
6. GBD DALYs and HALE Collaborators. Global, regional, and national disability-adjusted life-years (DALYs) for 333 diseases and injuries and healthy life expectancy (HALE) for 195 countries and territories, 1990-2016: a systematic analysis for the Global Burden of Disease Study 2016. Lancet. 2017;390(10100):1260-344.
7. Roth GA, Johnson C, Abajobir A, Abd-Allah F, Abera SF, Abyu G, et al. Global, regional, and national burden of cardiovascular diseases for 10 causes, 1990 to 2015. J Am Coll Cardiol. 2017;70(1):1-25.
8. GBD Mortality Collaborators. Global, regional, and national under-5 mortality, adult mortality, age-specific mortality, and life expectancy, 1970-2016: a systematic analysis for the Global Burden of Disease Study 2016. Lancet. 2017;390(10100):1084-150.
9. Murray CJ, Lopez AD. Measuring the global burden of disease. N Engl J Med. 2013;369(5):448-57.
10. França EB, Passos VM, Malta DC, Duncan BB, Ribeiro AL, Guimarães MD, et al. Cause-specific mortality for 249 causes in Brazil and states during 1990-2015: a systematic analysis for the global burden of disease study 2015. Popul Health Metr. 2017;15(1):39.
11. Franca E, de Abreu DX, Rao C, Lopez AD. Evaluation of cause-of-death statistics for Brazil, 2002-2004. Int J Epidemiol. 2008;37(4):891-901.
12. Foreman KJ, Naghavi M, Ezzati M. Improving the usefulness of US mortality data: new methods for reclassification of underlying cause of death. Popul Health Metr. 2016 Apr 28;14:14.
13. GBD 2015 Mortality and Causes of Death Collaborators. Global, regional, and national life expectancy, all-cause mortality, and cause-specific mortality for 249 causes of death, 1980-2015: a systematic analysis for the Global Burden of Disease Study 2015. Lancet. 2016;388(10053):1459-544.
14. Salomon JA, Haagsma JA, Davis A, de Noordhout CM, Prolinder S, Havelaar AH, et al. Disability weights for the Global Burden of Disease 2013 study. Lancet Glob Health. 2015;3(11):e712-23.
15. Haagsma JA, Maertens de Noordhout C, Polinder S, Vos T, Havelaar AH, Cassini A, et al. Assessing disability weights based on the responses of 30,660 people from four European countries. Popul Health Metr. 2015 Apr 3;13:10.
16. Camões - Instituto da Cooperação e da Lígua. Ministério dos Negócios Estrangeiros; 2017. [Acesso em 2017 nov 22]. Disponível em: http://www. instituto-camoes.pt/
17. Internet World Stats. Usage and Population Statistics. Miniwatts Marketing Group; 2017. [Accessed in 2017 Nov 22]. Available from: http://www. internetworldstats.com/stats.htm/
18. Agyepong IA, Sewankambo N, Binagwaho A, Coll-Seck AM, Corrah T, Ezeh A, et al. The path to longer and healthier lives for all Africans by 2030: the Lancet Commission on the future of health in sub-Saharan Africa. Lancet. 2018;390(10114):2803-59.
This is an open-access article distributed under the terms of the Creative Commons Attribution License
19. Wilkinson RG, Pickett K. Por que uma sociedade mais igualitária é melhor para todos. Rio de Janeiro: Editora Civilização Brasileira; 2015.
20. Ribeiro AL, Duncan BB, Brant LC, Lotufo PA, Mill JG, Barreto SM. Cardiovascular health in Brazil: trends and perspectives. Circulation. 2016;133(4):422-33.
21. Marmot M. Brazil: rapid progress and the challenge of inequality. Int J Equity Health. 2016;15(1):177.
22. GBD Healthcare Access Quality Collaborators. Healthcare Access and Quality Index based on mortality from causes amenable to personal health care in 195 countries and territories, 1990-2015: a novel analysis from the Global Burden of Disease Study 2015. Lancet. 2017;390(10110):231-66.
23. Feigin VL, Roth GA, Naghavi M, Parmar P, Krishnamurthi R, Chugh S, et al; Global Burden of Diseases, Injuries and Risk Factors Study 2013 and Stroke Experts Writing Group. Global burden of stroke and risk factors in 188 countries, during 1990-2013: a systematic analysis for the Global Burden of Disease Study 2013. Lancet Neurol. 2016;15(9):913-24.
24. NCDRF Risk Factor Collaboration. Worldwide trends in blood pressure from 1975 to 2015: a pooled analysis of 1479 population-based measurement studies with 19.1 million participants. Lancet. 2017;389(10064):37-55.
25. World Health Organization (WHO). Global action plan for the prevention and control of NCDs 2013-2020. [Accessed in 2017 Apr 12]. Available from: http://www.who.int/nmh/events/ncd_action_plan/en/
26. World Health Organization (WHO). Governance: updating appendix 3 of the WHO global NCD action plan 2013-2020. [Internet]. [Accessed in 2017 Apr 12]. Available from: http://who.int/ncds/management/WHO_ Appendix_BestBuys.pdf.
27. Lambert CA, Tishkoff SA. Genetic structure in African populations: implications for human demographic history. Cold Spring Harb Symp Quant Biol. 2009;74:395-402.
28. Busby GBJ, Band G, Le AS, Side Q, Jallaw N, Bougama F, et al. Admixture into and within sub-Saharan Africa. Elife. 2016 Jun 21;5. pii:e15266.
29. Longobardi G, Ghirotto S, Guardiano C, Tassi F, Benazzo A, Ceolin A, et al. Across language families: genome diversity mirrors linguistic variation within Europe. Am J Phys Anthropol. 2015;157(4):630-40.
30. Kullo IJ, Ding K. Patterns of population differentiation of candidate genes for cardiovascular disease. BMC Genet. 2007 Jul 12;8:48.
31. Nascimento BR, Beaton AZ, Nunes MC, Lopes EL, Rezende VM, Landay T, et al. Echocardiographic prevalence of rheumatic heart disease in Brazilian schoolchildren: Data from the PROVAR study. Int J Cardiol. 2016 Sep 15;219:439-45.
Brazil Cape Verde Eq Guinea Guinea-Bissau Mozambique Sao Tome Príncipe
Angola Portugal Timor-Leste
Both sexes, all ages, 1990, Percent of total deaths
Brazil Cape Verde Eq Guinea Guinea-Bissau Mozambique Sao Tome Príncipe
Angola Portugal Timor-Leste
Both sexes, all ages, 1990, Percent of total deaths Malnutrition Malnutrition WaSH WaSH Air pollution Air pollution High blood pressure
High blood pressure Dietary risks
Dietary risks Tobacco
Tobacco High fasting plasma glucose
High fasting plasma glucose High body-mass index
High body-mass index High total cholesterol
High total cholesterol Alcohol & drug use
Alcohol & drug use Occupational risks
Occupational risks Impaired kidney function
Impaired kidney function Unsafe sex
Unsafe sex Low physical activity
Low physical activity Other environmental
Other environmental Low bone mineral density
Low bone mineral density Sexual abuse & violence
Sexual abuse & violence
1
1
1 1 1
1
1 1 1
2 2 2 2 2 2 2 2 2 3 3 3 3 3 3 3 3 3 4 4 4 4 4 4 4 4 4 5 5 5 5 5 5 5 5 5 6 6 6 6 6 6 6 6 6 7 7 7 7 7 7 7 7 7 8 8 8 8 8 8 8 8 8 9 9 9 9 9 9 9 9 9 10 10 10 10 10 10 10 10 10 11 11 11 11 11 11 11 11 11 12 12 12 12 12 12 12 12 12 13 13 13 13 13 13 13 13 13 14 14 14 14 14 14 14 14 14
15 15 15 15
15
15
15
15
15
16 16 16 16
16 16 16 16 16 17 1 1 1 1 1 1
1 1 1
2 2 2 2 2 2 2 2 2 3 3 3 3 3 3 3 3 3 4 4 4 4 4 4 4 4 4 5 5 5 5 5 5 5 5 5 6 6
6 6 6
6 6 6 6 7 7 7 7 7 7 7 7 7 8 8 8
8 8 8
8 8 8 9 9 9 9 9 9 9 9 9 10 10 10 10 10 10 10 10 10 11 11 11 11 11 11 11 11 11 12 12 12 12 12 12 12 12 12 13 13 13 13 13 13 13 13 13 14 14
14 14 14 14
14 14 14 15 15 15 15 15 15 15 15 15 16 16 16 16 16 16 16 16 16 17 17 17 17 17 17
17 17 17
17 17 17 17 17 17 17
17
Supplementary Figure 2 – Mortality attibutable to risk factors in Portuguese-speaking countries, in 1990 and 2016.
Supplementary Figure 1 – Age-standardized Disability Adjusted Life Years (DALY) attributable to cardiovascular disease (CVD) in Portuguese-speaking countries, from 1990 to 2016.
Year
1990 1991 1992 1993 1994 1995 1996 1997 1998 1999 2000 2001 2002 2003 2004 2005 2006 2007 2008 2009 2010 2011 2012 2013 2014 2015 2016 6k 8k 10k 4k 2k 0 DAL
Ys per 100,000
Cardiovascular diseases Both sexes, Age-standardized