• Nenhum resultado encontrado

Arsenic determination in complex mining residues by ICP OES after ultrasonic extraction

N/A
N/A
Protected

Academic year: 2019

Share "Arsenic determination in complex mining residues by ICP OES after ultrasonic extraction"

Copied!
5
0
0

Texto

(1)

Arsenic determination in complex mining residues by ICP OES after

ultrasonic extraction

Jéssica F.R. Paula

a

, Roberta E.S. Froes-Silva

b,c,

, Virgínia S.T. Ciminelli

a,b aUniversidade Federal de Minas Gerais, Escola de Engenharia, Departamento de Engenharia Metalúrgica e de materiais, Brazil bInstituto Nacional de Ciência e Tecnologia, Recursos minerais, Água e Biodiversidade, Brazil

cUniversidade Federal de Ouro Preto, Instituto de Ciências Exatas e Biológicas, Departamento de Química, Morro do Cruzeiro, Campus Universitário, Ouro Preto/MG, 35.400-000, Brazil

a b s t r a c t

a r t i c l e

i n f o

Article history:

Received 16 December 2011

Received in revised form 19 March 2012 Accepted 22 March 2012

Available online 5 April 2012

Keywords: Arsenic extraction Mining waste Ultrasound

The impact caused by mining residue deposits with high amounts of arsenic is a potential environmental problem and motive for investigations. Arsenic is always associated with gold ores and is present in mining areas, probably due to sulfide oxidation and the high pH range where arsenic is soluble. It has been shown that some samples of residues coming from the studied deposits presented arsenic concentrations above 2500 mg kg−1. The aim of this work is to develop methods for arsenic extraction in mining residues employ-ing ultrasound assistance extraction and analyte determination by hydride generation ICP OES. The analytical method provided analysis precision and a better evaluation of environmental impact of mining residue de-posits. Optimal conditions for ultrasound assisted extraction were obtained by evaluation of parameters such as the position of the sampleflask inside the ultrasound bath and temperature as a function of the im-mersion time. These tests identified the ideal position of the sampleflask and indicated that the maximum time that the sample could be analyzed without arsenic lost due to increase of the temperature was 180 mi-nutes. With these conditions, an experimental design was developed to obtain the optimal conditions of ar-senic extraction, evaluating the type of extraction solution and the sonication time. A 22Central Composite

Design (CCD) was employed to evaluate the acid concentration (HCl, HNO3and H3PO4) and the sonication

time (maximum 180 minutes). The quadratic equation of response surface generated by CCD, employing HNO3, indicated that the best condition for arsenic extraction is using an acid concentration of 2.7 mol L−1

and sonication for 136 minutes to give an average concentration of 1847 ± 17 mg kg−1. Recovery studies were carried out and the obtained values were close to 100%. Optimal conditions of arsenic extraction were obtained by evaluating the operational parameters of ultrasound bath and the analysis conditions with the experimental design. The method developed contributes significantly to a more precise evaluation of the real environmental impact caused by the mining residues deposit.

© 2012 Elsevier B.V.

1. Introduction

Arsenic in mining areas has created an environmental problem. The presence of arsenic in certain mining areas has been highlighted in the scientific literature by various research groups[15]. Arsenic is always associated with gold ores and is present in mining areas, prob-ably due to sulfide oxidation and the high pH range where arsenic is soluble[6]. It has been shown that some samples of residues coming from a deposit of mining waste presented arsenic concentrations above 2500 mg kg−1[7].

Some mining wastes are difcult to solubilize and new so extraction procedures are needed to assess the free arsenic. Alternative studies evaluating the potential arsenic extraction are being realized to under-stand the arsenic readiness in the residue and soils. Sequential chemical

extraction procedure was used to evaluate the arsenic concentration in mining waste and soils by[8]. Ruiz-Cancho et al.[9]used a block digest-er and a microwave digestion to obtain the extract to evaluate the arse-nic species present by LC-HG-AFS. The application of ultrasound is very promising in hydrometallurgy, including accelerating the processes of extraction and leaching. The ultrasound procedure can make available a chemical species present in a solid matrix for the extraction or for the dissolution of the species of interest. The energy required for extrac-tion of metals is provided by thefield of cavitation, which causes an in-crease in local temperature in the order of hundreds of degrees and a pressure increase of several hundred atmospheres. In addition, micro turbulent pulsations in thin layers of liquid in contact with the solid par-ticles[10]. This technique promotes the larger interaction between the liquid phase and the solid surface by reduction of particles size and ac-celeration of chemical dissolution and thus increasing the concentration of inorganic species in the liquid phase[11,12].

A multivariate optimization can be applied in the development of new methodologies for arsenic extraction. This technique can promote

⁎ Corresponding author. Tel.: + 55 31 3559-1233; fax: +55 31 3559 1228. E-mail address:robertafroes@iceb.ufop.br(R.E.S. Froes-Silva).

0026-265X/© 2012 Elsevier B.V. doi:10.1016/j.microc.2012.03.019

Contents lists available atSciVerse ScienceDirect

Microchemical Journal

j o u r n a l h o m e p a g e : w w w . e l s e v i e r . c o m / l o c a t e / m i c r o c

Open access under the Elsevier OA license.

(2)

a fast and precise design evaluating multi parameters at the same time

[1315]. The surface response generated by this design can indicate the optimal condition for analysis. The application of multivariate optimiza-tion in the arsenic extracoptimiza-tion could be an alternative for analysis of the complex mining waste, which can be useful for the evaluation of real impact caused by the complex mining waste deposit.

The aim of this work is the development of a new and alternative methodology for arsenic extraction from complex mining waste with difcult decomposition using ultrasound extraction.

2. Experimental

2.1. Instrumentation

An analytical balance Kern 410 model was used to measure the mass of the samples. An ultrasonic cleaning bath GA1000/TA1800 (Thornton; São Paulo, Brazil) with a frequency of 25 Hz was used for the extraction of arsenic from mining tailings samples.

A closed vessel microwave oven (Ethos 1, Milestone; Sorisole, Italy) was used to decompose the sample in order to compare the efficiency between the open ultrasonic bath using optimized conditions and the experiment performed under microwave conditions. The extracts were analyzed in an inductively coupled plasma optical emission spec-trometer (ICP OES) model: DV 7200 (Perkin Elmer instruments, Shel-ton, USA) with hydride generation. The operational conditions are presented inTable 1.

2.2. Reagent, solution and sample

A standard 1000 mg L−1 arsenic solution (ICP Standard, Merck Certipur®, Darmstadt, Germany) was used to prepare the calibration curve and reference solutions. All the solutions were prepared with ultrapure water. For hydride-generating were used hydrochloric acid solution (2 mol L−1) (37% HCl, Merck), sodium borohydride (NaBH4tablets, Fluka, purum, purity >97%) at 1.5% in 0.2% NaOH

(Merck). The HNO3, HCl and H3PO4(Merck, analytical grade)

concen-trated acids used were diluted with ultrapure water to prepare the solutions for analysis. The reference material Buffalo River Sediment (National Institute of Standards and Technology, NIST RM 8704), were used as reference for some tests. Real sample of complex mining waste, collected in a deposit of mining, was used in the multivariate optimization and the recovery studies.

2.3. Evaluation of axial position in theflask

In order to assess the influence of the position of the sample inside the ultrasonic bath, the tub was divided into four quadrants, 15 cm by 15 cm. Next, nine locations in the tub were selected, as indicated in the layout ofFig. 1.

The samples are prepared in duplicate using 0.1 g of a reference material Buffalo River Sediment 8704 and mixed in aflask containing 10.0 mL of HNO30.5 mol L−1solution. Theflasks were sonicated for

1 hour. Subsequently, the samples were centrifuged and the superna-tant was transferred to 15 mL polyethylene tubes for analysis of the arsenic concentration via ICP-OES.

2.4. Evaluation of the temperature as a function of time in the ultrasound bath

The effect of sonication in the sample system cannot be considered only as a mechanical wave effect. The temperature increasing in the bath due the energy liberated[16] should also be considered. The monitoring of the temperature was made in a range of 180 minutes, by measuring the temperature at intervals of 25 minutes.

To evaluate the inuence of temperature on the extraction of arse-nic, the reference materialBuffalo River Sediment 8704was weighed in duplicate samples with a nominal mass of 0.2 g and then placed in 50 mL polyethylene tubes. To the tubes containing the samples 20.0 mL of HNO32.0 mol L−1was added before washing them in the

ul-trasonic bath. One sample was placed in the bath at room temperature, 25 °C, and the other to the initial temperature of 40 °C. Both were son-icated for 1 hour. Subsequently the samples were centrifuged for 10 mi-nutes and the supernatant was stored in 50 mL polypropylene tubes until analysis via ICP-OES.

2.5. Multivariate optimization

For the extraction of arsenic by ultrasound sonication it was used a mass ratio of solid / solution volume of extractant 0.01 g mL−1. This mass ratio is based in the work where the same ratio was used to evaluate arsenic extraction to speciation in soil using a probe ultra-sonic[17].

Ten samples were weighed in duplicate, 0.1 g of solid waste (with arsenic concentration estimated in 2000 mg kg−1) in polyethylene bottles (15 mL). To each bottle 10.00 mL of extractant solution was added, minutes before the samples were subjected to ultrasonic bath. Theasks were shaken manually to allow contact between the entire solid with the acid solution.

A Central Composite Design 22(CCD) was used in order to assess

the concentration of acid (HCl, HNO3 and H3PO4) and sonication

time (maximum 180 minutes). To avoid the mixing of the acids, the

same study design was employed individually for HCl, HNO3 and

H3PO4. The implementation of the design was done in Statistica ®

7.0 software. The design data are shown inTable 2.

The bottles were placed in the ultrasound bath tub in the region determined to have higher-intensity ultrasonic waves (see layout) at room temperature initially, and subjected to ultrasonic energy at a frequency of 25 kHz.

After soaking in a bath of ultrasound during the specific time for each sample, the resulting mixture wasltered and the supernatant was stored in polyethylene bottle and cooled to 5 °C and subsequent-ly anasubsequent-lyzed by ICP-OES.

Table 1

Operational conditions of ICP OES.

Parameter

Auxiliary gasflow rate (L min−1) 0.2

Plasma gasflow rate (L min−1) 15

Injector tube diameter (mm) 2.0

View Axial

Interface Shear gas

Applied power (kW) 1.3

Nebulization gasflow rate (L min−1) 0.6

(3)

2.6. Extraction of arsenic in the microwave

A 0.1 g of the milling waste were weighed in duplicate, in watch glasses and transferred to Teflon tubes. To the Teflon tube was added 9.0 ml of HNO3and 3.0 ml of HF in order to remove the rest

of the solid adhered to the watch glass. We prepared two blank sam-ples containing the same volume of acid added to the samsam-ples. The samples were taken to the microwave oven for 30 minutes, 15 mi-nutes warming up to the temperature of 200 °C and dwelled at same temperature for 15 minutes. After a complete cooling system, 0.8 g of H3BO3 was added to neutralize residual hydrofluoric acid

and the heating program was repeated. The samples, after cooling, were diluted with ultrapure water to afinal volume of 50.0 ml and stored in a refrigerator at 5 °C and analyzed by ICP-OES.

3. Results and discussion

3.1. Evaluation of axial position in theflask

Nine positions were evaluated in this test as shown in thefigure below (Fig. 1). The arsenic concentrations in the extracts for each po-sition are listed inTable 3.

Higher concentrations of arsenic were obtained in the square re-gion of 5689 position. This region is close to the ultrasound source suffering more impact by the waves. The radial position was constant in all experiments.

3.2. Evaluation of the temperature as a function of time in the ultrasound bath

The control of the temperature was made by measuring the tem-perature value every 25 minutes for 180 minutes. The data obtained are presented inFig. 2.

It is noteworthy that there occurs a non-linear increase in temper-ature with averages of 2.3 °C every 25 minutes. To evaluate the infl u-ence of the temperature in the arsenic extraction duplicate samples

with 2.0 g of reference material and 20.0 mL of HNO3 solution

2.0 mol L−1were prepared. The duplicates were put inside the bath in the same position (square 5–6–8–9). In thefirst tests, the sample

was put in the ultrasound bath at an initial temperature of 25 °C and in the second test at an initial temperature of 40 °C. The total time of sonication was 180 minutes. The results are shown inTable 4.

The results indicate that there is no signicant inuence of the temperature on the arsenic extraction when using ultrasound bath in the studied range. From here on, a maximum time of 180 minutes will be used given that at temperatures higher than 40 °C the arsenic concentration can be compromised.

The operating conditions for the appropriate use of the ultrasound bath was evaluated when developing an experimental design to de-termine the optimal conditions for extraction of arsenic in complex mining residues. This design allows the evaluation of multiple factors, and time, type of extractant solution and the concentration factors in this study.

3.3. Multivariate optimization

A 22Central Composite Design (CCD) was employed to evaluate

the acid concentration (HCl, HNO3 and H3PO4) and the sonication

time (maximum, 180 minutes). The design execution was made in the Statistica® 7.0 software. The design data are show inTable 5.

The mining waste samples were used in the design. The results for each acid are shown below.

3.3.1. Arsenic extraction in complex mining residues employing H3PO4 The results using H3PO4arsenic extraction in ultrasound bath are

shown inTable 6.

The model generated explains 81% of total variance and the re-sponse surface (Fig. 3), generated by quadratic Eq.(1)and indicates

that with a time of 104 minutes and H3PO4 concentration of

2.4 mg L−1the maximum arsenic extraction will be achieved from the sample.

z¼70256þ00264x00001x2þ27741y−05799 y2

−00043xy ð1Þ

3.3.2. Extraction of arsenic in complex mining residues using HCl complex The data were evaluated in the experimental design but the model generated was not suitable for the removal of arsenic, due to inappro-priate operating conditions and therefore optimal conditions could not be established by the model. For this acid, another experimental Table 2

Parameters of time and acid concentration determined by the CCD design.

Sample Time (min) Acid concentration (mol L−1)

2 50 3.0

7 195 2.0

6 25 2.0

9 110 3.5

10 (C) 110 2.0

1 50 1.0

5 (C) 110 2.0

8 110 0.6

3 170 1.0

4 170 3.0

Table 3

Arsenic concentration in function of theflask position.

Position [As] (μg L−1) Position [As] (

μg L−1)

1A 184.5 1B 192.9

2A 193.6 2B 177.8

3A 189.2 3B 191.2

4A 182.4 4B 201.8

5A 197.9 5B 198.9

6A 203.6 6B 180.2

7A 204.2 7B 198.5

8A 216.7 8B 210.2

9A 216.3 9B 213.8

Fig. 2.Temperature in function of the time.

Table 4

Influence of the temperature of the ultrasound bath in the arsenic extraction.

Initial temperature (°C) Sample average (n= 2) [As]μg L−1

25 1ª 174.2

25 1B 169.1

40 2ª 171.5

(4)

design needs be tested in order to obtain the best operational condi-tions. The data from the arsenic extraction with HCl are shown in

Table 6and were obtained using the operational condition employed in the evaluation the axial position in theflask (2.3).

3.3.3. Extraction of arsenic in complex mining residues using complex HNO3

Table 6displays the results of the extraction of arsenic in the bath HNO3using ultrasound. Equation and response surface are also

dis-played below (Fig. 4).

Eq.(2)was generated to explain the model and the surface area of the response using HNO3extraction of arsenic (Fig. 4).

z¼2390;9853þ29;0969x0;0827x2

þ1742;7075

y−264;1269y2−2;4565xy ð2Þ

The generated model explains 97% of the total variance and the surface generated by Eq.(2)indicates that the maximum extraction of arsenic is hit when employing a sonication time of 136 minutes and a HNO3concentration of 2.7 mol L−1.

Comparing the efciency of arsenic extraction by the different acids tested, it was concluded that maximum concentration of arsenic was 1903.7 ±50.0 mg kg−1for the extraction performed with HNO

3and

was much higher than those achieved by H3PO4and HCl, whose

concen-tration maximum were 36.3± 2.0 mg kg−1 and 43.9± 1.3 mg kg−1, respectively. The high oxidizing power of HNO3explains the superior

performance over H3PO4. A more appropriate experimental design is

needed for the employment of HCl given that design used in this study was unable to derive the proper operating condition for this acid. Thus, recovery studies employing the optimum conditions of time and concen-tration determined for HNO3 (time equal to 136 minutes and the

concentration of 2.7 mol L−1) were performed and the values obtained were close to 100% as shown inTable 7.

3.4. Results for the extraction of arsenic in the microwave

Employing the conditions specied for the extraction of arsenic in the microwave closed vessels resulted in an average arsenic concen-tration of 1385.0 ± 41.0 mg kg−1(Table 8). This concentration was lower than that for the optimized method, whose average was 1847.0 ± 17.0 mg kg−1. The decrease of arsenic concentration in the Table 5

22CCD design data.

Sample Time (min) Concentration of extractants (mol L−1)

2 50 3.0

7 195 2.0

6 25 2.0

9 110 3.41

10(C) 110 2.0

1 50 1.0

5(C) 110 2.0

8 110 0.6

3 170 1.0

4 170 3.0

Table 6

Extraction of arsenic in H3PO4, HCl and HNO3with ultrasound bath.

Sample Time (min)

Concentration of extractants (mol L−1)

Concentration As (mg kg−1)

H3PO4 HCl HNO3

2 50 3.0 27.9 32.6 1209.5

7 195 2.0 32.7 36.5 1683.5

6 25 2.0 29.2 33.8 677.7

9 110 3.5 31.8 34.8 1903.7

10(C) 110 2.0 36.0 39.0 1710.7

1 50 1.0 32.3 40.1 178.5

5(C) 110 2.0 27.4 35.0 1684.5

8 110 0.6 34.4 43.9 591.7

3 70 1.0 29.5 40.9 1200.2

4 170 3.0 22.1 31.6 1641.7

Fig. 3.Surface response corresponding to the influence of concentration and time of sonication for the extraction of arsenic from mining waste sample with H3PO4.

Fig. 4.Surface response corresponding to the influence of concentration and time sonication on the extraction of arsenic from mining waste sample with HNO3.

Table 7

Study of arsenic recovery for optimized conditions for HNO3.

Sample Concentration As (mg kg−1)

A 1872

B 1748

C 1842

D 1760

F 1885

(5)

microwave extraction probably is due the some loss by volatilization caused by the high temperatures in the digester vessel.

4. Conclusions

The results for the extraction of arsenic in complex mining waste by employing a CCD design for the use of an ultrasonic bath for ener-gy proved to be quite satisfactory. Optimum conditions for extraction of arsenic were obtained by evaluating operational parameters of the ultrasonic bath and conditions of analysis with the experimental design.

In assessing the influence of temperature on the extraction of ar-senic in ultrasound, it was noted that there is no significant influence up to 40 °C. However, it was noted that the position of the sample in the ultrasonic bath tub is significant in that a greater proximity be-tween the samples and the source of ultrasonic waves allows the in-tensication of the phenomenon of cavitation in the vicinity of the sample and thus, extraction of arsenic.

The concentration of arsenic obtained using the method optimized for ultrasound (HNO3, 2.7 mol L−1 and 136 minutes of sonication)

was superior to that obtained by the standard method performed in the microwave, which indicates that the method developed contrib-utes signicantly to the establishment of a more accurate assessment of the real environmental impact caused by mining waste deposits.

Acknowledgment

The authors acknowledge the CNPq by the scholarships and the FAPEMIG for thenancial support. Authors would also like to thank Dr. Jason G. Taylor (UFOP) for insightful discussion and for reviewing the manuscript for its English usage.

References

[1] B.G. Rawlins, T.M. Williams, N. Breward, L. Ferpozzi, B.F. Figueiredo, R.P. Borba, Preliminary Investigation of Mining-Related Arsenic Contamination in the Prov-inces of Mendoza and San Juan (Argentina) and Minas Gerais State (Brazil), British Geological Survey, London, 1997 25 pp.

[2] E. Deschamps, V.S.T. Ciminelli, F.T. Lange, J. Matschullat, B. Raue, H. Schmidt, Soil and sediment geochemistry of the Iron Quadrangle, Brazil—the case of arsenic, J. Soils Sediments 2 (4) (2002) 216–222.

[3] H.S.S. Pimentel, J.C. Lena, J.R. Nalini, Studies of water quality in the Ouro Preto re-gion, Minas Gerais, Brazil: the release of arsenic to the hydrological system, Envi-ron. Geol. 43 (2003) 725–730.

[4] R.P. Borba, B.R. Figueiredo, J. Matshullat, Geochemical distribution of arsenic in waters, sediments and weathered gold mineralized rocks from Iron Quadrangle, Brazil, Environ. Geol. 4 (2003) 39–52.

[5] R.P. Borba, B.R. Figueiredo, B.G. Rawllins, J. Matchullat, Arsenic in water and sed-iment in the Iron Quadrangle, Minas Gerais state, Brazil, Rev. Bras. Geociênc. 30 (3) (2000) 554–557.

[6] L.X.L. Capanema, V.S.T. Ciminelli, An investigation of Acid Rock Drainage (ARD) occurrence in a gold mine located in a southeastern Brazil region, Rev. Esc. Minas 56 (3) (2003) 201–206 (Ouro Preto).

[7] R. Bayard, V. Chatain, C. Gachet, A. Troadec, R. Gourdon, Mobilisation of arsenic from a mining soil in batch slurry experiments under bio-oxidative conditions, Water Res. 40 (6) (2006) 1240–1248.

[8] P.J. Kavanagh, M.E. Farago, I. Thornton, R.S. Braman, Bioavailability of arsenic in soil and mine wastes of the Tamar Valley, SW England, Chem. Speciation Bioavail-ability 9 (3) (1997) 77–81.

[9] M.J. Ruiz-Chancho, F. López-Sánchez, R. Rubio, Analytical speciation as a tool to assess arsenic behaviour in soils polluted by mining, Anal. Bioanal. Chem. 387 (2007) 627–635.

[10] P.I. Polyukhin, The Use of Ultrasonics in Extractive Metallurgy, Technicopy, Stone-house, UK, 1978 (translated from Russian).

[11] P.M. Kanthale, R. Parag, A. Gogate, B. Aniruddha, A. Pandit, A.M. Wilhelm, Mapping of an ultrasonic horn: link primary and secondary effects of ultrasound, Ultrason. Sonochem. 10 (2003) 331–335.

[12] P.R. Gogate, A. Prashant, M.K. Parag, B.P. Aniruddha, Mapping of sonochemical re-actors: review, analysis, and experimental verification, AICHE J. 4 (8) (2002) 7. [13] K.R. Beeb, R.J. Pell, M.B. Seasholtz, Chemometrics: A Practical Guide, Wiley, ed.,

New York; 1998, 360 pp.

[14] D.L. Massart, B.G.M. Vandeginste, L.M.C. Buydens, S. De Jong, P.J. Lewin, J. Smeyers-Verbeke, Handbook of Chemometrics and Qualimetrics: Part B, Elsevier, Amsterdam, 1998 732 pp.

[15] V. Calado, D. Montgomery, Planejamento de Experimentos usando o Statistica, 85-87922-83-1, 2003.

[16] T. Lepoint, F. Mullie, What exactly is cavitation chemistry? Ultrason. Sonochem. 1 (1994) 13–22.

[17] E. Sanz, Muñoz-OlivasR. , C. Cámara, Evaluation of a focused sonication probe for arsenic speciation in environmental and biological samples, J. Cromatograph. A 1097 (2005) 1–2.

Table 8

Arsenic concentrations determined after microwave assisted.

Sample Concentration As (mg L−1) Concentration As (mg kg−1)

A 3.08 1529

Imagem

Fig. 1. Layout of selected positions in the ultrasound bath.
Fig. 2. Temperature in function of the time.
Table 6 displays the results of the extraction of arsenic in the bath HNO 3 using ultrasound

Referências

Documentos relacionados

O teste de avaliação da adequação da cor e do sabor de alfarroba em pó foi realizado através da escala relativa ao ideal de 7 pontos, onde 1= muito menos forte que o ideal; 4 =

The probability of attending school four our group of interest in this region increased by 6.5 percentage points after the expansion of the Bolsa Família program in 2007 and

Source: Adidas’ financial statements; Analysts‘ estimates.. Based on Adidas’ quarterly reports of 2019, right-of-use assets are part of the line item property, plant and

The study aim is to develop a simple and efficient method employing ultrasonic bath extraction for arsenic in edible grains cultivated in an area near gold mining activities

fontes de financiamento e regulação de mercados) nos países podem afetar a forma como as normas são utilizadas na prática, pelo que as opções abertas nas IFRS podem ser exercidas de

A avaliação do papel do transporte público nos padrões de mobilidade no acesso a este campus universitário será realizada em duas fases: primeiramente

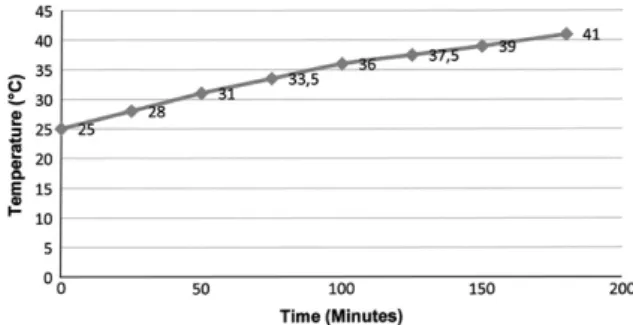
As the first step of this study, the optimal conditions for the ultrasound assisted extraction (Time, Temperature, Solid/Liquid ratio) were investigated using an energy

After defining the optimal conditions for the antimony determination in hair samples, the method was applied to the analysis of ten samples of hair collected from patients