Patr´ıcia M. Carneiro Paulo Igor M. Firmino Mayara C. Costa Alexandre C. Lopes Andr ´e B. dos Santos
Department of Hydraulic and Environmental Engineering, Federal University of Cear ´a, Fortaleza, Cear ´a, Brazil
Received July 10, 2013 Revised October 17, 2013 Accepted November 2, 2013
Research Article
Multivariate optimization of headspace-GC
for the determination of monoaromatic
compounds (benzene, toluene,
ethylbenzene, and xylenes) in waters and
wastewaters
The objective of this study was to optimize, by employing a central composite rotatable design, and validate an analytical method to detect and quantify monoaromatic compounds (benzene, toluene, ethylbenzene, and xylenes) in waters and wastewaters by using headspace extraction followed by GC coupled with photoionization detection. The extraction parameters optimized were: salinity, sample volume, incubation time, and extraction temperature. The results revealed that the sample volume was the most significant parameter in the extraction process, whereas the salinity effect was negligible, which extends the applicability of the analytical method to waters with different salinities. Finally, the studied method was very selective and, at the optimal extraction conditions (15 mL sample volume, 15 min incubation time, and temperature of 70⬚C), presented excellent repeatability (<4%), linearity (R>0.999 for each compound), and sensitivity, since very low LODs (0.13–0.48 g/L) and LOQs (0.43–1.61g/L) were achieved.
Keywords: Headspace extraction / Monoaromatics / Multivariate optimization / Photoionization detection
DOI 10.1002/jssc.201300668
Additional supporting information may be found in the online version of this article at the publisher’s web-site1 Introduction
Among the different compounds present in crude oil and its derivatives, monoaromatic hydrocarbons such as ben-zene, toluene, ethylbenben-zene, and xylene isomers (BTEX) represent an important category under an environmental and human health perspective since they are very toxic and potentially carcinogenic even at low concentrations [1–6].
Compared to other oil hydrocarbons, particularly the aliphatic ones, BTEX are extremely volatile and have high wa-ter solubility. Therefore, they can contaminate extensively the air, soils and surface, or underground waters [7–10]. The main sources of BTEX contamination are atmospheric deposition,
Correspondence:Professor Andr ´e B. dos Santos, Department of Hydraulic and Environmental Engineering, Campus do Pici, Bloco 713, Pici, CEP: 60455-900, Fortaleza – Cear ´a – Brazil
E-mail:andre23@ufc.br
Fax:+55 85 3366-9490
Abbreviations: BTEX, benzene, toluene, ethylbenzene, and xylenes;CCD, central composite design;FID, flame ionization detection;HS, headspace;LUBNOR, Lubrificantes e Deriva-dos de Petr ´oleo do Nordeste (Northeastern Lubricants and Oil Derivatives);PID, photoionization detection
leaks from underground fuel storage tanks or pipelines, in-adequate effluent disposal, accidental spills of petroleum products during transport, and leaching from landfill [11–16].
According to Es’haghi et al. [17], in order to compre-hend BTEX dynamics in the environment, consistent and accurate analytical techniques are necessary to detect these compounds. Therefore, GC with flame ionization detection (FID) and photoionization detection (PID) has been predom-inantly used because it is considered highly efficient at the separation, identification, and quantification of these chemi-cals [12, 18, 19].
However, since these compounds are generally found in waters and wastewaters at low concentrations (ng/L or
g/L), these analytical methods need a preconcentration step, such as liquid–liquid extraction, headspace (HS) extraction, or solid-phase microextraction [12, 17, 19]. Due to the high volatility of BTEX, the HS extraction technique coupled with GC (HS–GC) has been performed quite efficiently, present-ing advantages, such as good repeatability, simple instrumen-tation, and high recovery [20, 21].
analytical sensitivity and reduce the total analysis time, it is recommended that such parameters are optimized [22–24]. In general, the optimization process is performed by a uni-variate approach, i.e., the classic system in which the factors (design variables) are analyzed individually. However, since this methodology does not consider the interaction among the variables, the result does not necessarily correspond to the conditions of the true optimal point, because, especially in chemical systems, variables tend to correlate strongly, in-teracting synergistically or antagonistically. Therefore, if the interactions between the factors are not considered, the op-timization process might present low relevance [22]. Alter-natively, multivariate optimization techniques, such as the central composite design (CCD)—useful in response surface methodology—allow the simultaneous evaluation of the ef-fect of a large number of variables and their interactions from a reduced number of experiments [22, 24].
However, although there are, in the literature, many in-vestigations on method development and validation for BTEX determination [3,12,17,18,20,23,25], very few used multivari-ate experimental design techniques in the extraction process optimization [3, 23].
Hence, the objective of this study was to optimize, em-ploying a multivariate experimental design, i.e., a CCD, and validate an analytical method to detect and quantify BTEX compounds in waters and wastewaters by using HS–GC–PID.
2 Materials and methods
2.1 Chemicals and solutions
All chemicals, namely, benzene (99.5%, Dinˆamica Qu´ımica), toluene (99.5%, Vetec), ethylbenzene (99.0%, Sigma-Aldrich),o-xylene (98.0%, Fluka),m-xylene (99.0%, Sigma-Aldrich),p-xylene (99.0%, Sigma-Aldrich), the internal stan-dard chlorobenzene (99.0%, Vetec), and methanol (99.9%, Sigma-Aldrich), were used as purchased without further purification.
Prior to use, BTEX standard solutions used in chromato-graphic analyses were immediately prepared in ultrapure water (Milli-Q system, Millipore) by diluting a methanolic BTEX stock solution of 1000 mg/L. The methanolic solution of chlorobenzene (internal standard) at a concentration of 100 mg/L was prepared by diluting the pure reagent and sub-sequently added to each sample to reach a final concentration of 100g/L.
In all BTEX determinations, the standards were pre-pared directly into HS borosilicate glass vials (20 mL; Supelco, USA), which were previously washed in an sonic bath (Cristofoli Biosecurity, Brazil) filled with ultra-pure water (Milli-Q system, Millipore). Then the vials were sealed with polytetrafluoroethylene/silicone septa and alu-minum crimp seals (Supelco) immediately after the addition of standards in order to prevent the compounds volatilization. All standards were prepared in duplicate.
2.2 Optimization of BTEX extraction
To optimize the analytical conditions of BTEX HS extraction and, therefore, increase the chromatographic analysis sensi-tivity, a CCD was used, i.e., a full factorial design 24 (four factors at two levels) with the addition of eight axial points and three replicates at the central point (−2,−1, 0,+1,+2), resulting in a total of 27 experiments, which were performed randomly with a BTEX standard solution containing 100g/L of each compound. All response surfaces were mathemati-cally best described by a quadratic model consisting of ten coefficients rather than linear models.
The optimized design variables (factors) were: salinity (0.0, 0.5, 1.0, 1.5, 2.0 g/L), to evaluate the ionic strength effect (salting-out effect), liquid sample volume into the HS vial (5.0, 7.5, 10.0, 12.5, 15.0 mL), incubation time (5, 10, 15, 20, 25 min), and extraction temperature (50, 60, 70, 80, 90⬚C). The multivariate optimization of the extraction parameters was performed by the statistical routines of the computer software Statgraphics Centurion XV (StatPoint, USA), in which the response variables were the chromatographic peak areas of each BTEX compound.
2.3 Chromatographic conditions
BTEX was determined by static HS extraction (Triplus HS, Thermo Scientific, USA) followed by GC–PID (Trace GC Ultra, Thermo Scientific, USA). The samples (15 mL) were previously diluted with ultrapure water (Q system, Milli-pore) into 20 mL HS borosilicate glass vials (Supelco), sealed with polytetrafluoroethylene /silicone septa and aluminum crimp seals and, then, extracted by the static HS technique. After the extraction (15 min at 70⬚C), 0.3 mL of the sample HS was injected in splitless mode, and the chromatographic separation was performed on an OV-5 capillary column (5% diphenyl 95% dimethylpolysiloxane, 30 m, 0.25 mm id, 0.25 m film thickness; Ohio Valley Specialty Company, USA). Hydrogen was used as the carrier gas at a flow rate of 3.0 mL/min, whereas nitrogen was used as the sheath and make-up gases at flow rates of 7 and 40 mL/min, re-spectively, both purchased from White Martins, Brazil. The temperatures of the injector and detector were 250 and 240⬚C, respectively, and the oven temperature was initially set at 35⬚C for 7 min, then increased to 120⬚C at 35⬚C/min and, finally, held for 2.14 min.
2.4 Method validation
The analytical method validation was performed in terms of selectivity, linearity, precision, LOD, and LOQ.
at 4⬚C in the dark to prevent volatilization, and, then, trans-ported to the laboratory, where the chromatographic analysis was carried out immediately.
Linearity was evaluated, for each BTEX compound, by the correlation coefficient (R) of the calibration curves, which were obtained, by the internal standard method, from the peak areas corresponding to ten different BTEX concentrations (0.5, 2.5, 5, 10, 25, 50, 100, 250, 500, and 1000g/L).
Precision was determined from the method repeatability by the RSD of the peak areas and retention times of each ana-lyte, obtained from ten replicate analysis of a BTEX standard solution containing 100g/L of each compound.
The LOD and LOQ were determined using the following equations [26]:
LOD= 3·
S (1)
and
LOQ= 10·
S (2)
whereis the estimated SD of ten replicates taken from the lowest point (concentration) of the calibration curve andSis the calibration curve slope [26].
3 Results and discussion
The study aimed to optimize, employing a multivariate ex-perimental design, i.e., a CCD, and validate an analytical method to detect and quantify BTEX compounds in waters and wastewaters by using HS–GC–PID.
Prior to the optimization tests of the HS extraction pa-rameters, some chromatographic conditions such as injec-tor, oven (temperature program) and detector temperatures, and the carrier gas flow, were established, in order to obtain
high-resolution chromatographic peaks in the shortest time, without any interference from other compounds, which could be present in the sample analyzed. Nevertheless, m-xylene andp-xylene were identified and quantified together as they co-eluted (Supporting Information Fig. S1).
Both analytical method optimization and validation were carried out only for PID since it showed a higher BTEX de-termination sensitivity than FID (Supporting Information Fig. S1), as well as its peaks presented a higher resolution at the concentration range tested, as observed in previous studies [12, 19].
3.1 Multivariate optimization of BTEX extraction
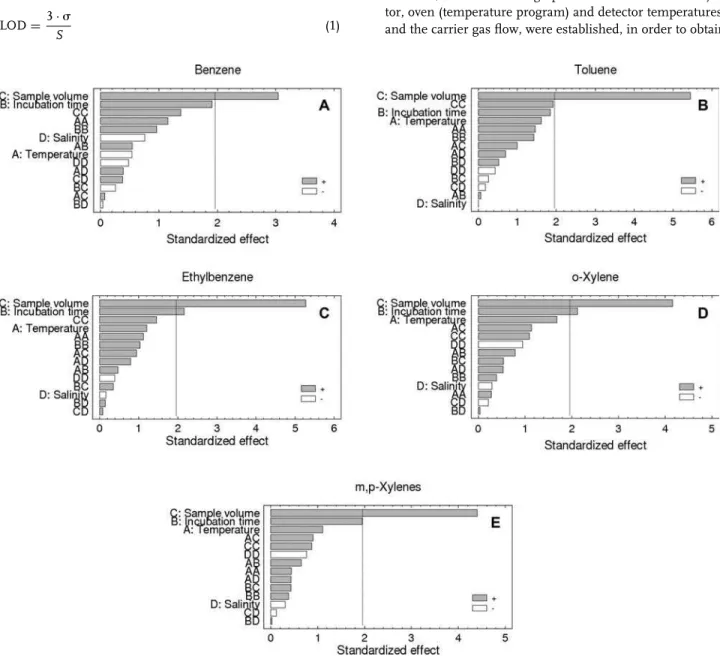
The Pareto charts obtained for each BTEX compound, at a 95% confidence level, revealed that the salinity effect was not significant in any case (Fig. 1). Thus, the extraction method proposed can be used to detect these compounds in differ-ent waters since BTEX determination was not dependdiffer-ent on salinity.
Additionally, the graphs show that, for all BTEX, the HS extraction was most influenced by the sample volume, whose optimal value was 15 mL. In fact, it was the only significant factor for most of the compounds evaluated (Fig. 1A, B, and E). On the other hand, for ethylbenzene and o-xylene, the incubation time was also quite significant (Fig. 1C and D), probably due to the higher boiling point of these compounds, which required, therefore, a longer time for the (aqueous and gaseous) phases to reach the equilibrium at the temperatures assessed. It is important to mention that, for the compounds benzene and m,p-xylenes, although the incubation time is apparently a significant factor, the statistical tests carried out by the software used did not consider this factor statistically significant at the 95.0% confidence level, i.e., theP-value for benzene and m,p-xylenes was 0.056 and 0.051 (P ≤ 0.05; Fig. 1A and E).
Although the temperature was not a significant factor, higher temperatures favored the extraction process for almost all compounds evaluated, except for benzene (Fig. 1A), which allowed better responses (i.e., larger peak areas) to be reached. These results are in accordance with those of Heleno et al. [3] who showed the feasibility of BTEX extraction from waters by static HS followed by GC–FID analysis and observed that the optimal temperature was 80⬚C.
According to Slater et al. [27], the extraction tempera-ture is an important parameter to the analytical sensitivity of volatile compounds since its increase reduces the compounds solubility and, therefore, favors analyte transfer from aqueous to gas phase. However, higher temperatures (>80⬚C) allow water vapor formation into the sample HS, which can lead to a significant reduction of the analytes of interest [12]. Fur-thermore, there is a possibility of syringe breakage during sampling since the pressure inside the vial is increased un-der high temperatures [20, 28]. Therefore, as recommended by Cavalcante et al. [12], the extraction temperature was lim-ited to 70⬚C.
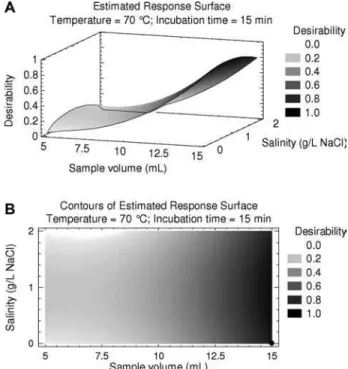
Figure 2. Response surface (A) and its respective contours (B) for the multivariate optimization of BTEX extraction: sample vol-ume versus salinity. The temperature was fixed at 70⬚C, and the incubation time at 15 min.
After the multivariate data optimization procedure, it was confirmed that the sample volume was the factor, which most impacted on the analytes signal (peak area), and the maxi-mum desirability was reached when the sample volume was 15 mL (Fig. 2). Once again, the salinity influence was verified to be clearly negligible (Fig. 2), so it was decided to keep it zero.
Concerning the incubation time, it can be observed that, at an extraction temperature of 70⬚C, the maximum response (the optimal value) was only reached after approximately 23 min (Fig. 3). However, a desirability of almost 0.90 (i.e., 90% of the maximum response) could be achieved at an in-cubation time of 15 min (Fig. 3), which, therefore, allowed the analysis to be carried out at a shorter total time without reducing considerably the analysis sensitivity.
3.2 HS–GC–PID method validation
To ensure the analytical method is reliable, it was submitted to validation, in which some parameters such as selectivity, linearity, precision, LODs, and limits of quantitation were determined.
Figure 3. Response surface (A) and its respective contours (B) for the multivariate optimization of BTEX extraction: temperature versus incubation time. The sample volume was fixed at 15 mL, and the salinity at 0 g/L.
compounds, the correlation coefficient (R) was >0.999 (Table 1), which indicated that the method had a good lin-earity.
The method repeatability ranged from 0.05 to 0.26% for the retention time (qualitative analysis) and from 1.46 to 3.76% for the peak area (quantitative analysis; Table 1), showing, therefore, a very good precision since no analyte presented an RSD above the upper limit of 5% [26]. The re-peatability achieved in this study is better than that obtained by Cavalcante et al. [12], who used the same equipment and same extraction technology, and in other BTEX determina-tion methods reported in the literature (Table 2).
The LOD and LOQ achieved for each BTEX compound ranged from 0.13 to 0.43 and from 0.43 to 1.61g/L, re-spectively, and were lower than some of those reported else-where [25,29], even when using the same extraction technique
of the current investigation [12, 20] (Table 2). This fact con-firms the high detector (PID) sensitivity for such aromatic compounds.
Additionally, the LOD and LOQ values were lower than the maximum allowable concentrations of BTEX either in drinking water or for wastewater release established by Brazil-ian authorities, such as Conselho Nacional do Meio Ambiente (National Environmental Council; CONAMA) [30], which establishes the maximum allowable concentrations of BTEX in wastewater release of 1200, 1200, 840, and 1600g/L for benzene, toluene, ethylbenzene, and xylenes, respectively, and also by the World Health Organization [31], which es-tablishes the maximum allowable concentrations of BTEX in drinking water of 10, 700, 300, and 500 g/L for benzene, toluene, ethylbenzene, and xylenes, respectively. Therefore, the HS–GC–PID method can be effectively used for determin-ing and monitordetermin-ing BTEX in different water and wastewater samples.
4 Conclusions
The multivariate experimental design technique allowed the optimization of the analytical conditions of HS extraction followed by GC–PID analysis for BTEX determination in dif-ferent aqueous samples such as groundwater, drinking water, surface waters, and wastewaters.
The sample volume was the most relevant parameter for BTEX determination, whereas the salinity did not influ-ence significantly the process. Thus, the proposed analytical method can be applied to different water samples since BTEX determination was not dependent on salinity.
The chromatographic method presented excellent selec-tivity, linearity, and precision in BTEX determination. It was also highly sensitive to these compounds since it achieved very low LODs and LOQs, which were lower than the max-imum allowable concentrations of BTEX either in drinking water or for wastewater release established by Brazilian and American environmental legislations and also by the World Health Organization.
Finally, HS–GC–PID has the potential to be expanded to other volatile organic compounds.
Table 1. Analytical parameters evaluated in HS–GC–PID method validation for BTEX determination
Analytes Linearity LOD (g/L) LOQ (g/L) Repeatabilitya) Recovery (%)
Regression equation Calibration range (g/L) Correlation coefficient (R) tR(%) Peak area (%)
Benzene y=0.0061x+0.0301 0.5–1000 0.9997 0.43 1.44 0.26 3.76 69
Toluene y=0.0114x+0.0136 0.5–1000 0.9999 0.48 1.61 0.20 3.17 44
Ethylbenzene y=0.0113x+0.0214 0.5–1000 0.9999 0.13 0.43 0.19 1.69 45
m,p-Xylenes y=0.013x+0.0567 0.5–1000 0.9999 0.41 1.37 0.09 1.46 87
o-Xylene y=0.0098x+0.0268 0.5–1000 0.9999 0.20 0.66 0.05 1.46 68
Table 2. Validation parameters from other BTEX determination methods
Technique/detection Linearity (g/L) LOD (g/L) LOQ (g/L) RSD (%) Reference
HS–GC–FID 10–8000 1.0–2.0 – 4.0–5.0 [20]
SPME–GC–FID 2–2000 0.2–1.0 – 4.0–8.0 [20]
HS-SPME–GC–FID 0.8–2000 0.08–0.6 – 3.0–7.0 [20]
P&T–GC–MS 0.5–10 0.05 – – [32]
HS–GC–MS 0.5–10 0.2–0.05 – – [32]
DAI–GC–FID 5–500 0.6–1.1 2.0–3.6 – [29]
HS-SPDE–GC–MS 0.013–15 0.013 – 3.2 [33]
HS-PVT–GC–MS 0–35 0.6–2.0 2.0–5.0 5.5–12 [34]
HS–GC–MS 0.01–5 0.10–0.81 – – [35]
DAI–GC–FID 5–520 0.24–2.1 – 5.6–21 [25]
SPME–GC–FID 2–100 0.05–0.28 0.14–0.84 0.86–2.07 [23]
HS–GC–PID 0.1–250 0.22–7.48 – 5.62–8.19 [12]
HS–GC–FID – 0.09–0.70 0.29–2.34 8.89–13.39 [3]
HS-SPME–GC–MS – 0.024–0.31 0.08–1.03 2.28–4.70 [3]
HF-SPME–GC–FID 0.001–0.02 0.005–0.006 – 3.4–4.5 [17]
P&T–GC–MS 6.5–4000 0.003–0.03 – 1.0–8.9 [1]
LLME–SPME–GC–MS 0.1–600 0.02–0.65 0.07–2.14 9.5–10.2 [6]
HS–GC–PID 0.5–1000 0.13–0.48 0.43–1.61 1.46–3.76 This study
LOQ, limit of quantitation; HS, headspace; SPME, solid-phase microextraction; P&T, purge and trap; DAI, direct aqueous injection; SPDE, solid-phase dynamic extraction; PVT, programmed temperature vaporization; HF, hollow fiber; LLME, liquid–liquid microextraction; FID, flame ionization detector; PID, photoionization detector.
The authors would like to thank Conselho Nacional de Desenvolvimento Cient´ıfico e Tecnol´ogico – CNPq (Process 481270/2010-8), Coordenac¸˜ao de Aperfeic¸oamento de Pessoal de N´ıvel Superior – CAPES (Process PNPD 3022/2010), and Fundac¸˜ao Cearense de Apoio ao Desenvolvimento Cient´ıfico e Tecnol´ogico – Funcap (Process 078.01.00/09) for the research grants and financial support. The authors would also like to thank LUBNOR – Petrobras for providing the samples.
The authors have declared no conflict of interest.
5
References
[1] Bianchin, J. N., Nardini, G., Merib, J., Dias, A. N., Mar-tendal, E., Carasek, E., J. Chromatogr. A 2012, 1233, 22–29.
[2] Cervantes, F. J., Mancilla, A. R., Rios-del Toro, E. E., Alpuche-Solis, A. G., Montoya-Lorenzana, L.,J. Hazard. Mater.2011,195, 201–207.
[3] Heleno, F. F., Lima, A. C., Afonso, R. J. C. F., Coutrim, M. X.,Qu´ım. Nova2010,33, 329–336.
[4] Mazzeo, D. E. C., Levy, C. E., de Angelis, D. F., Marin-Morales, M. A.,Sci. Total Environ.2010,408, 4334–4340. [5] Paix ˜ao, J. F., Nascimento, I. A., Pereira, S. A., Leite, M. B., Carvalho, G. C., Silveira Jr., J. S., Rebouc¸as, M., Matias, G. R., Rodrigues, I. L.,Environ. Res.2007,103, 365–374. [6] Ciucanu, I., Agotici, V.,J. Sep. Sci.2012,35, 1651–1658. [7] Farhadian, M., Duchez, D., Vachelard, C., Larroche, C.,
Bioresour. Technol.2009,100, 173–178.
[8] Hashemi, M., Jahanshahi, N., Habibi, A., Desalination
2012,288, 93–97.
[9] Jo, M. S., Rene, E. R., Kim, S. H., Park, H. S.,J. Hazard. Mater.2008,152, 1276–1284.
[10] Xin, B.-P., Wu, C.-H., Wu, C.-H., Lin, C.-W., J. Hazard. Mater.2013,244–245, 765–772.
[11] Aivalioti, M., Papoulias, P., Kousaiti, A., Gidarakos, E.,J. Hazard. Mater.2012,207–208, 117–127.
[12] Cavalcante, R. M., de Andrade, M. V. F., Marins, R. V., Oliveira, L. D. M., Microchem. J. 2010, 96, 337–343.
[13] De Nardi, I. R., Zaiat, M., Foresti, E.,Biodegradation2007,
18, 83–90.
[14] Morlett-Ch ´avez, J. A., Ascacio-Mart´ınez, J. ´A., Rivas-Estilla, A. M., Vel ´azquez-Vadillo, J. F., Haskins, W. E., Barrera-Salda ˜na, H. A., Acu ˜na-Askar, K.,Int. Biodeterior. Biodegrad.2010,64, 581–587.
[15] Trigueros, D. E. G., M ´odenes, A. N., Kroumov, A. D., Espinoza-Qui ˜nones, F. R., Process Biochem. 2010, 45, 1355–1361.
[16] De Crom, J., Claeys, S., Godayol, A., Alonso, M., Antic ´o, E., Sanchez, J. M.,J. Sep. Sci.2010,33, 2833–2840. [17] Es’haghi, Z., Ebrahimi, M., Hosseini, M. S., J.
Chro-matogr. A2011,1218, 3400–3406.
[18] Demeestere, K., Dewulf, J., De Witte, B., Van Langenhove, H., J. Chromatogr. A 2007, 1153, 130–144.
[19] Gobato, E. A. A. F., Lanc¸as, F. M.,Qu´ım. Nova2001,24, 176–179.
[20] Men ´endez, J. C. F., S ´anchez, M. L. F., Urı´a, J. E. S., Martı´nez, E. F., Sanz-Medel, A.,Anal. Chim. Acta2000,
[21] Safarova, V. I., Sapelnikova, S. V., Djazhenko, E. V., Teplova, G. I., Shajdulina, G. F., Kudasheva, F. K.,J. Chro-matogr. B2004,800, 325–330.
[22] Ferreira, S. L., Bruns, R. E., da Silva, E. G., dos Santos, W. N., Quintella, C. M., David, J. M., de Andrade, J. B., Breitkreitz, M. C., Jardim, I. C., Neto, B. B.,J. Chromatogr. A2007,1158, 2–14.
[23] Gaujac, A., Emidio, E. S., Navickiene, S., Ferreira, S. L., Dorea, H. S., J. Chromatogr. A 2008, 1203, 99–104.
[24] Lopes, W. A., da Rocha, G. O., de P. Pereira, P. A., Oliveira, F. S., Carvalho, L. S., de C. Bahia, N., dos S. Conceic¸ ˜ao, L., de Andrade, J. B.,J. Sep. Sci.2008,31, 1787–1796.
[25] Aeppli, C., Berg, M., Hofstetter, T. B., Kipfer, R., Schwarzenbach, R. P.,J. Chromatogr. A2008,1181, 116– 124.
[26] ANVISA, Resoluc¸ ˜ao – RE NSˇ 899 – Guia para validac¸ ˜ao de m ´etodos anal´ıticos e bioanal´ıticos, Ag ˆencia Nacional de Vigil ˆancia Sanit ´aria, Bras´ılia 2003.
[27] Slater, G. F., Dempster, H. S., Lollar, B. S., Ahad, J., Env-iron. Sci. Technol.1999,33, 190–194.
[28] Serrano, A., Gallego, M.,J. Chromatogr. A2004,1045, 181–188.
[29] Kubinec, R., Adamu ˇs ˇcin, J., Jurd ´akov ´a, H., Foltin, M., Ostrovsk ´y, I., Kraus, A., Soj ´ak, L.,J. Chromatogr. A2005,
1084, 90–94.
[30] CONAMA,Resoluc¸ ˜ao NSˇ 430 – Condic¸ ˜oes e padr ˜oes de lanc¸amento de efluentes, Conselho Nacional do Meio Ambiente, Bras´ılia 2011.
[31] WHO, Guidelines for Drinking-Water Quality, World Health Organization, Geneva 2011.
[32] Golfinopoulos, S. K., Lekkas, T. D., Nikolaou, A. D.,
Chemosphere2001,45, 275–284.
[33] Jochmann, M. A., Yuan, X., Schmidt, T. C.,Anal. Bioanal. Chem.2007,387, 2163–2174.
[34] Pav ´on, J. L. P., S ´anchez, M. N., Laespada, M. E. F., Cordero, B. M.,J. Chromatogr. A2007,1175, 106–111. [35] Ridgway, K., Lalljie, S. P., Smith, R. M.,J. Chromatogr. A