1
Abstract
Online geographic-databases have been growing increasingly as they have become a crucial source of information for both social networks and safety-critical systems. Since the quality of such applications is largely related to the richness and completeness of their data, it becomes imperative to develop adaptable and persistent storage systems, able to make use of several sources of information as well as enabling the fastest possible response from them. This work will create a shared and extensible geographic model, able to retrieve and store information from the major spatial sources available. A geographic-based system also has very high requirements in terms of scalability, computational power and domain complexity, causing several difficulties for a traditional relational database as the number of results increases. NoSQL systems provide valuable advantages for this scenario, in particular graph databases which are capable of modeling vast amounts of inter-connected data while providing a very substantial increase of performance for several spatial requests, such as finding shortest-path routes and performing relationship lookups with high concurrency.
In this work, we will analyze the current state of geographic information systems and develop a unified geographic model, named GeoPlace Explorer (GE). GE is able to import and store spatial data from several online sources at a symbolic level in both a relational and a graph databases, where several stress tests were performed in order to find the advantages and disadvantages of each database paradigm.
2
Keywords
3
Resumo
As bases de dados geográficas têm crescido a um grande ritmo à medida que se tornam uma fonte crucial de informação tanto para redes sociais ou sistemas de segurança críticos. Como a qualidade de tais sistemas está altamente dependente da riqueza e completude da informação proveniente, torna-se imperativo desenvolver sistemas de armazenamento adaptáveis e persistentes, bem como capazes de ler de várias fontes de informação o mais rápido possível. Este trabalho foca-se em criar um modelo geográfico partilhado e extensível, capaz de receber e guardar informação das maiores fontes de dados geográficas online.
Um sistema de armazenamento geográfico tem também elevados requerimentos de escalabilidade, potência computacional e complexidade de domínio, causando frequentemente grandes problemas a uma base de dados relacional. Os sistemas NoSQL, em particular as bases de dados de grafos têm vindo a oferecer grandes vantagens nestes aspetos, sendo capazes de modelar vastas quantidades de dados interligados, bem como fornecendo um aumento de desempenho substancial ao lidar com cálculos geográficos, problemas de otimização e cálculo de relações – tudo isto a altos índices de concorrência.
Neste trabalho será apresentado o estado atual dos sistemas de informação geográficos, e foi desenvolvido um modelo unificado chamado GeoPlace Explorer (GE). O GE é capaz de importar e guardar dados espaciais provenientes de várias fontes de dados geográficas a nível simbólico tanto numa base de dados relacional como numa base de dados de grafos, onde finalmente foram efetuados vários testes de desempenho de modo a descobrir que vantagens e desvantagens cada paradigma nos oferece.
4
Palavras-chave
5 Contents Abstract ... 1 Keywords... 2 Resumo ... 3 Palavras-chave ... 4 List of Figures ... 7 List of tables ... 8
List of code snippets ... 8
Acronyms ... 10 1-Introduction ... 12 1.1 Problem domain ... 12 1.2 Research questions ... 14 1.3 Methodology ... 15 1.4 Structure ... 15 2-Literature Review ... 16
2.1 Geographical Information Systems ... 16
2.1.1 Advantages ... 17
2.1.2 Evolution ... 18
2.2 Components... 19
2.3 Online Geospatial Databases ... 19
2.3.1 Factual ... 20 2.3.2 GeoNames ... 21 2.3.3 OpenStreetMap ... 22 2.3.4 LinkedGeoData ... 23 2.4 Crowdsourcing ... 24 2.4.1 Reliability ... 27 2.5 Interoperability ... 28
6
3-NoSQL Fundamentals and Neo4J overview ... 31
3.1 The NoSQL movement ... 31
3.2 Graph database fundamentals... 33
3.2.1 Graph theory ... 33
3.2.2 Graph databases ... 35
3.3 The Neo4J datastore ... 36
3.3.1 Cypher query language ... 39
3.3.2 The Neo4JPHP wrapper ... 40
4 - Geoplace Explorer ... 45
4.1 The symbolic world model ... 45
4.2 Environment configuration ... 47
4.2.1 Neo4J Server configuration ... 48
4.2.2 API dependencies ... 49 4.3 Application Architecture ... 50 4.4 Implementation ... 51 4.4.1 Authentication ... 51 4.4.2 Node manipulation ... 52 4.4.3 Relationships ... 54
4.4.4 API data insertion and importing ... 56
5- Tests ... 58
5.1 Test specifications ... 58
5.2 Environment ... 58
5.2.1 Gatling for Neo4J ... 59
5.2.2 Mysqlslap... 60
5.3 Test results ... 62
7
5.3.2 Low concurrency property node lookup ... 64
5.3.3 Single relationship lookup ... 65
5.3.4 Multiple relationship lookup... 68
5.3.5 Shortest path operation (Neo4J spatial extra) ... 69
5.4 Measurements... 70
5.4.1 Objective measurements ... 70
5.4.2 Subjective measurements ... 72
6- Conclusion and future work ... 74
References: ... 77
List of Figures
Figure 1 - Symbolic and Geometric layers in ArcMap ... 22Figure 2 - LinkedGeoData’s architecture, from low to high level entities. ... 24
Figure 3 - Positioning of the correction layer. ... 26
Figure 4- A simple directed labeled graph ... 34
Figure 5 - An example of graph morphism. Several characteristics can be added to a graph to better express our domain. ... 34
Figure 6 - The main differences in representing data for both a relational (left) and graph model (right) [55]. ... 35
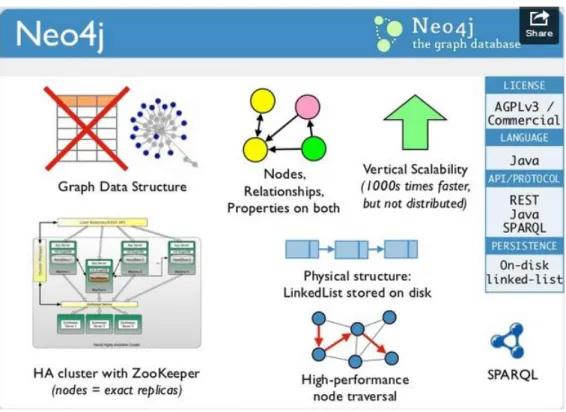
Figure 7 - Quick overview of Neo4J’s graph database advantages. ... 37
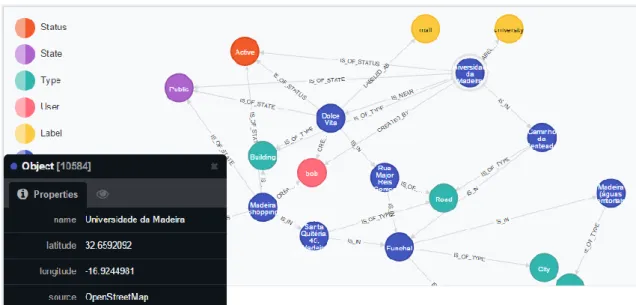
Figure 8 - A simple graph representation in Neo4J. ... 38
Figure 9- A simple overview of the symbolic model. ... 45
Figure 10 - Entity Relation model for Geoplace Explorer. ... 46
Figure 11 - Simplistic view of the graph model for Geoplace Explorer. ... 47
Figure 12 – GeoPlace explorer architecture diagram... 51
Figure 13 - Login screen. ... 52
Figure 14 - Node creation page ... 53
Figure 15- Node deletion page. ... 53
8
Figure 17 - Delete relationship page. ... 55
Figure 18 - API insertion page. ... 56
Figure 19 - Response time results for Neo4J... 62
Figure 20 - Transactions per second results for Neo4J. ... 63
Figure 21 - MySQL test 1 results... 64
Figure 22 - Results from the second test in Neo4J ... 65
Figure 23 - Test case results for MySQL property node lookup. ... 65
Figure 24 - Results from the third test in Neo4J (response times). ... 67
Figure 25 - Results from the third test in Neo4J (response times distribution). ... 67
Figure 26- Test results for the 3rd test in MySQL. ... 67
Figure 27 - Neo4J results for the final test. ... 69
Figure 28 - Neo4J spatial data layout (left) and OSM map used for testing (right) ... 69
List of tables
Table 1- Main differences between SQL and NoSQL databases. ... 31Table 2 - Description of each type of NoSQL database... 32
Table 3 - Main operations in Neo4JPHP. ... 42
Table 4- Simulation results for MySQL and Neo4J using GeoPlace Explorer data... 70
List of code snippets
Code snippet 1- Example factual query. ... 21Code snippet 2 - GeoNames query that returns all places named ‘Funchal’. ... 22
Code snippet 3 - PHP code using Neo4JPHP internal commands. ... 43
Code snippet 4 - The same graph created in Cypher queries. ... 43
Code snippet 5 - Neo4JPHP bootstrap settings file. ... 49
Code snippet 6 - Username and password verification. ... 52
Code snippet 7 - PHP code for SQL node insertion ... 54
Code snippet 8 - Mass import algorithm. ... 57
Code snippet 9 - Placename insertion in Cypher ... 57
9
Code snippet 11 - Syntax for a custom query simulation. ... 60
Code snippet 12 - SQL script used to populate the database. ... 61
Code snippet 13 - Empty root node operation in Scala... 62
Code snippet 14 - Command line test parameters used for test 1 on MySQL. ... 63
Code snippet 15 - Scala test file for the property node lookup test. ... 64
Code snippet 16 - Test case for MySQL property node lookup. ... 65
Code snippet 17 - Scala configuration file for Neo4J test 3. ... 66
Code snippet 18- SQL query to find relationships of depth = 1. ... 67
Code snippet 19 - Depth 3 relationship (Cypher | SQL). ... 68
10
Acronyms
ACID – Atomicity, consistency, isolation, durability API – Application programming interface
CAP – Consistency, Availability, Partition tolerance theorem CPU – Computer processing unit
DB – Database GB – Gigabyte
GE – Geoplace Explorer
GIS – Geographic Information System GPL – General public license
GPS – Geographic Position System GUI – Graphical user interface HTML – Hypertext markup language IDE – Integrated Development Environment LGD – LinkedGeoData
MB - Megabyte
NoSQL – Not Only SQL
OGC – Open Geospatial Consortium
OGDI – Open Geographic Datastore Interface OSM – OpenStreetMap
PHP – PHP Hypertext Processor RAM – Random Access Memory
11 RDBMS – Relational database management system
RDF – Resource description framework (metadata data model) REST – Representational State Transfer (architectural style) SPARQL – sparkle query language
SQL – Structured Query Language
UNIX – Uniplexed Information and computing service XML – eXtensible Markup Language
12
1-Introduction
Geography has always been important to the human race. Stone-age hunters anticipated the location of their target, early explorers lived or died by their knowledge of geography, and current societies work and play based on their understanding of who belongs where. Applied geography, in the form of maps and spatial information, has served discovery, planning, cooperation, and conflict for at least the past 3000 years of our history [5].
If someone would describe a scenery, it is likely the person would categorize it into streets, fields, trees, buildings or rivers and give geographical references like 'adjacent to' or 'to the left of' to describe the location of the features. Such references can be simple or detailed, but in the end they are merely an interpretation of that person’s own interests, never fully representing every aspect of reality and often inconsistent in terminology among sources. With the current pace of technology, there have been a multitude of solutions to store geographic data in its most symbolic forms, ranging from proprietary sources to extensible open-source editable maps. These tools are often called ‘Geographic Information Systems’, or GIS for short. As the number of geographic points and connections between these increases, the complexity begins to scale up exponentially, creating a need for powerful data representation and manipulation systems as well as new ways to integrate them with existing databases.
1.1 Problem domain
Geographic databases have been part of a growing industry in the past decade, and have had a vital role in many applications, such as geographically-aware search systems, route planners or recommendation systems. However, even with the latest advances in crowdsourcing and neo-geography, there is still a lack of a unified ontology that allows for automated sharing and retrieval between sources [8],[10],[13]. Since the quality of such applications is critically related to the richness of resources it becomes an important task to create powerful abstractions, able to integrate different geographical relationships between domains, or merge identical concepts into the same domain. This domain needs to be both consistent and broad enough to cover all types of geographical attributes present in all previous sources. A well-defined model is crucial
13 for this kind of system, facilitating its reuse and later extension. Such model should contain the following features:
a) Support for generic data and property sets [31]
As the number of sources increases, the more different types of data must be dealt with, particularly of different kinds such as symbolic or geometric sets. Since many sets of information are likely to be present in one source but not in another, this leads all major classes to be extensible, generic and flexible in its meta-model;
b) Control and lineage of information sources [31]
In the world of GIS, it is important to keep track both of spatial and chronological changes as well as its authors;
c) Effective tools for data analysis
Geographical queries can often give us answers by finding interesting patterns across millions of nodes. This requires advanced tools in the fields of data management, analysis and output that can quickly calculate and deliver relevant data. However, geographical queries can be extremely taxing in terms of computational cost, so it’s important to ensure that our system is able to handle requests as quickly as possible.
On the other hand, systems of this nature also tend to be both complex in structure and sizeable in terms of stored data. For several decades, the most common data storing model has been the relational model, which is implemented under relational database managing systems (RDBMS), with the common ‘relational database’ term being often used in its place. While powerful, RDBMS also have important limitations that can hinder the growth and manipulation of large sets of data. Such limitations can include:
a) Up-scaling
Whenever a relational database needs more storage, it must be loaded on a more powerful computer. When it does not fit a single computer, it needs to be distributed across multiple computers but relational databases are not designed to
14 function with distributed systems, resulting in a decrease of performance when combining multiple tables;
b) Schema-less data
It is often difficult to fit schema-less data into relational databases, and this is often a problem when trying to combine several sources of data. RDBMS are substantially more effective when manipulating simple, structured data, but other alternatives can provide interesting results.
This thesis will focus on creating a unified world model, able to support several data structures and will also explore new possibilities in terms of data storage with a non-relational DBMS approach.
1.2 Research questions
The problem description above leads us to the following research question: How do relational and NoSQL datastores compare in terms of
performance to support an integrated system receiving input from several geographical sources?
This thesis aims at developing an integrated spatial model, able to acquire results from both manual input as well as from several online geographical databases. This spatial model is then stored in two different datastores (relational and NoSQL), where a series of stress tests is performed to compare the two alternatives.
This thesis presents the following deliverables:
I. Design and implementation of both relational (MySQL) and graph (Neo4J) database models for an identical data set;
II. PHP based implementation to manually insert, update or import sets of data from several online geographical databases (Factual, GeoNames and OpenStreetMap) into both databases;
III. Scientific reports for all related literature research, as well as development and documentation for the proposed implementation, also covering an analysis on performed tests.
15 1.3 Methodology
In short, this research started by presenting an overview of the current geographical information systems, the features they offer as well as their progress, state of the art and limitations. Next, we analyze several different online geospatial databases, how they store and organize data and present the strengths and weaknesses of each other. The following step focused on finding new ways to model such data by using a different approach to relational databases. We then performed a quick study about NoSQL systems in general, with particular emphasis in graph databases which seemed to adapt to our problem more fluidly. After choosing an appropriate solution (Neo4J), we then explore its implementation possibilities to create a web application, able to retrieve, model and consolidate spatial data gathered from geographical sources into both relational and graph models. The final step consisted in performing several stress tests to find out and discuss which advantages each different approach brings to our problem.
1.4 Structure
This thesis consists of 5 chapters organized in the following fashion:
1. Chapter 2 describes the current state of geographical location systems, their main advantages and limitations and how they can be more effectively represented, shared and accessed from one database to another;
2. Chapter 3 of this work describes some of the current NoSQL databases, and how they can be used to model sets of spatial data. A small introduction to Neo4J is presented, as well as its own graph query language (cypher);
3. Chapter 4 documents all implementation aspects (class model, dependencies, wrappers, …) for our application, a simple GUI in PHP to manually insert as well as import and integrate data from several online geographical databases; 4. Finally, chapter 5 describes all tests performed with our dataset, and compares
them with previous tests made to large sums of spatial data with the intent to benchmark performance between each database system used in the project.
16
2-Literature Review
In this chapter we will present a brief overview of online geographical databases, their evolution in the past years, the advantages they brought in several domains and their current state of the art. Some practical examples will be provided and certain tools will be analyzed in more detail. We conclude by exploring several projects that improve the data gathering process and the limitations they face.
2.1 Geographical Information Systems
A geographical information system (GIS) is a technology for performing spatial analysis and building all kinds of geographical maps [1], which are organized in layers and represent physical elements trough nodes, lines and polygons. GIS and spatial analyses are concerned with the measurable location of important features, as well as properties and attributes of those features. These systems let us visualize, question, analyze, interpret and understand data to reveal relationships, patterns and trends [2]. GIS offer us a new way to look and explore the world around us. Accurate geographical mapping allows for several benefits, such as better decision making in several areas (real estate selection, traveling), improved communication, better recordkeeping for organizations as well as increased efficiency for terrestrial movements.
Such information systems can also be used for integrating, storing, editing, analyzing, sharing and displaying all kinds of geographical information. The first known use of the term "Geographic Information System" was by Roger Tomlinson in the year 1968 in his paper "A Geographic Information System for Regional Planning". Tomlinson is also acknowledged as the "father of GIS".
GIS are usually composed of four stages:
1. Data input from maps, aerial photos, satellites, surveys and other sources; 2. Data storage, retrieval and query;
3. Data transformation, analysis, and modeling including statistics; 4. Data reporting such as maps or plans [4].
17 GIS, with its array of functions, should be viewed as a process rather than as merely software. One of the main purposes is to facilitate the decision-making progress. The way in which data is entered, stored, and analyzed within a GIS must mirror the way information will be used for a specific research or task [1,3]. In other words, a GIS is both a database system with specific capabilities for spatially-referenced data, as well as a set of operations for working with data. In a sense, a GIS may be thought of as a higher-order map.
2.1.1 Advantages
The main appeal of GIS stems from their ability to integrate and share great quantities of information about the environment and to provide a powerful repertoire of analytical tools to explore this data. The ability to separate data in layers, and then combine it with other layers of information is the reason why GIS hold such a great potential as research and decision-making tools. [1] Delivering a common data view to agencies, process partners and stakeholders improves communications across organizations, leading to improved decision making and efficiency.
GIS have also emerged as very powerful technologies because they allow geographers to integrate their data and methods in ways that support traditional forms of geographical analysis, such as map overlay analysis as well as new types of analysis and modeling that are beyond the capability of manual methods. With GIS it is possible to map, model, query, and evaluate large quantities of data all held together within a single database. Not only it becomes a consolidated approach to data retrieving, storing and visualization, but it also expands across several areas, such as cartography, surveying, civil engineering and demography [5]. Several systems already combine information regarding transportation networks, hydrography, population characteristics and economic activity – all of these can be useful for urban planning, environmental resource management, emergency planning or transportation forecasting [30].
GIS-based maps and visualizations greatly assist in understanding situations and prediction. They are a type of language that not only improves communication between different teams and departments [3], but can also cut down costs in evaluation and record-keeping activities.
18 2.1.2 Evolution
Web mapping systems have gained substantial popularity in the last 15 years, and have been rapidly expanding since the release of OpenStreetMap back in 2004, followed by Google Maps in 2005, Wikimapia in 2006 and Microsoft Silverlight in 2007. Latest releases include improved navigation, Google Fusion Tables, Google Maps Mobile and Wikitude Drive (2010) [2,11].
It is important to note that map coverage did not only become more widespread in recent years, it has also became significantly more accessible (and collaborative) to the average user. Early maps that were restrained to commercial and data providers via satellite images rapidly expanded to the combination of road networks, panoramic street-level imagery such as Google Street View and massive collaborative systems such as OpenStreetMap. Geographical Information Systems represent a jump from paper maps like the computer from the abacus [23]. Within the last thirty years, GIS technology has evolved from single purpose, project based applications to massive enterprise systems [36]. Such systems are currently being used by businesses, institutions, industry, local governments and the private sector to provide services to clients, manage resources, and to address multiple issues concerning to health and human resources, transportation, public safety, utilities and communications, natural resource, defense and intelligence, retail and many more.
With such a development, new concepts and technologies have arisen over the years. 3D Desktop applications, detailed and interchangeable layers, public data, map makers, map integration with social networks and mobile mapping have also appeared. The existing services have attracted several millions of users, both desktop and mobile. The scope of web mapping applications has widened from purely easy to use consumer-oriented tools to highly specialized applications with GIS functionalities that help solving and optimizing problems in several domains. Despite the advances of web mapping within the last few years, there is still a lot of potential to collaborate, to elaborate, to tell stories with creative new methods and to use the data in useful and interesting new ways [11].
19 2.2 Components
A GIS is comprised of hardware, software, data, humans, and a set of organizational protocols. These components must be well integrated for effective use of GIS, and the development and integration of these components is an iterative, ongoing process [5]. Hardware for GIS usually requires a fast computer due to how often spatial analyses are applied over large areas or at high spatial resolutions. This means that even simple operations can take a long time to compute as they have to be repeated tens of millions of times. Another important aspect is the storing of large volumes of information. GIS software provides the tools to analyze, calculate and display the spatial information. This encompasses functions such as data entry (manual or digital coordinate capture), data management (subsets, merging data, indexing, data projection), data analysis (spatial queries, interpolation, connectivity, proximity, buffering) and output (map design and layout, digital map serving, metadata output or digital graphic production).
There are several available GIS software packages, such as ArcGIS, GeoMedia, AutoCAD Map, QGIS and GRASS, however these are out of scope for this work and will only be mentioned briefly when relevant.
2.3 Online Geospatial Databases
Presently, vast quantities of geospatial data and information at local, regional and global scales are being continuously collected, created, managed and used by academic research, the public for spatial decision support and location based services [37]. A key aspect to any geospatial solution is to support efficient data maintenance and analysis in a heterogeneous operating environment. This requires highly scalable, highly available and secure database management systems. One of the biggest challenges is integrating time into database representations, another is integrating geospatial data sets from multiple sources (often with varied formats, semantics, precision and coordinate systems) [38].
Current GIS, which are optimized to store and query data that represents objects defined in a geometric space, often utilize online geospatial databases as sources of their data. Most spatial databases allow representing simple geometric objects such as points, lines and polygons [24] and can operate with varied data structures, queries, indexes and algorithms. These can support several operations such as spatial measurements
20 (computing line length and distances between geometries), spatial functions, geometry constructors and observer functions (queries which return specific information regarding features such as the location of the center of a circle). They also allow remote querying of results via an API or even integration with other existing geo databases (such as the LinkedGeoData initiative).
Some examples of online geodatabases include OpenStreetMap’s project [44], the GeoNames project [28], and Factual [26]. The main difference between these is that OSM and GeoNames are both open-source projects, accepting data from thousands of users while Factual usually only maps out missing attributes or adds new ones. OSM features the largest collection of data (over 1 billion nodes), which surpasses other services in this regard.
2.3.1 Factual
Factual, launched in October 2009, is an open data platform developed to maximize data accuracy, transparency, and accessibility. It provides access through web service APIs and reusable, customizable web applications [25]. Factual features data sets about local place information, entertainment and information derived from government sources. At the current date and according to their website, Factual contains over 65 million places of data, which are updated and improved in real-time by Factual’s data stack. Factual’s API allows for remote access to stored data, through the use of queries. Access to the API server must be requested first with an oauth API key and secret, and has existing frameworks for several programming languages such as C#, Java, PHP, Phython and Ruby. Results can also be obtained through HTTP GET requests. It is possible to query several types of information, such as text searches, interest points, direct and reverse geocoding, geo filters, data submission and matching queries with provided information [26]. It can also clean and resolve data as results are submitted into the database, and afterwards connects it to other sources of factual data, or external sites (such as Facebook or Twitter) relating to the same coordinates, and further enhances this by delivering contextually relevant content, experiences and ads based on where mobile users are located.
A brief example on how to implement a factual API call is provided in Code snippet 1. It is important to create an authenticated handle to Factual so it can configure
21 class loading on instantiation. The query displays all nearby points of interest near the University of Madeira, sorted by distance.
2.3.2 GeoNames
GeoNames is another global geo-database initiative. According to their website [27], the GeoNames database contains over ten million geographical names corresponding to over 7.5 million unique features. All features are categorized into one out of nine feature classes and further subcategorized into one out of 645 feature codes [28]. Beyond names of places in various languages, data stored includes latitude, longitude, elevation, population, administrative subdivision and postal codes. However, implementing its own semantics schema can be a barrier to future interoperability with other geospatial databases and sources of information [8]. It operates on a low level, semantic schema with no set of constraints on the domain and range of attributes, which can be a barrier to the consistency of the data set. GeoNames also features a functional API call server, which allows for querying of information on a programming level in several programming languages (such as C# or PHP). Results can be returned via XML or JSON objects. GeoNames API allows for full-text based searches, postal code search, placename lookup, nearby postal codes, reverse geocoding, nearby populated places as well as providing other services such as recent earthquakes or weather status lookup [29].
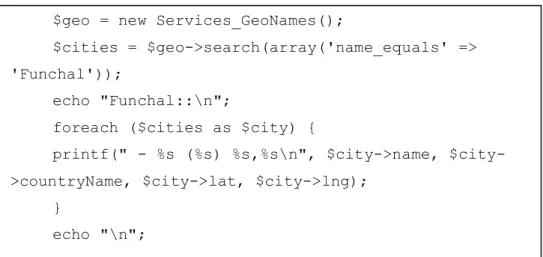
For example, the query in Code snippet 2 retrieves all locations named ‘Funchal’, as well as their coordinates and corresponding country from a text search:
$query = new FactualQuery;
$query->within(new FactualCircle(32.659936, -16.926097, 1000)); //5 km radius
$query->limit(10); $query->sortAsc("\$distance"); $res = $factual->fetch("places", $query); print_r($res->getData());
$res = $factual->reverseGeocode(-16.926097,32.659936); print_r($res);
22 2.3.3 OpenStreetMap
OpenStreetMap (OSM) is a collaborative geospatial project that aims at creating a free editable map of the world created by Steve Coast in UK in 2004. Since that point, it has experienced a growth up to 1 million users (on 2013) who collect all kinds of high quality data in various ways, such as GPS devices, aerial photos, sea travels [33], and government files. Like most internet projects, most users are casual or inactive, with a small dedicated minority contributing the majority of additions and corrections to the map. The database now contains over 1 billion nodes, 21 million miles of road data and 78 million buildings [34]. OSM features a dynamic map where every urban or natural feature is built by the community, resulting in accurate, high quality data representations [13].
$geo = new Services_GeoNames();
$cities = $geo->search(array('name_equals' => 'Funchal'));
echo "Funchal::\n";
foreach ($cities as $city) {
printf(" - %s (%s) %s,%s\n", >name, $city->countryName, $city->lat, $city->lng);
}
echo "\n";
Figure 1 - Symbolic and Geometric layers in ArcMap.
23 The OSM project facilitates complete, regularly-updated copies of its database, which can be exported and converted to several GIS application formats through various frameworks. The data is stored in a relational database (Post-greSQL backend) which can be accessed, queried and edited by using a REST API, which uses HTTP GET, PUT and DELETE requests with XML payload. Data collection is acquired by GPS traces or by manual map modeling. Figure 1 shows a representation of OSM’s symbolic data gathered from the XAPI and converted to ArcMap featuring the peripheral zone of University of Madeira.
OSM uses a topological data structure with four data primitives: nodes (geographical positions stored as coordinates), ways (orders lists of nodes) which can represent a polygon, relations (multipurpose data structure that defines arbitrary relationships between 2 or more data elements [45]) which are used to represent turn restrictions in roads, and tags (arbitrary metadata strings) which are mainly used to describe map objects. Each of these entities has a numeric identifier (called OSM ID) and a set of generic attributes defined by tags. For example, the natural tag describes geographical features which occur naturally, which has a wide set of values {bay, beach, save entrance,…wetland, wood} [13] Further tags are used to specify time zones, currencies [32] and alike.
According to previous studies [12], the volunteered geographical information submitted to OSM is fairly accurate, with more than 80% of overlap between other specialized datasets, and often with more correct references in several countries around the world.
2.3.4 LinkedGeoData
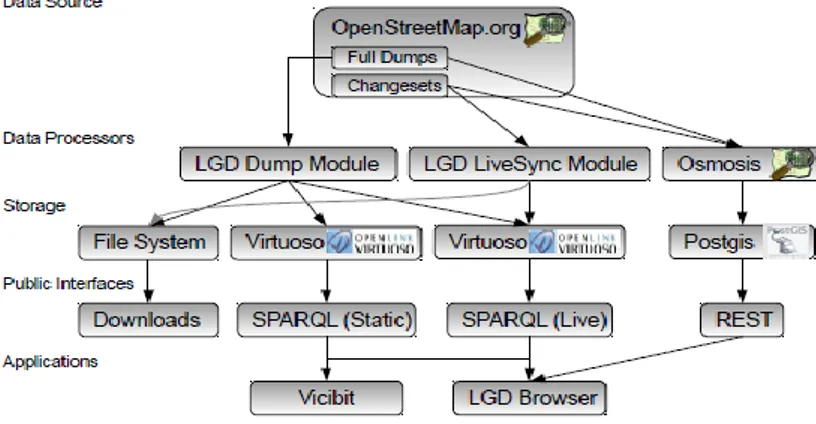
LinkedGeoData is an effort to add a spatial dimension to the Semantic Web. It utilizes the information collected by the OpenSteetMap project and makes it available in RDF knowledge. [35] The Semantic Web eases data and information integration by providing an infrastructure based on RDF ontologies, which are interactively transformed from OSM’s data. This procedure is believed to simplify real-life information integration that require comprehensive background knowledge related to spatial features. [32] LinkedGeoData offers a flexible system for mapping data to RDF format, improved REST interface and direct interlinks to GeoNames and other geospatial data projects. Figure 2 presents an overview of LinkedGeoData’s structure:
24 The data acquired from OSM is processed in different routes. The LGD Dump Module converts the OSM planet file into RDF and loads the data into a triple store. This data is then available via the static SPARQL endpoint. The LGD Live Sync Module monitors and loads change sets to the RDF level in order to update the triple store accordingly. The Osmosis is a community developed tool, which supports setting up such a database from a planet file and applying change sets to it. For data access, LGD offers downloads, a REST API interface, Linked Data and SPARQL endpoints [32]. The REST API provides limited query capabilities about all nodes of OSM.
LGD does not only contain linked data to OSM, but to other data services as well. It currently interlinks data with DBPedia and GeoNames [32], which is done on a per-class basis, where all instances of a set of per-classes of LGD are matched with all instances of a set of classes of other data sources using labels and spatial information. Since a vast amount of data is changed on OSM every few minutes, several filtering and synchronization procedures are used to ensure the data is kept relevant. Converting relational databases to RDF is also a significant area of research that LDG heavily depends on. These enhancements may further contribute to new semantic-spatial search engines to enable more linked data applications, such as geo-data syndication. However, certain limitations are still in the way of a more robust and scaling service, such as a lack of aggregating ontologies between OSM and the filtering system.
2.4 Crowdsourcing
A recent trend in neogeography has emerged by complementing information to geo-databases via several outside sources, namely social networks [9], shared media websites, and user’s GPS contributions, known as volunteered geographical information
25 (VGI). The potential of crowdsourcing is that it can be a highly exploitable activity, in which participants are encouraged to contribute to an alleged greater good. For example in Wikipedia, well over 99.8% of visitors to the site do not contribute anything [12], yet this does not deter the contributors from doing most of the work
Since geo spatial databases typically contain vast amounts of data, it is important to create mechanisms that can assist and verify the user-generated data submissions, which aim at improving internal data quality and resolving data conflicts between sources. These conflicts can be identified at the syntax (representation), structure (inconsistency), semantic (ambiguity) and cartographic (accuracy) levels [7].
Crowdsourcing in GIS brings the following advantages:
- Make datasets accessible by non-proprietary languages and tools;
- Introduce formal semantics to make data machine learning processable, so the process can be automated between sources;
- Enrich existing data with other sources in a combined way, therefore increasing location precision;
- Allow cross-referencing and querying of multiple data sources simultaneously;
- Automatically detect on-going events and new places of interest from media and social networks.
However, there are still several obstacles in this approach: data conflicts must be carefully managed, and proper conversion methods must be employed to ensure consistency (e.g different names and tags for the same places in different sources), as well as other mechanisms to verify data integrity from user submissions (data validation). Outdated sources of information must also be filtered. A layer structure by M-PREGeD has been proposed [7] to improve data quality by involving the users in the selection process. This practice adopts the use of shared vocabularies and links to help increase semantic consistency and accessibility among sources of data.
In this case, results are stored in a local database and further enriched with matching Linked Geo Data nodes, which are verified and corrected by the Linked
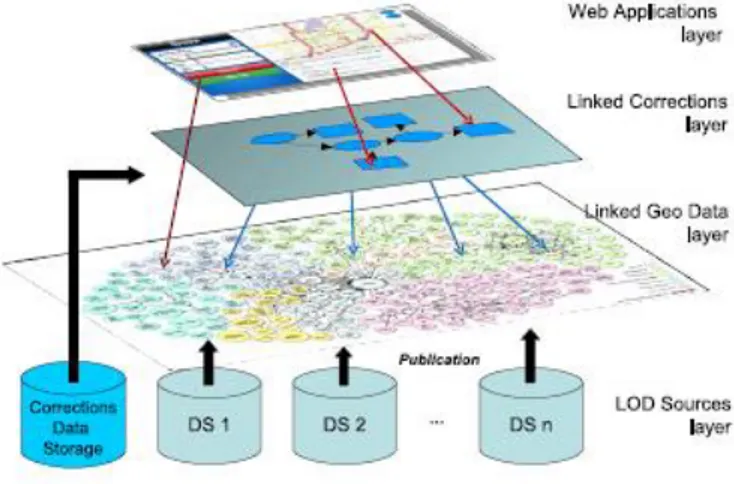
26 corrections layer, and only after that become available to the web applications layer. The user-generated matches are acquired by several applications, such as UrbanMatch [7] which is a game with a purpose for matching points of interest and photos, running on mobile geo-located services. The player is given a set of photos and is asked to match them with each location. The output is gathered from the players, verified and correlated and finally used to generate trusted links. A high number of similar answers are used to identify patterns of information and determine the accuracy of provided data. This process can be defined in 3 layers: the linked geo data layer which contains unprocessed data from several sources, the linked connections layer that is composed of all verification methods, such as the UrbanMatch game. Finally, this data is submitted to the web applications layer to the general audience. Figure 3 illustrates this design.
Figure 3 - Positioning of the correction layer. .
Another process is done by analyzing metadata and tags from photos over different social media websites (such as Flickr and Twitter), by discovering associations between the media and the owner’s geographical position, and is also possible to populate geo-sets with news data collected from other sources by employing extraction and retrieving systems [39].
These experiments not only help increase spatial accuracy for existing places, but can also be used to discover new points of interest. Conflicts can be detected and resolved by automatic procedures, and expanding these techniques is an on-going
27 process, especially when certain errors can occur [9] due to old or mislabeled data, incorrect semantic relationships, or simply by geographic evolution overtime. For example, there is a high correlation between places of interest like restaurants and a number of photos containing tags such as “food”, “dinner” and “eating” being uploaded on the same location. This quantitative evaluation consists of very specific statistical and data mining methods with several levels of precision. In recent studies [9] several new places in London were found with the help of these methods that were not present in GeoNames or Foursquare. Since different database providers (e.g Geonames, Foursquare) are constructed in different ways, this procedure takes into account how different places are submitted and represented internally, and tries to aggregate similar results into a location vector, which creates a classifier that calculates the likelihood that a given location contains a place in particular. Closer examinations detected conflicts or mislabeled data such as misleading Tweets and incorrect or semantically ambiguous tags, and this allows excluding potential outliers based on standard deviations in the dataset. This method was able to find new places of worship, schools, shops, restaurants and graveyards that were not yet present in LinkedGeoData and GeoNames. With finer iteration it becomes possible to detect new places of interest with higher precision, such as extending OpenStreetMap to indoor environments [14]. This approach aims at increasing the detail of geo data by adding new tags to inner structures, such as airports, museums or train stations by employing a 3D building ontology. Again, such data is likely to be supplied voluntarily by individuals at those places of interest. This kind of non-profit projects greatly enhances user participation.
2.4.1 Reliability
The proliferation of information sources as a result of networked computers has prompted significant changes in the amount, availability, and nature of geographic information. Among the more significant changes is the increasing amount of readily available volunteered geographic information (VGI), which is produced by millions of users. However, as many of these results are not provided by professionals but by amateur users, and therefore do not follow the common standards in terms of data collection, verification and use, this creates an issue which is very frequently discussed and debated in the context of crowdsourcing activities. Several studies [12, 40, 41 ,42]
28 have analyzed the systematic quality of VGI in great detail, and claim that for the most part results can be fairly accurate compared to other private or governmental entities, and represent the move from standardized data collection methods to data mining from available datasets.
Evaluating the quality of geographical information has received the attention of surveyors, cartographers and geographers many years ago, which have carefully deliberated a number of quality standards [12]:
a) Lineage: the history of the dataset
b) Positional accuracy: how well the coordinate of an object is related to reality c) Attribute accuracy: how well an object is represented with tag attributes d) Logical consistency: the internal consistency of the dataset
e) Completeness: measuring the lack of data for a particular object
f) Semantic accuracy: making sure an object’s representation is correctly interpreted
g) Temporal quality: the validity of changes in the database in relation to real-world changes and also the rate of update
Several methodologies were developed to quickly determine the data quality, from statistical comparison (using average standard deviation between different databases to calculate positional accuracy, object overlap percentages, tile boards, road length comparison among maps [42] and spatial density among urban areas to more empirical methods (visual density representations, road comparison). The results state that there is an approximate overlap of 80% of motorway objects, roughly located within about 6m of distance recorded between OpenStreetMap and other proprietary map types in London, as well as less than 10% of total road length difference between OSM and TeleAtlas [42].
2.5 Interoperability
The growth of geospatial industry is stunted by the difficulty of reading and transforming suitable spatial data from different sources. Different databases have unalike conventions, classes, attributes and even entirely different semantic structures,
29 which makes it difficult to interconnect and correlate data from different sources into heterogeneous data [15]. As billions of dollars are invested worldwide in the production of geospatial databases, it becomes imperative to find other alternatives for data translation and open, collaborative frameworks. As most GIS use their own proprietary format, translating this data into other formats can be a time consuming and inefficient process. Transformations between formats can also result in loss of information because different formats support different data types. Data translation also takes up a large amount of secondary storage and can be costly to develop. Other providers sometimes restrict access by repackaging products for a particular GIS.
As such, there have been several solutions in the past to alleviate the issue, such as object oriented open frameworks and open architectures. Some examples are OGIS (Open GIS consortium) and DGIWG (Digital Geographic Information Working Group).
Other approaches consist in interpreting other formats through the use of a universal language (such as OGDI, the Open Geospatial Datastore Interface). As the translation process is a long and difficult progress, OGDI is based on reading different geospatial data formats directly, without translation or conversion [10]. In essence, it works as a comprehension tool instead of translation. This allows for different formats to be queried from a uniform data structure, as well as transparent adjustment of coordinate systems and cartographic projections. Such data structures can be implemented via simple object oriented concepts, such as point features instantiating a coordinate, line features being composed of 2 or more coordinates in the same directional vector, and area features consisting of several line features forming a closed ring. This transient vector structure is the backbone of the retrieval functions, and allows for transparent adjustments and understanding of multiple coordinate systems. OGDI also uses an API which can validate parameters and sequences, transform coordinates and projections and provide an entry point to OGDI functions for each driver.
In this chapter we have presented the main advantages as well as obstacles present in the world of neo-geography. Geographic representations can be either symbolic (categories and arbitrary distinctions between objects) or geometric (where the data tries to emulate spatial features as accurately as possible). As seen above, it is of
30 particular interest to develop more advanced crowdsourcing and interoperability methods in order to obtain and maintain larger amounts of data.
31
3-NoSQL Fundamentals and Neo4J overview
In this chapter, we will present an overview of current NoSQL databases and compare the underlying strengths between each other to choose the most fitting solution (Neo4J) and describe its basic functionalities as well as its own query language (Cypher).
3.1 The NoSQL movement
“As the popularity of data virtualization continues to rise, companies are increasingly relying on data storage and retrieval mechanisms like NoSQL to extract tangible value out of the voluminous amounts of data available today.” [52]
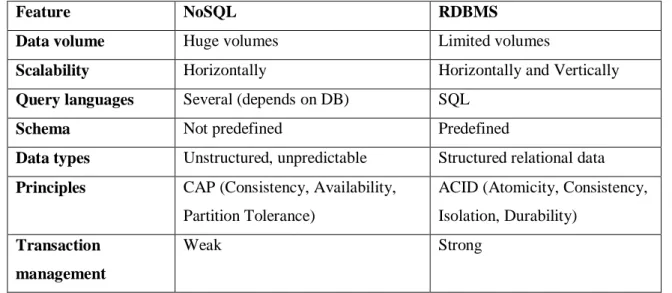
Many different kinds of data models are labeled as ‘NoSQL’, which stands for not-only SQL. This provided a mechanism for both storage and retrieval that is modeled in a different way compared to relational databases management systems (RDBMS). NoSQL databases are becoming increasingly popular in big data and real-time web applications [44], such as Google’s BigTable and Facebook’s Cassandra as they are designed to support different principles than its relational counterpart [47], such as horizontal scaling (adding more nodes to a system), ability to work with schema-less data or better control over availability. Full transactional guarantees and simultaneous completion of transactions are not always provided by NoSQL databases, however this is prioritized over data availability instead (by internal synchronization) [52]. The following table 1 presents the main differences between NoSQL and RDBMS:
Feature NoSQL RDBMS
Data volume Huge volumes Limited volumes
Scalability Horizontally Horizontally and Vertically
Query languages Several (depends on DB) SQL
Schema Not predefined Predefined
Data types Unstructured, unpredictable Structured relational data
Principles CAP (Consistency, Availability, Partition Tolerance)
ACID (Atomicity, Consistency, Isolation, Durability)
Transaction management
Weak Strong
32
.
However, NoSQL systems tend to be highly specialized solutions, often creating a compromise between other existing features in an SQL environment (such as true ACID* transactions or consistency in favour of partition tolerance [45]). Normally, NoSQL systems are only employed when a RDBMS approach fails to meet their intended requirements.
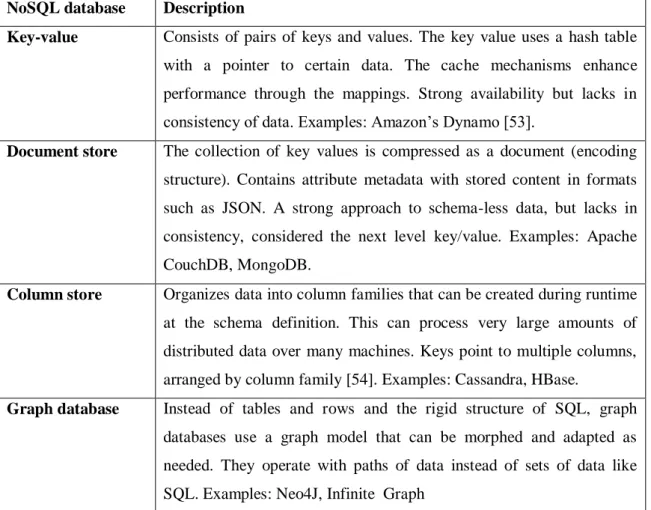
NoSQL databases can operate with several types of data [52]. These can either be a Key-Value store (a large hash table of keys and values), Document-based store (stores documents made up of tagged elements), Column-based store (each storage block contains data from only one column) and finally Graph-based storage, where a network database uses edges and nodes to represent and store data. Table 2 presents an overview of each different database.
NoSQL database Description
Key-value Consists of pairs of keys and values. The key value uses a hash table with a pointer to certain data. The cache mechanisms enhance performance through the mappings. Strong availability but lacks in consistency of data. Examples: Amazon’s Dynamo [53].
Document store The collection of key values is compressed as a document (encoding structure). Contains attribute metadata with stored content in formats such as JSON. A strong approach to schema-less data, but lacks in consistency, considered the next level key/value. Examples: Apache CouchDB, MongoDB.
Column store Organizes data into column families that can be created during runtime at the schema definition. This can process very large amounts of distributed data over many machines. Keys point to multiple columns, arranged by column family [54]. Examples: Cassandra, HBase.
Graph database Instead of tables and rows and the rigid structure of SQL, graph databases use a graph model that can be morphed and adapted as needed. They operate with paths of data instead of sets of data like SQL. Examples: Neo4J, Infinite Graph
33 Graphs are a natural solution to several of our everyday problems, especially when dealing with a high number of interconnected data, complex geographical queries, hierarchical data recommendation systems and shortest-path operations. They facilitate the usage of schema-less data and can scale up to several billions of nodes per machine. Unlike document and column stores, they are also able to maintain a consistent state in the database as every kind of relationship is stored physically and not sorted by arbitrary categories.
3.2 Graph database fundamentals
This section will describe the fundamentals behind graph operations, the underlying model for graph databases. A brief explanation of their data structures and basic operations will be presented, as well as some implementation and performance details.
3.2.1 Graph theory
Graphs are mathematical structures used to model relationships between objects, made by sets of V vertices and lines called edges that connect them. Their origin is attributed by many to the pioneer Swiss mathematician Leonhard Paul Euler (1707-1783) and the famous ‘Köningsberg bridge’ problem, which revolutionized the way many complicated problems were looked at and solved in future. Nowadays, graphs can be used to model many types of relations and processes in physical, biological, social and information systems [43]. Many practical problems can be easily represented by graphs.
A graph, in its most simple form can be represented mathematically as:
G = (V,E) where V = v1,v2,vn and E = e1,e2,en
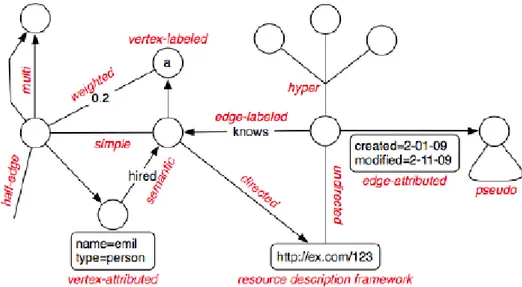
This structure may encompass loops (two endpoints of an edge are in the same vertex). Different types of graphs can be created by adding characteristics to the primitive dots and lines. For example, we may assign a label to each vertex or assign a name to each line. Graphs may also be directed (with a specified one-way orientation between edges), weighted (where each node has its own weight, useful for probabilistic analysis) and semantic (where it models a cognitive structure such as relationships of concepts, like a graph of friends).
34 In computer science, vertices can be seen as abstract data types also called nodes, with lines (segments) connecting these nodes. Again, more abstractly saying edges can be seen as data types that show relations between nodes. Most databases support a mix between directed, labeled and attributed and multi-graphs, as it allows us to construct complex data structures by simply adding or removing characteristics from the graph. This morphism of properties can more fluently represent our problem domain from its lowest level [54].
Graphs remain a significant field of interest within algorithms and data modeling. Typical higher-level operations associated with graphs (such as finding a path between nodes, a depth-first search or a shortest path operation) are more intuitive to solve compared to other representation methods (such as the relational model) and present substantial improvements in response times.
Figure 4- A simple directed labeled graph
Figure 5 - An example of graph morphism. Several characteristics can be added to a graph to better express our domain.
35 3.2.2 Graph databases
Graph structures store relationships at the individual record level, while in a relational database the structure is defined at a higher level in table definitions and foreign keys. Relational databases work with sets while graph databases work with paths. This has very important ramifications later on, leading to some operations being faster in a RDBMS and others being faster in a graph database. For example, when trying to emulate path operations (e.g. friends of friends) by recursively joining tables in a relational database, query latency tends to grow exponentially and massively along with memory usage. Most graph databases don’t suffer this kind of join pain because they express relationships at a fundamental level, and therefore are much faster than a relational database to express connected data – the strength of the underlying model. A consequence of this is that query latency in a graph database is proportional to how much of the graph we choose to explore in a query and not proportional to the amount of data stored in total. Relational models work significantly faster when the structure of the data is known ahead of time. They also use less storage space as they do not have to physically store every relationship on disk.
Graph databases store data in acyclic graphics, the most generic of data structures. They record data in nodes (which may have properties), and directed relationships between nodes (with possible attributes), which describe paths as seen previously. A graph can be navigated with a traversal, which essentially means traveling a sub-graph from node to node via a particular algorithm to find the desired data. Graph queries work by searching patterns such as sets or paths of data. Typical questions for a traversal are:
Figure 6 - The main differences in representing data for both a relational (left) and graph model (right) [55].
36 “How is A connected to B?” (set) or “Where’s the nearest point of A?” (pattern). Indexes can also map from properties to nodes or relationships. They are used to optimize traversal queries that involve node or relationship properties, as it would be inefficient to transverse an entire graph to look for a particular propriety [46].
Graph databases are also particularly good at dealing with domain complexity. Highly interconnected data structures are easier to model in a graph, and complex queries with result-set data coming from different entities are more efficiently executed. However, they offer little gain in terms of set-oriented queries, where all data in our queries needs to be represented as a long list of uniform, tabular data items. Large chunks of binary data can be stored in a graph, but is often not a good idea given that putting binary data in a node can significantly impact transversal speeds.
Since graphs are a naturally data-driven structure, they become a flexible solution for several (schema-free) domain models, typically those that involve highly connected data, pattern matching, shortest path algorithms, and optimization.
As such, we can conclude that graph databases are better suited for irregular and complex structures, and boast strong vertical scalability while relational databases are faster to perform queries over regular and relatively simple structures.
3.3 The Neo4J datastore
Neo4J is an open-source, embeddable graph database implemented in Java. It makes use of a property graph data model to store information. It features a reliable, full ACID transaction model as well as supporting mass scalability, up to several billion nodes per machine. Initially released in 2007, Neo4J is available in multiple platforms (such as Windows, Mac or UNIX) and has grown to be the most popular graph database, used in multiple critical systems worldwide. Other features include a fast, optimized framework for query traversing and a transactional HTTP-Endpoint for Cypher (Neo4J’s query language).
37
Figure 7 - Quick overview of Neo4J’s graph database advantages.
It can be accessed from a REST interface as well as from an object-oriented Java API (also extendable to other languages). Neo4J is licensed under the free GNU General Public License. The most recent version (2.0) has been released in December, 2013. Neo4J can also include other libraries such as the Neo4J spatial, a toolkit designed to import OSM datasets and perform or test spatial queries. This allows for any data to be adapted to complex queries with geographic components.
Neo4J operates with a property graph data model. This consists of directed edges (nodes) and labeled vertices, with associated pairs of data (relationships), which can have values (properties). A relationship connects 2 nodes, has a well-defined type and can be also directed. Properties are key/value pairs that are attached to both nodes and relationships.
38 In figure 8 we can observe a simple semantic representation of a geographical domain. Nodes labeled as Object stand for our geographical places of interest where Type nodes define each Object into one of their categories (such as buildings, roads, cities or countries). The State nodes define weather an Object is public or private, and the Status nodes define weather an Object is currently active or not. Relationships such as IS_IN represent a place of interest that is geographically contained in another (for example, University of Madeira belongs to Funchal), while relationships such as IS_NEAR represent proximity within an arbitrary value. Properties are available both to nodes and do relationships (but are not visible in this diagram).
Operating with data in Neo4J requires a different approach compared to a relational database. Instead of relying on declarative sentences (much like SQL would), graph databases operate by navigating from a given node via relationships to the nodes that match our criteria. This can be done by using a node query language called Cypher, which will be explained in the following section.
Traversing a graph is done by following existing relationships according to some rules. In the previous figure 8, if we wanted to know which country University of Madeira belongs to we would have to identify that object node first and follow any IS_IN relationships that derive from it and from any objects it connects until we land on an object node that is classified as a country (has a IS_OF_TYPE relation to the object
39 Country). The path would be along the lines of: Uma->IS_IN->Funchal->IS_IN->Madeira->IS_IN->Portugal->IS_OF_TYPE->Country.
This kind of search becomes suitable for when we want to find a specific node based on its connectivity with others, but is significantly worse when one wants to find a node according to a property it has. If we wanted to find which countries have a population attribute over 10.000.000, we would have to perform a node-by-node look-up instead (preferably using indexes).
3.3.1 Cypher query language
Cypher is a declarative graph query language developed for Neo4J, which allows for expressive and efficient querying and updating of the graph database [46]. Very complicated queries can be easily expressed through Cypher due to its graphical syntax. Being a declarative language means that the language is focused on the clarity of expressing what to retrieve from a graph, not how to retrieve it, as a contrast with other imperative languages such as Java or Gremlin. Several semantics and commands Cypher have been inspired from other languages, such as SQL or Python.
The main structure is based on clauses chained together just like SQL. The 3 main clauses for reading a graph are MATCH, WHERE and RETURN. The MATCH clause describes the graph pattern we wish to follow. The WHERE clause (which works as a sub-clause to MATCH or other variants such as OPTIONAL MATCH and WITH) adds constraints to a pattern or can be used to filter certain properties. Finally, the RETURN clause describes what to return from our query. Relationships can be represented with a special syntax that connects both nodes and their corresponding relationship name.
For example, if we wish to list all places of interest that belong to Funchal, we would perform the following query:
MATCH (a: Object)-[IS_IN]->(Object {name: 'Funchal'}) RETURN a The (a)-[REL]->(b) syntax represents a relationship that starts in node a and ends in node b. In this example, we start by attributing a label to the first unknown node (a) and describing which type of node it was labeled with (in this case, Object). The pattern of interest here is any node that connects to Funchal by a IS_IN relationship, which is
40 expressed with the MATCH clause and retrieved by the RETURN clause. In the previous graph, the answer would be 2 objects: University of Madeira and Dolce Vita. The following query returns which country Madeira belongs to. It involves a more complex pattern matching:
MATCH (Object {name: 'Madeira'})-[IS_IN]->(a)-[IS_OF_TYPE]->(Type {name: 'Country'}) RETURN a
a) Identify the starting node, which is labeled as an Object with a name property: MATCH (Object {name: 'Madeira'})
b) Follow our desired relationship. Finding where an object belongs to can be done with the previously explained IS_IN relationship, which connects the object Madeira to our target object (represented as a) (Object {name: 'Madeira'})-[IS_IN]->(a)
c) Our target node must have a type definition, so we will look for the relationship IS_OF_TYPE that connects it to a type named ‘Country’. (a)-[IS_OF_TYPE]->(Type {name: 'Country'})
d) We return our target node RETURN a
According to our previous graph (figure 8), the result would be the Portugal node. 3.3.2 The Neo4JPHP wrapper
Neo4J can be accessed from either a REST interface as well as from an object-oriented Java API. However, this can also be extended to other languages such as PHP. The Neo4JPHP Wrapper, written by Josh Adell aims at providing access to the full functionality of the Neo4J REST API via PHP [48]. It can provide both a direct correspondence with REST via cypher query calls as well as a way to abstract the REST interface away, so that the application modeling can be done by using node and relationship object abstraction. Neo4JPHP is able to model several operations for each of the following entities with an object oriented approach:
41 a) Nodes and relationships
$arthur = $client->makeNode() Creates a node object
$arthur->setProperty('name', 'Arthur Dent')
Sets an array of properties in the node object
$arthur->save() Saves the node object or relationship
array to Neo4J
$arthurId = $arthur->getId() Retrieves the id from the node object as a
variable
$character->getProperties($arthurId) Retrieves the node object properties
$character->removeProperty('name') Removes a node object’s property and
assigned values
$arthur->delete() Deletes a node or relationship
$arthur->relateTo($earth, 'LIVES_ON')
Creates a directed relationship from one node to another
$arthurRelationships = $arthur ->getRelationships()
Returns the list of relationships associated with a node
b) Labels
$label = $client
->makeLabel('MyLabel'); Creates a label
$allLabels = $client->getLabels(); Returns the list of labels
$labels = $node
->addLabels(array($myLabel, $myOtherLabel));
Adds a label to an existing node
$remainingLabels = $node ->removeLabels(array($myLabel, $oneMoreLabel));
Removes an array of labels from a node
c) Indexes
$shipIndex = new
Everyman\Neo4J\Index\NodeIndex($clie nt, 'ships');
$shipIndex->save();
Creates an index and saves it to the server
$shipIndex->delete(); Deletes an index
$shipIndex->add($heartOfGold,
'propulsion', $heartOfGold
->getProperty('propulsion'));
Indexes an object on one of the properties
$shipIndex->remove($heartOfGold); Removes all indexes from a given node
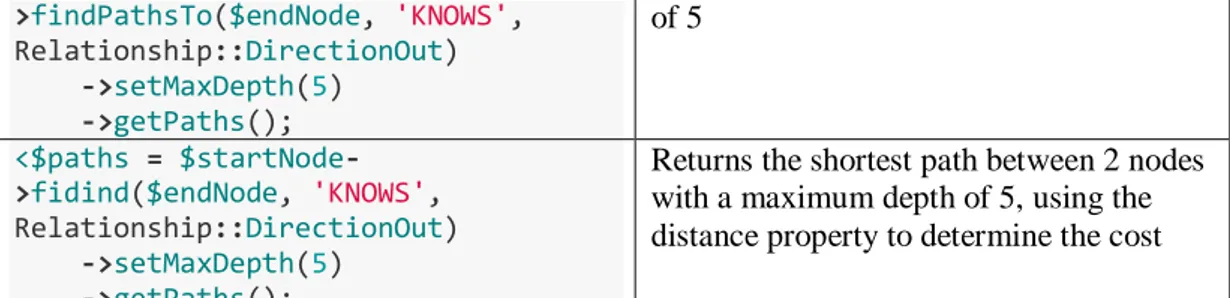
d) Paths
$paths = $startNode ->findPathsTo($endNode)
->getPaths();
Returns all existing paths between the 2 specified nodes
42 >findPathsTo($endNode, 'KNOWS', Relationship::DirectionOut) ->setMaxDepth(5) ->getPaths(); of 5 <$paths = $startNode ->fidind($endNode, 'KNOWS', Relationship::DirectionOut) ->setMaxDepth(5) ->getPaths();
Returns the shortest path between 2 nodes with a maximum depth of 5, using the distance property to determine the cost
e) Cypher queries
$queryString = "START n=node(1) ".
"MATCH (n)<-[:KNOWS]-(x)-[:HAS]->()". "RETURN x"; $query = new Everyman\Neo4J\Cypher\Query($client, $queryString);
$result = $query->getResultSet();
Specified a query string and then creates a server call to process it
f) Transactions in Cypher
$transaction = $client ->beginTransaction();
Opens a new transaction
$query = new Query($client, 'MATCH n WHERE id(n)={nodeId} RETURN n',
array('nodeId' => 123)); $result = $transaction ->addStatements($query);
Adds a query to the transaction
$transaction->commit(); Commits the transaction. If unsuccessful, performs a rollback
![Figure 6 - The main differences in representing data for both a relational (left) and graph model (right) [55].](https://thumb-eu.123doks.com/thumbv2/123dok_br/19288519.990617/37.892.205.687.625.813/figure-main-differences-representing-relational-graph-model-right.webp)