Reproducibility of Middle Cerebral Artery
Stenosis Measurements by DSA: Comparison
of the NASCET and WASID Methods
Luguang Chen☯, Qian Zhan☯, Chao Ma, Qi Liu, Xuefeng Zhang, Xia Tian, Yuanliang Jiang,
Yinmei Dong, Shiyue Chen, Jianping Lu*
Department of Radiology, Changhai Hospital of Shanghai, The Second Military Medical University, No. 168 Changhai Road, Shanghai, 200433, China
☯These authors contributed equally to this work. *[email protected]
Abstract
Purpose
To evaluate the intra- and inter-observer variability of the North American Symptomatic Carotid Endarterectomy Trial (NASCET) and Warfarin-Aspirin Symptomatic Intracranial Disease (WASID) criteria for the evaluation of middle cerebral artery (MCA) stenosis using digital subtraction angiography (DSA).
Materials and Methods
DSA images of 114 cases with 131 stenotic MCAs were retrospectively analyzed. Two radi-ologists and a researcher measured the degree of MCA stenosis independently using both NASCET and WASID methods. To determine intra-observer agreement, all the observers reevaluated the degree of MCA stenosis 4 weeks later. The linear relation and coefficient of variation (CV) between the measurements made by the two methods were assessed by cor-relation coefficient and multi-factor analysis of variance (ANOVA), respectively. Intra- and inter-observer variability of the two methods was evaluated by intraclass correlation coeffi-cient (ICC), Spearman’s R value, Pearson correlation coefficient and Bland-Altman plots.
Results
Despite the fact that the degree of MCA stenosis measured by NASCET was lower than measured using the WASID method, there was good linear correlation between the mea-surements made by the two methods (for the mean meamea-surements of the 3 observers, NAS-CET% = 0.891 × WASID% - 1.89%; ICC, Spearman’s R value and Pearson correlation were 0.874, 0.855, and 0.874, respectively). The CVs of both intra- and inter-observer mea-surements of MCA stenosis using WASID were significantly lower than that using NASCET confirmed by the multi-factor ANOVA results, which showed only the measurement meth-ods of MCA stenosis had significant effects on the CVs both in intra- and inter-observer measurements (bothPvalues<0.001). Intra-observer measurements showed good or
a11111
OPEN ACCESS
Citation:Chen L, Zhan Q, Ma C, Liu Q, Zhang X, Tian X, et al. (2015) Reproducibility of Middle Cerebral Artery Stenosis Measurements by DSA: Comparison of the NASCET and WASID Methods. PLoS ONE 10(6): e0130991. doi:10.1371/journal. pone.0130991
Editor:Rex Eugene Jung, University of New Mexico, UNITED STATES
Received:October 14, 2014
Accepted:May 27, 2015
Published:June 26, 2015
Copyright:© 2015 Chen et al. This is an open access article distributed under the terms of the Creative Commons Attribution License, which permits unrestricted use, distribution, and reproduction in any medium, provided the original author and source are credited.
Data Availability Statement:All relevant data are within the paper.
Funding:This work was supported by the 1255 Academic Discipline Project of Shanghai Changhai Hospital (CH125520800) and the Shanghai Shenkang Project SHDC12013110 (Clinical Research Registration Number: ChiCTR-DDT-14004284), Shanghai, China.
excellent agreement with respect to WASID and NASCET evaluation (ICC, 0.656 to 0.817 and 0.635 to 0.761, respectively). Good agreement for the WASID evaluation (ICC, 0.592 to 0.628) and for the NASCET evaluation (ICC, 0.529 to 0.568) was observed for inter-observer measurements. Bland-Altman plots demonstrated that the WASID method had better reproducibility and intra-observer agreement than NASCET method for evaluating MCA stenosis.
Conclusion
Both NASCET and WASID methods have an acceptable level of agreement; however, the WASID method had better reproducibility for the evaluation of MCA stenosis, and thus the WASID method may serve as a standard for measuring the degree of MCA stenosis.
Introduction
Intracranial artery atherosclerosis is increasingly being recognized as a major cause of stroke worldwide, and patients with intracranial steno-occlusive disease have an augmented risk of vascular events [1]. Intracranial arterial stenosis (IAS) corresponds to luminal narrowing of large intracranial arteries [2]. Primary atherosclerosis is the main cause of IAS, although some-times embolic events can result in severe stenosis [2]. Atherosclerotic IAS usually occurs in the middle cerebral artery (MCA), which is the principle intracranial artery perfusing the cerebral hemispheres [3]. Moreover, patients with symptomatic MCA stenosis have a higher prevalence (12.5%) of stroke than those with asymptomatic MCA disease (2.85%) [4].
Accurate measurement of the degree of stenosis is important to guide treatment decisions in the clinic [5], and several studies have suggested that patients with more than 70% stenosis may benefit in the long-term from artery stenting, while another study showed an increased risk of ischemic recurrence with significant stenosis [6,7]. Several imaging modalities, including digital subtraction angiography (DSA), computed tomography angiography (CTA), and mag-netic resonance angiography (MRA) are used to assess intracranial atherosclerosis. However, the standard method for the evaluation of intracranial atherosclerosis is still DSA. North American Symptomatic Carotid Endarterectomy Trial (NASCET) and Warfarin-Aspirin Symptomatic Intracranial Disease (WASID) are the most commonly used methods to evaluate vascular stenosis. Both methods determine the degree of stenosis by taking the diameter of the residual lumen at the site of maximal luminal narrowing, and the evaluation of stenosis is based on the formula: % stenosis = [1−(Dstenosis/Dnormal)] × 100 [1,8]. According to this
equa-tion, for the NASCET and WASID methods, the normal segment is ideally measured at a site distal and proximal to the stenotic lesion, respectively [9]. Although designed for carotid steno-sis, the NASCET method has been widely employed to measure intracranial stenosis [10].
Therefore, the aim of the present study was to evaluate intra- and inter-observer variability of NASCET and WASID criteria for the evaluation of MCA stenosis using DSA and to com-pare measurements made by the two methods.
Materials and Methods
Subjects
This retrospective study was approved by our Institutional Review Board, Shanghai Changhai Hospital Ethics Committee. Signed written informed consent was waived from all participants. A computerized search of the DSA imaging database and medical records from May 2011 through March 2014 at our institution yielded a list of 200 patients who underwent DSA imag-ing for suspected intracranial atherosclerotic disease usimag-ing the aforementioned standard clini-cal protocol. The inclusion criteria for the present study were: ischemic stroke or transient ischemic attack in the target MCA territory within the past 30 days; and a stenosed vessel at the M1 segment of the MCA on DSA images. We excluded patients using the following criteria: 1) poor image quality for interpretation; 2) nonatherosclerotic vasculopathy, such as dissection or Moyamoya disease; and 3) normal or occluded arteries at the M1 segment of the MCA. In the final analysis, 114 subjects with 131 stenosed MCAs were enrolled in this study.
Digital subtraction angiography
DSA was carried out using a Siemens angiographic unit (Siemens Medical Solution, Erlangen, Germany) with a protocol involving femoral puncture and selective injection of Ultravist con-trast agent (Bayer Healthcare, Erlangen, Germany) into the MCA vessels. Images were acquired using a 1024 × 1024 matrix, a 220 × 220 mm2field of view, and a pixel size of 0.21 × 0.21 mm2 at 5 mL/s until the late venous phase. Three projections (anteroposterior, oblique, and lateral views) were acquired in all cases.
Image analysis
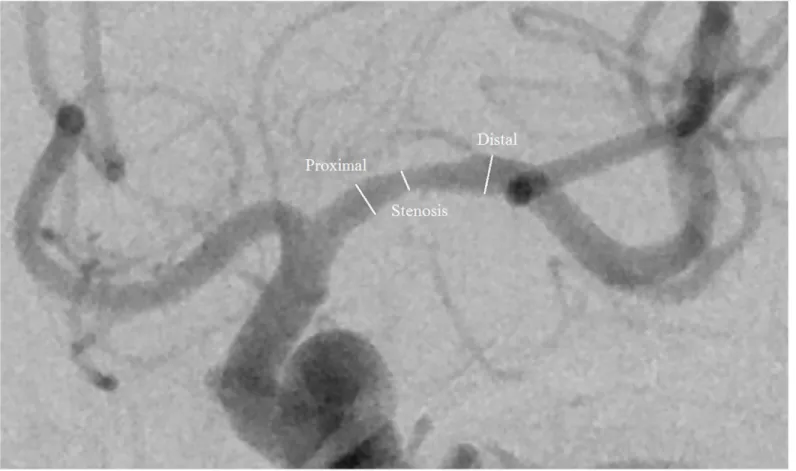
All measurements of luminal stenosis were performed by three independent observers: two radiologists (referred to as Observer 1 and 2, respectively) with 5 years of experience in neuro-radiology, and one researcher (referred to as Observer 3) with 4 years of experience in neurora-diology, who were blinded to the clinical information of each patient. An electronic ruler from industry-standard Digital Imaging and Communications in Medicine reading software (Gen-eral Electric Advantage Work-station, GE Healthcare, Milwaukee, WI, USA) configured on a physician workstation with a technical high resolution screen (Jusha Healthcare, Nanjing, Peo-ple’s Republic of China) was used to measure vessel diameters on the anteroposterior view of DSA images. The images were zoomed to 250%, and window width and level were adjusted to optimize vessel contour. The degree of stenosis or the ratio between the residual lumen at the stenosis and the normal lumen without stenosis was determined using both NASCET and WASID criteria (Fig 1). To evaluate intra-observer variability, three observers measured MCA stenosis twice during two different sessions that were separated by at least 4-week interval to avoid any recall bias. All of the observers were blinded to theirs and each other’s results.
Statistical analysis
correlation coefficient and the results are displayed as scatterplots with four regression lines (the horizontal and vertical axes indicate the average degree of stenosis measured using WASID and NASCET methods, respectively). All values of the measurements are expressed as the mean ± SEM (Standard Error of Mean).
The coefficients of variation (CVs) of intra- and inter-observer measurements were used to evaluate the variability between the two methods. The CV was determined by the standard deviation (SD) of the two matched measurements of each method divided the mean of the two matched measurements of each method (CV = SD/mean × 100%). Multi-factor analysis of var-iance (ANOVA) (two factors in the present study, methods and observers) was used to assess the variability of CVs of intra- and inter-observer measurements between the two methods. The overall CVs and percentage difference of the MCA stenosis measurements made by the two methods were also calculated and compared, respectively.
Intraclass correlation coefficient (ICC) and Bland-Altman plots were used to assess intra-and inter-observer variability of both the NASCET intra-and WASID methods. The ICC is the pro-portion of the total variance caused by variation between serial measurements or single mea-surements by different observers. Values were graded according to the method proposed by Shout and Fleiss [12]:<0.4, poor agreement; 0.4–0.75, good agreement;>0.75, excellent agreement. For the Bland-Altman analysis [13], differences in the two measurements were plotted against the mean of the two measurements to assess intra- and inter-observer agree-ment for each method. Therefore, bias and 95% confidence intervals of the mean difference Fig 1. Digital subtraction angiography image showing the points where measurements were taken.The NASCET method uses the distal segment as a comparator to the stenotic region. The WASID method divides the stenotic segment measurement by the proximal normal segment.
(limits of agreement) were evaluated across the mean stenosis, and the less agreement, the wider the dispersion of the scatterplot at a given mean measurement. Spearman and Pearson correlation tests were also performed to assess relationships between measurements. AP
-value<0.05 was regarded as statistically significant.
Results
A total of 131 MCA M1 segments of 114 cases (75 males [65.8%], 39 females [34.2%], mean age: 56.8 ± 11.2 years) were retrospectively analyzed. Various degrees of stenosis were also detected in these segments. In 53 patients (46.5%), the stenosis was on the left M1 segment of the MCA, while in 44 patients (38.6%) it was on the right M1 segment of the MCA and in 17 patients (14.9%) it was bilateral.
Correlation between NASCET and WASID
The results of linear correlation between the NASCET and WASID methods are provided in
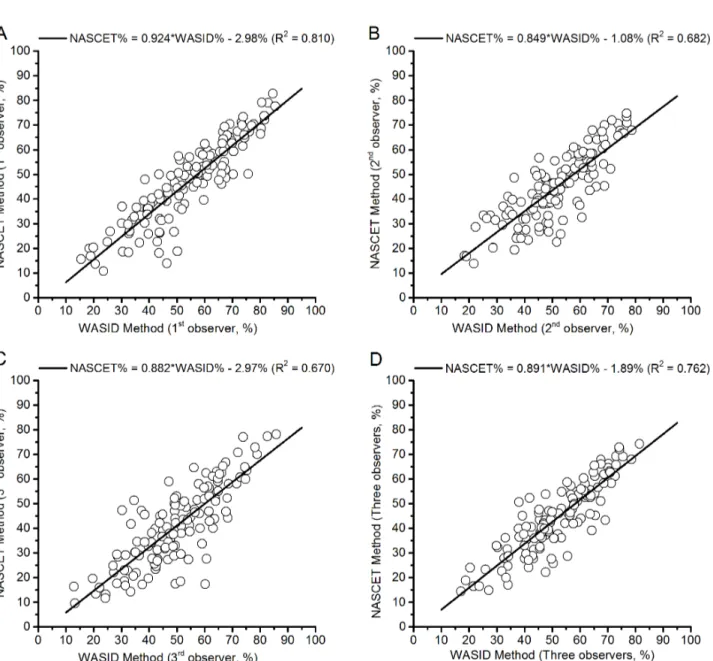
Table 1. The mean MCA stenosis measurements of each observer and all the 3 observers for NASCET are ranging from 40.9% to 47.3%, and for WASID are ranging from 49.8% to 54.4%. The ICCs, Spearman’s R values and Pearson correlation coefficients of the measurements showed excellent agreement and high correlation between the two methods. The scatterplots showing the NASCET and WASID measurements are shown inFig 2, where there are four evi-dent linear regression lines between the two criteria measurements. Taking the mean measure-ments of the 3 observers as an example, the following equation can be deduced from the linear regression line (Fig 2D), and theR2value was 0.762: NASCET% = 0.891 × WASID%–1.89%;
i.e., 70.0% NASCET stenosis is equal to 80.7% WASID stenosis.
Intra-observer agreement
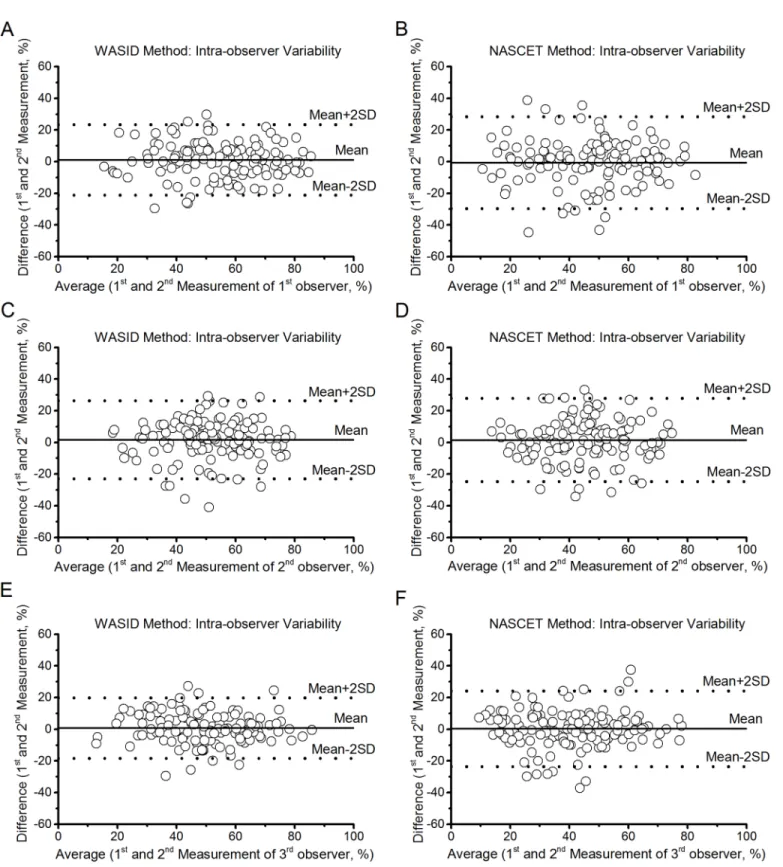
Statistical results of intra-observer reproducibility are presented inTable 2. Intra-observer measurements showed good or excellent agreement both for the NASCET evaluation and the WASID evaluation using ICC (0.635 to 0.761 and 0.656 to 0.817, respectively,P<0.01). Spear-man’s R value and Pearson correlation coefficient also suggested a high correlation in intra-observer measurements. The bias and limits of agreement of intra-intra-observer agreement for the measurements of MCA stenosis by using NASCET and WASID methods by employing Bland-Altman plots (Fig 3) were provided inTable 3(Intra-observer variability). Compared with NASCET, WASID has lower bias and limits of agreement (Table 3) and the narrower the dis-persion of the scatterplot at a given measurement (Fig 3). In addition, the WASID method showed better reproducibility than the NASCET method for evaluating of MCA stenosis with a higher ICC (0.791 versus 0.684 for 1stobserver, 0.656 versus 0.635 for 2ndobserver and 0.817 versus 0.761 for 3rdobserver), Spearman’s R value (0.792 versus 0.681 for 1stobserver, 0.649 versus 0.624 for 2ndobserver and 0.814 versus 0.756 for 3rdobserver), and Pearson correlation coefficient (0.791 versus 0.684 for 1stobserver, 0.657 versus 0.636 for 2ndobserver and 0.818 versus 0.762 for 3rdobserver), respectively. Moreover, multi-factor ANOVA results showed the CVs of intra-observer measurements using WASID method were significantly lower than that using NASCET (Table 4) in all of the 3 observers (P<0.001). Observer had no significant effects on the CVs of MCA stenosis in intra-observer measurements (P= 0.406).
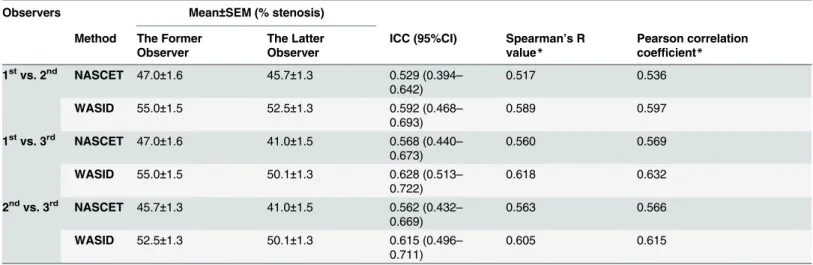
Inter-observer agreement
Table 1. Linear correlation between NASCET and WASID methods in each observer and all 3 observers.
Observer Mean±SEM (% stenosis)
NASCET WASID ICC (95%CI) Spearman’s R value* Pearson correlation coefficient*
1st 47.3±1.5 54.4±1.4 0.901 (0.863–0.929) 0.904 0.901
2nd 45.0±1.2 51.7±1.2 0.828 (0.765–0.875) 0.806 0.828
3rd 40.9±1.4 49.8±1.3 0.817 (0.751
–0.867) 0.795 0.820
All 44.4±1.2 52.0±1.2 0.874 (0.826–0.909) 0.855 0.874
SEM, standard error of Mean; NASCET, north American symptomatic carotid endarterectomy trial; WASID, warfarin-aspirin symptomatic intracranial disease; ICC, intraclass correlation coefficient; CI, confidence interval;
*P<0.01.
doi:10.1371/journal.pone.0130991.t001
Fig 2. Scatterplots of NASCET and WASID measurements.(A) The measurements of Observer 1. (B) The measurements of Observer 2. (C) The measurements of Observer 3. (D) The mean measurements of all 3 observers.
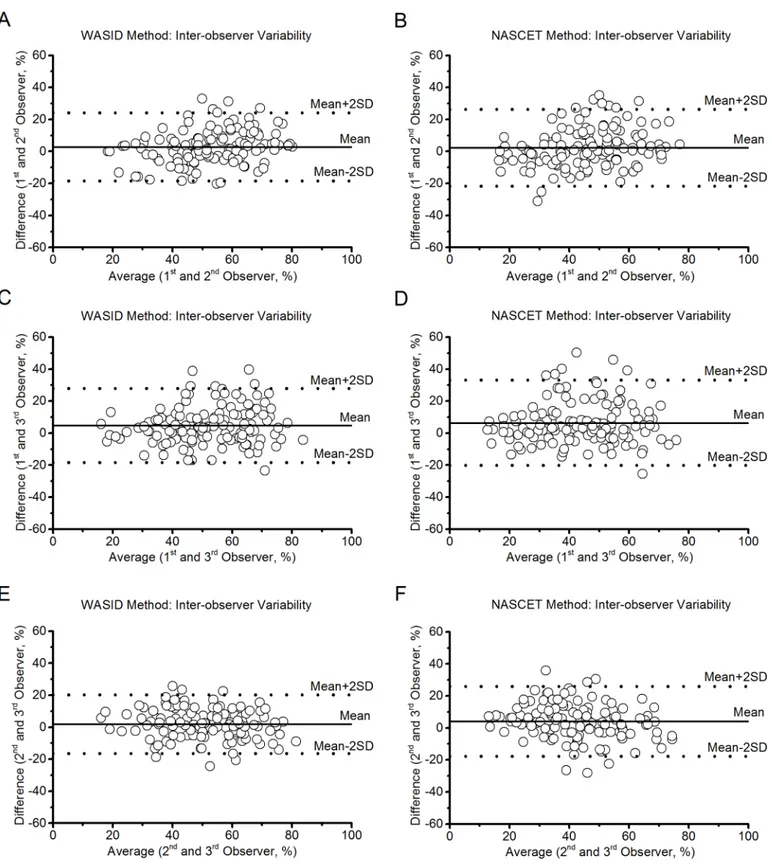
the NASCET evaluation using ICC (0.592 to 0.628 and 0.529 to 0.568, respectively,P<0.01). Spearman’s R value and Pearson correlation coefficient also suggested good correlation for inter-observer measurements. The bias and limits of agreement for the measurements of MCA stenosis of inter-observer agreement by employing Bland-Altman plots (Fig 4) for the NAS-CET and WASID methods were provided inTable 3(Inter-observer variability), respectively. As with the intra-observer measurements, the WASID method also has lower bias and limits of agreement (Table 3) and the narrower the dispersion of the scatterplot at a given measurement (Fig 4) and had better reproducibility than the NASCET method for evaluating MCA stenosis, as illustrated by higher ICC (0.592 versus 0.529 for the 1stand 2ndobservers, 0.628 versus 0.568 for 1stand 3rdobservers, and 0.615 versus 0.562 for 2ndand 3rdobservers), Spearman’s R value (0.589 versus 0.517 for the 1stand 2ndobservers, 0.618 versus 0.560 for 1stand 3rdobservers, and 0.605 versus 0.563 for 2ndand 3rdobservers), and Pearson correlation coefficient (0.597 versus 0.536 for the 1stand 2ndobservers, 0.632 versus 0.569 for 1stand 3rdobservers, and 0.615 versus 0.566 for 2ndand 3rdobservers), respectively. Moreover, multi-factor ANOVA results showed the CVs of inter-observer measurements using WASID method were signifi-cantly lower than that using NASCET (Table 4) in all of the 3 observers (P<0.001). Observer had no significant effects on the CVs of MCA stenosis in inter-observer measurements (P= 0.148).
The results showed that the degree of MCA stenosis measured with WASID had lower over-all CV than that with NASCET (CVs were 12.5% and 16.9% for WASID and NASCET, respec-tively), and the percentage difference was 36.0%.
Discussion
The present study is the first to evaluate the reproducibility of NASCET and WASID tech-niques for measuring MCA stenosis degree using DSA. Correct quantification of stenosis degree is fundamental in planning the correct therapeutic approach and, because of the confu-sion generated by the use of different methods, comparative analyses may be important [14]. It is essential to emphasize that the patient population in our study is considerably larger than in Table 2. Mean±SEM, ICC, Spearman’s R value, and Pearson correlation coefficient statistics of intra-observer agreement.
Observer Mean±SEM (% stenosis)
Method The First Measurement
The Second Measurement
ICC (95%CI) Spearman’s R value*
Pearson correlation coefficient*
1st NASCET 47.0±1.6 47.7±1.6 0.684 (0.581–
0.766)
0.681 0.684
WASID 55.0±1.5 53.9±1.5 0.791 (0.717–
0.847)
0.792 0.791
2nd NASCET 45.7±1.3 44.2±1.3 0.635 (0.521–
0.727)
0.624 0.636
WASID 52.5±1.3 50.8±1.3 0.656 (0.547–
0.744)
0.649 0.657
3rd NASCET 41.0±1.5 40.8±1.5 0.761 (0.679–
0.825)
0.756 0.762
WASID 50.1±1.3 49.4±1.4 0.817 (0.750–
0.867)
0.814 0.818
SEM, standard error of Mean; NASCET, north American symptomatic carotid endarterectomy trial; WASID, warfarin-aspirin symptomatic intracranial disease; ICC, intraclass correlation coefficient; CI, confidence interval;
*P<0.01.
Fig 3. Bland-Altman plots of intra-observer reproducibility of the NASCET and WASID methods.(A, C and E) WASID method for Observer 1, 2 and 3, respectively. (B, D and F) NASCET method for Observer 1, 2 and 3, respectively.
previous studies [5,11]. On the whole, our data indicated good reproducibility of all measurements.
As the NASCET and WASID methods adopt different reference sites for determining nor-mal vessel diameter, each method provides a different degree of stenosis for the same lesion based on the same angiogram [8,15]. Therefore, referring to the percentage of MCA stenosis without regard for the measurement method is misleading and it may lead to confusion in clin-ical practice. In our study, however, measurements of MCA stenosis by employing NASCET and WASID methods were highly correlated with Spearman’s R values and Pearson correlation coefficients (Table 1). This correlation was consistent with a previous study from our institute [16]. We also deduced equations based on the scatterplots of NASCET and WASID measure-ments (Fig 2), which may be used to express the percentage of MCA stenosis measured using one method as a function of the corresponding value measured using another method. How-ever, conversion between the two means of MCA stenosis degree measurements is only possi-ble after analyzing a large series of patients and deriving an equation based on these patients. To our knowledge, no study has previously reported such equations. Moreover, several studies have suggested a linear relationship between the NASCET and WASID methods for the evalua-tion of carotid artery stenosis [15,17]. It is worth noting that the degree of stenosis measured with the NASCET method was lower than measured by the WASID method, and the main rea-son for this is likely the reference points used to determine normal artery diameter by different methods. More specifically, the diameter of the proximal site of MCA is larger than the distal site in accordance with the natural morphology of the vessel [18]; in another words, the diame-ter of the reference lumen at the proximal site is larger than at the distal site. On the other hand, sometimes the overlapped vessels at the distal site of MCA results in difficulties
Table 3. The mean absolute difference and 95% confidence intervals of the mean difference of intra- and inter-observer variabilities in the evalua-tion of MCA stenosis.
Method Intra-observer variability (% stenosis) Inter-observer variability (% stenosis)
Observer 1st Observer 2nd Observer 3rd Observers 1st&2nd Observers 1st&3rd Observers 2nd&3rd
NASCET 10.6 (-3.2–1.8) 10.2 (-0.7–3.8) 8.8 (-1.8–2.3) 12.7 (-1.6–4.1) 12.6 (3.1–8.8) 12.3 (2.0–7.3)
WASID 8.8 (-0.8–3.0) 9.4 (-0.5–3.7) 7.3 (-0.9–2.4) 10.8 (0.0–5.0) 11.5 (2.4–7.3) 10.4 (0.0–4.6)
NASCET, north American symptomatic carotid endarterectomy trial; WASID, warfarin-aspirin symptomatic intracranial disease.
doi:10.1371/journal.pone.0130991.t003
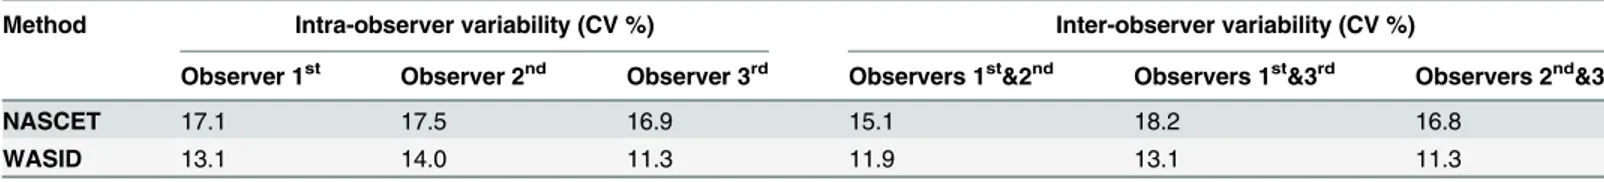
Table 4. The mean CVs of intra- and inter-observer of the MCA stenosis measurements between the two methods.
Method Intra-observer variability (CV %) Inter-observer variability (CV %)
Observer 1st Observer 2nd Observer 3rd Observers 1st&2nd Observers 1st&3rd Observers 2nd&3rd
NASCET 17.1 17.5 16.9 15.1 18.2 16.8
WASID 13.1 14.0 11.3 11.9 13.1 11.3
NASCET, north American symptomatic carotid endarterectomy trial; WASID, warfarin-aspirin symptomatic intracranial disease. the CVs of both intra- and inter-observer measurements of MCA stenosis using WASID were significantly lower than that using NASCET confirmed by the multi-factor ANOVA results, which showed only the measurement methods of MCA stenosis had significant effects on the CVs both in intra- and inter-observer measurements (bothPvalues<0.001).
discriminating the boundaries of the vessels and increases error when evaluating the degree of MCA stenosis [19].
Even though it is possible to convert the degree of stenosis calculated by one method to another method, the best solution is likely to use one method as the current standard [11]. An important factor in choosing a standard method is the level of reproducibility. In our study, with respect to both intra- and inter-observer agreement, we observed good results using NAS-CET and WASID methods. Moreover, the ICC values of intra- and inter-observer agreement indicated good or excellent and good agreement, respectively (Tables2and5). In addition, the Spearman’s R values and Pearson correlation coefficients of the measurements obtained from different observers using different methods demonstrated to be of high relevance. Yet, the ICCs, Spearman’s R values, and Pearson correlation coefficients of the measurements obtained using WASID method were higher than using NASCET; i.e., Measurements of MCA stenosis using the WASID method were more reproducible than the NASCET method. Moreover, we employed the Bland-Altman plots to evaluate intra- and inter-observer agreement, and the dia-grams showed a relatively wide interval of agreement compared with the average (Figs3and
4). This suggests possible discrepancies between the two methods and among the 3 observers. However, intra- and inter-observer variability was still acceptable. Furthermore, the CVs of both intra- and inter-observer measurements of MCA stenosis using WASID were significantly lower than that using NASCET confirmed by the multi-factor ANOVA results, which showed only the measurement methods of MCA stenosis had significant effects on the CVs both in intra- and inter-observer measurements (bothPvalues<0.001). C1R2In addition, our analysis also showed that the overall CVs of the measurements made by NASCET and WASID methods were 16.9% and 12.5%, respectively, and WASID has lower CV than NASCET. The variability of measurements of MCA stenosis employing the WASID method has an overall percentage difference of 36.0 than the NASCET method. According to the results of the present study, we found that the WASID has better reproducibility than the NASCET for the evaluation of MCA stenosis, and reproducibility of intra-observer measurements were superior to inter-observer Table 5. Mean±SEM, ICC, Spearman’s R value, and Pearson correlation coefficient statistics of inter-observer agreement.
Observers Mean±SEM (% stenosis)
Method The Former Observer
The Latter Observer
ICC (95%CI) Spearman’s R value*
Pearson correlation coefficient*
1stvs. 2nd NASCET 47.0±1.6 45.7±1.3 0.529 (0.394–
0.642)
0.517 0.536
WASID 55.0±1.5 52.5±1.3 0.592 (0.468–
0.693)
0.589 0.597
1stvs. 3rd NASCET 47.0±1.6 41.0±1.5 0.568 (0.440–
0.673)
0.560 0.569
WASID 55.0±1.5 50.1±1.3 0.628 (0.513–
0.722)
0.618 0.632
2ndvs. 3rd NASCET 45.7±1.3 41.0±1.5 0.562 (0.432–
0.669)
0.563 0.566
WASID 52.5±1.3 50.1±1.3 0.615 (0.496–
0.711)
0.605 0.615
SEM, standard error of Mean; NASCET, north American symptomatic carotid endarterectomy trial; WASID, warfarin-aspirin symptomatic intracranial disease; ICC, intraclass correlation coefficient; CI, confidence interval;
*P<0.01.
Fig 4. Bland-Altman plots of inter-observer reproducibility of the NASCET and WASID methods.(A, C and E) WASID method for Observers 1&2, 1&3 and 2&3, respectively. (B, D and F) NASCET method for Observers 1&2, 1&3 and 2&3, respectively.
measurements. Several previous studies have also shown the WASID method has better agree-ment for intra- and inter-observer measureagree-ments of carotid artery stenosis [17,20].
To our knowledge, patients with a greater degree of stenosis of intracranial arteries are more likely to undergo pronounced clinical events and these patients are also more likely to experi-ence symptom recurrexperi-ence within the same territory as the stenosed arteries [21,22]. Therefore, accurate measurement of the degree of stenosis and detection of intracranial steno-occlusive disease are vitally important, especially when planning stent surgeries for patients. In the pres-ent study, we found that the WASID method is more reproducible, and our results consistpres-ent with Samuels et al. [8] in which the WASID method was deemed a better candidate for the worldwide standard for measuring intracranial stenosis on angiograms, as well as for measur-ing stenosis usmeasur-ing non-invasive techniques.
Conclusions
In conclusion, the present study showed a linear relationship between the NASCET and WASID methods for measuring MCA stenosis. Both NASCET and WASID methods have an acceptable level of agreement; however, the WASID method provided higher values and offered better reproducibility, therefore, it is better suited to serve as the standard for measur-ing the degree of MCA stenosis in future studies.
Author Contributions
Conceived and designed the experiments: CM LGC QZ QL JPL. Performed the experiments: SYC YLJ. Analyzed the data: LGC QZ CM YLJ. Contributed reagents/materials/analysis tools: LGC XFZ XT YMD. Wrote the paper: LGC CM QZ.
References
1. Turan TN, Makki AA, Tsappidi S, Cotsonis G, Lynn MJ, Cloft HJ, et al. Risk factors associated with severity and location of intracranial arterial stenosis. Stroke. 2010; 41: 1636–1640. doi:10.1161/ STROKEAHA.110.584672PMID:20616323
2. Carvalho M, Oliveira A, Azevedo E, Bastos-Leite AJ. Intracranial arterial stenosis. J Stroke Cerebro-vasc Dis. 2014; 23: 599–609. doi:10.1016/j.jstrokecerebrovasdis.2013.06.006PMID:23850084
3. Tarasów E, Abdulwahed Saleh Ali A, Lewszuk A, Walecki J. Measurements of the middle cerebral artery in digital subtraction angiography and MR angiography. Med Sci Monit. 2007; 13: 65–72. PMID: 17507888
4. Kern R, Steinke W, Daffertshofer M, Prager R, Hennerici M. Stroke recurrences in patients with symptom-atic vs asymptomsymptom-atic middle cerebral artery disease. Neurology. 2005; 65: 859–864. PMID:16186524
5. Liu Q, Huang J, Degnan AJ, Chen S, Gillard JH, Teng Z, et al. Comparison of high-resolution MRI with CT angiography and digital subtraction angiography for the evaluation of middle cerebral artery athero-sclerotic steno-occlusive disease. Int J Cardiovasc Imaging. 2013; 29: 1491–1498. doi:10.1007/ s10554-013-0237-3PMID:23686460
6. Tang CW, Chang FC, Chern CM, Lee YC, Hu HH, Lee IH. Stenting versus medical treatment for severe symptomatic intracranial stenosis. AJNR Am J Neuroradiol. 2011; 32: 911–916. doi:10.3174/ajnr. A2409PMID:21393399
7. Mazighi M, Tanasescu R, Ducrocq X, Vicaut E, Bracard S, Houdart E, et al. Prospective study of symp-tomatic atherothrombotic intracranial stenoses: the GESICA study. Neurology. 2006; 66: 1187–1191. PMID:16636236
8. Samuels OB, Joseph GJ, Lynn MJ, Smith HA, Chimowitz MI. A standardized method for measuring intracranial arterial stenosis. AJNR Am J Neuroradiol. 2000; 21: 643–646. PMID:10782772
9. Fox AJ. How to measure carotid stenosis. Radiology. 1993; 186: 316–318. PMID:8421726
11. Kılıçkap G, Ergun E, Başbay E, Koşar P, Kosar U. Carotid stenosis evaluation by 64-slice CTA: com-parison of NASCET, ECST and CC grading methods. Int J Cardiovasc Imaging. 2012; 28: 1257–1266. doi:10.1007/s10554-011-9939-6PMID:21858656
12. Shrout PE, Fleiss JL. Intraclass correlations: uses in assessing rater reliability. Psychol Bull. 1979; 86: 420–428. PMID:18839484
13. Bland JM, Altman DG. Statistical methods for assessing agreement between two methods of clinical measurement. Lancet. 1986; 1: 307–310. PMID:2868172
14. Saba L, Mallarini G. A comparison between NASCET and ECST methods in the study of carotids: eval-uation using Multi-Detector-Row CT angiography. Eur J Radiol. 2010; 76: 42–47. doi:10.1016/j.ejrad. 2009.04.064PMID:19464837
15. Eliasziw M, Smith RF, Singh N, Holdsworth DW, Fox AJ, Barnett HJ. Further comments on the mea-surement of carotid stenosis from angiograms. North American Symptomatic Carotid Endarterectomy Trial (NASCET) Group. Stroke. 1994; 25: 2445–2449. PMID:7974588
16. Huang J, Degnan AJ, Liu Q, Teng Z, Yue CS, Gillard JH, et al. Comparison of NASCET and WASID cri-teria for the measurement of intracranial stenosis using digital subtraction and computed tomography angiography of the middle cerebral artery. J Neuroradiol. 2012; 39: 342–345. doi:10.1016/j.neurad. 2011.11.005PMID:22197402
17. Rothwell PM, Gibson RJ, Slattery J, Sellar RJ, Warlow CP. Equivalence of measurements of carotid stenosis. A comparison of three methods on 1001 angiograms. European Carotid Surgery Trialists' Col-laborative Group. Stroke. 1994; 25: 2435–2439. PMID:7974586
18. Zhu XJ, Du B, Lou X, Hui FK, Ma L, Zheng BW, et al. Morphologic characteristics of atherosclerotic mid-dle cerebral arteries on 3T high-resolution MRI. AJNR Am J Neuroradiol. 2013; 34: 1717–1722. doi:10. 3174/ajnr.A3573PMID:23639560
19. Nederkoorn PJ, Elgersma OE, Mali WP, Eikelboom BC, Kappelle LJ, van der Graaf Y. Overestimation of carotid artery stenosis with magnetic resonance angiography compared with digital subtraction angi-ography. J Vasc Surg. 2002; 36: 806–813. PMID:12368742
20. Staikov IN, Arnold M, Mattle HP, Remonda L, Sturzenegger M, Baumgartner RW, et al. Comparison of the ECST, CC, and NASCET grading methods and ultrasound for assessing carotid stenosis. Euro-pean Carotid Surgery Trial. North American Symptomatic Carotid Endarterectomy Trial. J Neurol. 2000; 247: 681–686. PMID:11081806
21. Famakin BM, Chimowitz MI, Lynn MJ, Stern BJ, George MG, WASID Trial Investigators. Causes and severity of ischemic stroke in patients with symptomatic intracranial arterial stenosis. Stroke. 2009; 40: 1999–2003. doi:10.1161/STROKEAHA.108.546150PMID:19407228