RESEARCH ARTICLE
Norms for 150 consumer products:
Perceived complexity, quality objectivity,
material/experiential nature, perceived price,
familiarity and attitude
Filipe LoureiroID1*, Teresa Garcia-Marques1, Duane T. Wegener2
1 William James Center for Research, ISPA- Instituto Universita´ rio, Lisboa, Portugal, 2 The Ohio State University, Columbus, Ohio, United States of America
Abstract
Consumer products are widely used as stimuli across several research fields. The use of consumer products as experimental stimuli lacks, however, the support of normative data regarding product features variability. In this work, we provide a first set of norms for peo-ple’s perceptions of 150 consumer products regarding six relevant dimensions: product per-ceived complexity, quality objectivity, material/experiential nature, perper-ceived price,
familiarity and attitude. Products available in this normative database showed good overall distribution across the range of the dimensions evaluated. Obtained correlations between some of these dimensions provided evidence of how they can be confounded across prod-ucts, further justifying the need to control for these dimensions. These norms should aid future research by allowing researchers to select products according to specific attributes and achieve appropriate experimental control. The norms here provided should also aid consumer behavior practitioners (such as marketers and advertisers) by providing insights as to how consumers perceive products along relevant dimensions.
Introduction
Consumer products are not only to a great extent present in our daily lives, they have also been the focus of much research conducted on consumer behavior. Typically, research has
addressed the characteristics that make products more or less appealing as well as how these characteristics influence consumers’ lives. Thus, researchers have focused on factors such as consumer products’ country-of-origin (e.g., [1,2]), product consumption as a measure of per-sonal uniqueness (such as the possession of scarce products: e.g., [3–5]; consumer innova-tiveness: e.g., [6,7]; or product customization: e.g., [7], new product adoption (e.g., [8,9] and purchase intentions (e.g., [10]), among others.
Because consumer products are something to which participants can easily relate, these have also been extensively used as experimental stimuli across other research areas: judgment and decision-making (e.g., [11–13]), mere exposure effects (e.g., [14–16]), attitudes and per-suasion (e.g., [17,18]), eye-tracking (e.g., [19,20]), decision preferences (e.g., [21,22]), and
a1111111111 a1111111111 a1111111111 a1111111111 a1111111111 OPEN ACCESS
Citation: Loureiro F, Garcia-Marques T, Wegener
DT (2020) Norms for 150 consumer products: Perceived complexity, quality objectivity, material/ experiential nature, perceived price, familiarity and attitude. PLoS ONE 15(9): e0238848.https://doi. org/10.1371/journal.pone.0238848
Editor: Claudio Soregaroli, Universita´ Cattolica del
Sacro Cuore, ITALY
Received: January 5, 2020 Accepted: August 25, 2020 Published: September 21, 2020
Peer Review History: PLOS recognizes the
benefits of transparency in the peer review process; therefore, we enable the publication of all of the content of peer review and author responses alongside final, published articles. The editorial history of this article is available here:
https://doi.org/10.1371/journal.pone.0238848
Copyright:© 2020 Loureiro et al. This is an open access article distributed under the terms of the
Creative Commons Attribution License, which permits unrestricted use, distribution, and reproduction in any medium, provided the original author and source are credited.
Data Availability Statement: Data and
supplementary materials are available athttps://osf. io/j5v8p/.
memory (e.g., [23,24]; see [25]), among others. Researchers from these fields have the need to control their experimental stimuli in order to guarantee the validity of their operationaliza-tions. Such control can be attained either by extensive pretesting of materials or reliance on general norms published in the literature (i.e., norms for people’s shared perceptions of fea-tures specific to particular stimuli).
Our goal here is to share with the scientific community a normative dataset for people’s per-ceptions of several consumer products regarding relevant dimensions. This work should con-tribute to a faster development of appropriate operationalizations that correspond to
conceptual variables addressed by a number of theoretical approaches in the extant literature (e.g., theories of consumer perception, choice and behavior). We thus aim to address the oper-ational gap between theories to be tested and the stimuli that might be used to address the con-ceptual variables addressed by the theories.
Such a goal arises from the fact that the widespread use of consumer products as experi-mental stimuli lacks the support of normative data that organizes and presents a set of relevant product features.
Our approach in the present work is the same followed in many research areas, wherein norms have been developed to allow researchers to select stimuli according to specific attri-butes in order to achieve appropriate experimental control (see [26]). The present normative database will support future research efforts to avoid the interference of confounding factors concerning consumer product dimensions, allowing researchers to select product stimuli in a way that controls for these features.
Besides providing a valuable research resource, these consumer product norms may also offer consumer behavior practitioners (such as marketers and advertisers) insightful informa-tion as to how consumers perceive products along relevant dimensions.
The selection of the consumer product dimensions for this normative study was tied to rele-vant research and theory in the consumer literature. For instance, we rely on research suggest-ing that people’s perceptions of product features, such as perceived product complexity, quality objectivity, and relation to material/experiential purchase goals have a strong impact on their purchase decision-making styles (e.g., [21,22,27(manuscript in preparation)]). Bel-low, we review each of these dimensions regarding their relevance and operationalizations across the existing literature.
We first define what “consumer products” are and then provide an overview of the litera-ture that informs researchers and practitioners about the relevant dimensions along which people tend to evaluate these products.
Consumer products as multiple dimensional percepts
Consumer products are defined as products and services bought by final consumers for their personal use [28,29]. Consumer products include physical objects that can be offered for acquisition, use and consumption that might satisfy a want or a need. Services are products that consist of activities, benefits, or satisfactions that are essentially intangible [29]. Consumer products can be PCs, foods, cars, etc., and services include hotel stays, experiences, banking, insurance, etc.
These products are multidimensional percepts, and each of their dimensions likely influ-ences how consumers relate with them. We first review some of the consumer product dimen-sions that have been the focus of research attention (seeFig 1) before operationalizing them in our normative study.
1. Product complexity. Perceived complexity has been methodologically operationalized
in terms of the number of attributes that compose a product. For instance, products have been
Funding: This work was supported by FCT
(Fundac¸ão para a Ciência e a Tecnologia) under grants SFRH/BD/110316/2015 awarded to Filipe Loureiro and UIDB/04810/2020.
Competing interests: The authors have declared
described as complex when they are characterized by a large number of attributes that are rele-vant for the purchase decision [30]. Similarly, Netzer and Srinivasan [31] described products and services as complex when they are composed by ten or more attributes. According to Dijk-sterhuis ([32]; see also [33,34]), complexity is defined by the amount of information and facets a choice entails, meaning that a choice between products for which many attributes are important is complex, whereas a choice between products for which few attributes are important is simple. Researchers have measured product complexity by assessing the number of attributes that can objectively characterize a product (e.g., [31,35,36]), by asking participants how many aspects of the product they would take into account when making a purchase decision [34] or by asking participants how complex they perceived the product on a “simple/not complex– complex” scale (e.g., [37–39]). Researchers have manipulated complexity by manipulating the number of attributes describing a product (e.g., [34,40]).
Product complexity is an important dimension of consumer products. Research on product complexity has provided evidence that: people are more willing to read instructions about
Fig 1. Consumer product dimensions.
more complex products (e.g., [38]) and to actually read the instructions longer [41] when the product is relatively complex rather than simple. Consumers also prefer to choose complex products on the basis of rational analysis and simple products on the basis of intuition [22,27 (manuscript in preparation)], but are more satisfied with their purchases after choosing com-plex products intuitively and simple products conscientiously [32,34,42].
2. Quality objectivity. Product quality has been theoretically and empirically defined in
many different ways in the literature. Some definitions focus on product quality as something measurable and usually expressed by measurable product features (e.g., [43,44]). Other defini-tions focus onconsumers’ perceptions of quality, defining it as the consumer’s judgment about
a product’s overall excellence and superiority (e.g., [45–48]), the customer’s perception of the overall quality of a product, with respect to its intended purpose, in relation to alternatives [49], or as the degree to which a product or service fits the customer’s needs and expectations (e.g., [50,51]).
For the purposes of the norms here presented, we focus on people’sperceptions of how a
product’s quality can be evaluated on the basis ofobjective versus subjective dimensions.
Whereasobjective product quality refers to the product’s actual performance, reliability,
dura-bility and serviceadura-bility–that is, objective facts and data—(e.g., [52,53]),subjective product quality is reflected by consumers perceptions of subjective attributes and personal tastes,
opin-ions and preferences [48,54–56].
To the best of our knowledge, only one study, conducted by Inbar and colleagues [22], has measured participants’ perceptions of choice quality objectivity. Specifically, in this study par-ticipants were asked to rate 25 choices in terms of the extent to which evaluation of the out-come was an objective or a subjective matter. Despite the fact that little is known about the impact of people’s perceptions of choice quality objectivity, existing evidence supports the importance of controlling for such a dimension. Specifically, Inbar and colleagues [22] found that choices with objectively evaluable outcomes led participants to prefer to make their deci-sions in a rational way, whereas choices with subjectively evaluable outcomes led participants to prefer to make their decisions based on their intuitions. This result has important implica-tions for what kinds of advertisements or information might be effective in advocating pur-chases of particular kinds of products and for what kinds of settings might enhance versus detract from the effectiveness of such influence attempts.
3. Material versus experiential nature of products and purchases. A substantial amount
of empirical work has focused on distinguishing material from experiential products and pur-chases. Van Boven and Gilovich [57] theoretically defined material products as tangible and material purchases as aimed at acquiring a product that one will keep in their possession. That is, material purchases involve products that one acquires with the intention of obtaining and having a physical good. Examples of material goods include cars, houses, and furniture. In contrast, experiential products are not tangible, and experiential purchases are made with the primary intention of acquiring an experience–an event through which one lives. Purchases of concert tickets, dining at restaurants, taking vacations, and visiting amusement parks are examples of experiential purchases.
The material-experiential distinction can be represented in a continuum by relying on con-sumers’ personal intentions and motivations for the purchase [57]. For some purchases, delin-eating a distinction between experiences and material possessions may be difficult, but research suggests that participants and judges alike are able to identify the differences in these categories and reliably categorize purchases as material or experiential (e.g., [57,58]) as well as rate them on the material-experiential continuum [59,60]. Further justifying the importance of controlling for the material-experiential dimensions in consumer products and similar to results obtained regarding perceived product complexity and people’s preferences for intuition
and rationality [22], research has shown that people tend to weight intuition more heavily with regards to experiential purchases and weight deliberation more heavily when making material purchases [21].
Documenting the relevance of this dimension, research on the distinction between material and experiential purchases has shown, among other findings, that experiential purchases make people happier than material purchases (e.g., [57]), experiences tend to be more closely associ-ated with the self than possessions [61], and the evaluation of experiences is less comparative than that of possessions [58]. Also, whereas material purchase decisions are more likely to lead to buyer’s remorse, experiential purchase decisions are more likely to lead to regrets of missed opportunities [62].
4. Perceived price. The price of a product represents the amount of expenditure in a
pur-chase transaction [63]. According to Jacoby and Olson [64], price can be categorized into objective and perceived price. Whereas objective price corresponds to a product’s actual mon-etary cost, perceived price is defined as the consumer’s subjective perceptions [64] and feelings [48] regarding the price of a product. Perceived price has also been defined as what the con-sumer sacrifices in order to obtain a product or service [48,65–67].
Perceived price relates to consumers’ judgments of performance (e.g., [48]) and judgments of product quality (e.g., [68,69]). Perceived price fairness positively influences consumer trust [70], purchase decisions (e.g., [70,71]) and repurchase intentions (e.g., [72,73]). Perceived price also moderates the relation between quality of food and customer satisfaction [74]. Finally, increases in the perceived price of drinks increases subjective reports and neurological (fMRI) evidence of flavor pleasantness [75].
Consumers often compare the objective price with an overall prince range they perceive for the product category [76]. Research shows that consumers do not always know or remember the objective price of a product or service. Rather, they encode the price in ways that are mean-ingful to them [77]. Hence, consumers tend to remember the price of a product as “cheap” or “expensive” rather than as the dollar amount [78]. Accordingly, researchers have measured perceived price simply by asking participants to assess how inexpensive-expensive (e.g., [78–
81]) or pricey-not pricey (e.g., [79,81]) products are.
Perceived price is also a relevant variable to control in research due to its intrinsic associa-tion with product perceived complexity. The more a product is perceived as relatively complex the higher its perceived price [22]. Consequently, when manipulating perceived complexity, unless precautions are taken, researchers are also manipulating perceived price.
5. Product familiarity. Product familiarity is defined as the level of previous direct and
indirect usage experience accumulated by the consumer (e.g., [82,83]). Researchers have mea-sured product familiarity by asking participants how familiar-unfamiliar they are with a given product (e.g., [84–86]) or the features of that product [85,87].
A large amount of work has provided evidence of how product familiarity influences the way consumers process information and make decisions. For instance, product familiarity influences search for product information, depth of processing of such information, and choice confidence in decision-making [82,88]. More specifically, higher levels of product familiarity lead to the simplification of information processing through the use of nonfunc-tional cues (such as country of origin, brand, price) as heuristics to infer intrinsic product attri-butes, leading to more confidence in and reliance on such cues [89,90]. Product familiarity is also negatively associated with willingness to look for and read warnings [91,92] and positively associated with purchasing behavior (e.g., [93]).
Another dimension closely related to product familiarity is purchase frequency. In fact, research has combined measures of how familiar people are with certain products along with how frequently they buy these products in order to create a product familiarity index (e.g.,
[84,86]). Despite being associated, the use of both measures as an index of product familiarity might be problematic for some products (e.g., one might be extremely familiar with razor blades and its features but only so often purchase such a product). To that extent, in the pres-ent examinations, we measured both product familiarity and purchase frequency and sepa-rately present the norms for both dimensions.
6. Product attitude. The term attitude refers to an overall evaluation of a particular target,
such as people, issues and objects (e.g., [94,95]). Accordingly, product attitude has been gener-ally defined as an overall evaluation of a particular product in a favorable or unfavorable man-ner (e.g., [96]). Researchers have measured product attitude by asking participants about how much they like the product, feel positive/negative towards it (e.g., [97–100]), and how good/ bad and desirable/undesirable (e.g., [97,100]) the product is.
Most research on product attitudes has focused on this variable as an outcome. For instance, research has shown that product attitude is influenced by factors such as country of origin (e.g., [101]), packaging (e.g., [102]), tactile and visual inputs [103], peer communication [100], online reviews [104], and use of narrative online advertisement [105], among other find-ings. However, product attitude has also been identified as a predictor for relevant outcomes, such as purchase intentions (e.g., [100,106–109] and actual purchase behavior (e.g., [110]). Product attitude is clearly a key dimension of consumer products. When aiming to control for product features in research, researchers could greatly benefit from having an a priori indica-tor of how people evaluate different consumer products in a favorable or unfavorable manner.
Development of consumer product norms
The above literature review demonstrates a number of relevant dimensions along which these products can be evaluated. Based on this evidence, we developed a descriptive study that aims to provide a set of norms for people’s perceptions of a pool of 150 consumer products on each of these dimensions. The products in this normative study were selected with the goal of including products that are spread across much if not all of the rating range for each dimension (i.e., prod-ucts perceived as high and low on each of the dimensions evaluated). We also analyze how the dimensions relate to each other across all products, allowing for a further analysis of how choices based on a single dimension can lead to confounds with other related dimensions.
Method
Participants
A sample of 389 North-American participants (48.3% females;Mage= 37.24,SD = 13.38) was
obtained through online recruitment on Prolific Academic. All participants’ native language was English, and they were living in the United States at the time of their participation.
Ethics statement
This research was approved by the Research Ethics Committee at ISPA–Instituto Universi-ta´rio, Lisbon, Portugal (approval number #D/006/10/2018). All participants provided consent by choosing to agree with the provided information about the study, prior to beginning the survey.
Stimuli
A list of 150 consumer products (word stimuli) was assembled based on 1) products that had previously been classified along the perceived dimensions by previous research (e.g., complex-ity: [21,34]) and 2) products found on catalogs from several major store chains. The full list
can be consulted in theS1 Fileand includes products such as food, clothing, electronics, household products, experiences and services.
To prevent task fatigue and demotivation, each participant evaluated 54 products from the total list of 150 products for one of the six dimensions described. From those 54 products, partici-pants first evaluated a set of 6 calibration products that spanned the range of the single dimension evaluated. These calibration items were presented first with the aim of providing participants a sense of the range of the stimuli to be evaluated on that dimension (e.g., [111–113]). After evaluat-ing the calibration products, participants were presented with a random list of 48 additional prod-ucts (From the total of 150 prodprod-ucts, 6 calibration prodprod-ucts were chosen to represent the range of values for that dimension and were used to start the ratings, leaving a total of 144 non-calibration products. Three lists of 48 products (144/3) were randomly created for each dimension. Partici-pants were randomly assigned to one of these lists and one of the dimensions, and they evaluated the 48 products plus the 6 calibrators, resulting in a total of 54 products).
The calibration products for each dimension (presented inTable 1and bolded in Tables 1–6 of theS1 File) were selected based on previous research and pre-testing (e.g., perceived complexity: [22,34]; quality objectivity: [22]; material/experiential purchase: [21,114]). In total, ratings were collected for 150 products, with each product rated by at least 20 participants (the 6 calibration products were rated by all participants). The average number of participant rat-ings per product was 23.3.
Procedure and measures
We created an online survey using the Qualtrics survey platform. After providing informed consent to participate in the study, participants learned that the purpose of this research was to investigate people’s perceptions of consumer products and experiences. Initial instructions indicated that their participation would involve rating a set of 54 consumer products and expe-riences with regard to a specific dimension.
After instructions, participants first evaluated the set of six calibration products, followed by ratings of 48 products on the same dimension. Product labels were individually displayed in a ran-dom order at the center of the screen with the dimension response scale presented on the same screen below the product label. Participants rated each product on all three items for the dimen-sion before advancing to the next product. No time limits were imposed on responses, and partici-pants were told that there were no correct or incorrect answers and that their personal opinion was of particular interest to the researchers. Participants rated each product by choosing the num-ber that best corresponded to their evaluation of the product for the given dimension.
Before evaluating the products, participants were given a brief description of what the dimension being evaluated entailed. We provided this description with the aim of having all participants interpret the assessed dimensions the same way. These brief descriptions, as well as the response items used to evaluate the products on each dimension, are presented in
Table 1. We based the descriptions and items on previous work and the literature reviewed. We used three items to measure each dimension for reliability purposes and in order to con-trol for the possibility of these dimensions being multidimensional. By calculating the internal consistency of the three items for each dimension across the products we can examine how consistently the items tap into the proposed dimensions.
Results
Dimension evaluations
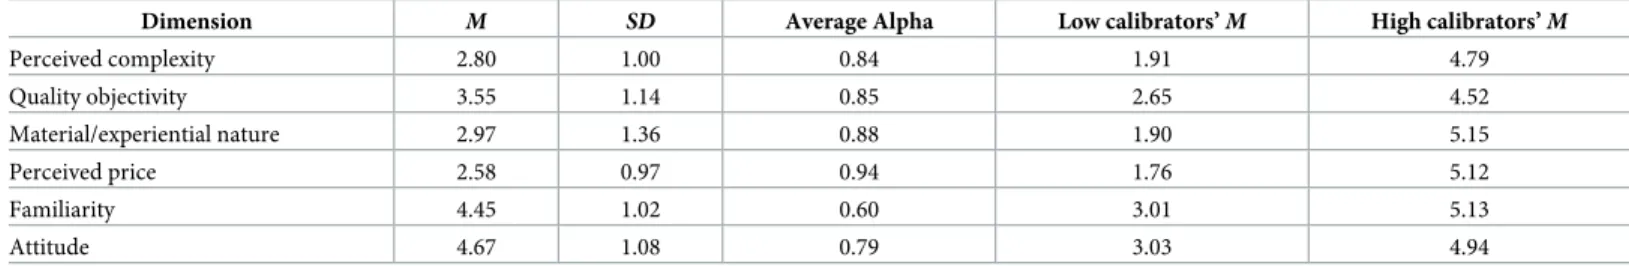
We started by analyzing participants evaluations regarding each of the 6 dimensions across all products.Table 2presents the mean ratings across products for each dimension and the
Table 1. Initial brief descriptions and items used for each dimension.
Dimension Initial instruction Calibration
products
Items:
Perceived complexity
Some products/goods are relatively simple and have very few important aspects affecting their quality. These tend to be rather unidimensional. Other products/goods are more complex and have many core aspects affecting their quality. These tend to be relatively multidimensional. With this in mind, in this study, you will rate 54 consumer products regarding your own perceptions of complexity of these products.
High calibrators: • Car • Desktop computer • Room (renting) Low calibrators: • Umbrella • Dishwashing brush • Oven mitts
1. How complex is this product? (1-Very simple; 6-Very complex)
2. How many aspects of this product could you take into account when making a purchase decision? (1–1 aspect; 2–2–3 aspects; 3–3–5 aspects; 4–5–7 aspects; 5–7–9 aspects; 6–10 or more aspects; based on [34])
3. To what extent is this product relatively unidimensional or relatively multidimensional? (1-Relatively unidimensional; 6-Relatively multidimensional; based on [21]) Quality objectivity For some products/goods, one can objectively quantify whether their
quality is good or bad. In these cases, the product’s quality is based on facts. For other products/goods, whether a product’s quality is good or bad is a subjective matter, depending on personal taste. In these cases, the quality of the product is merely a matter of opinion.
With this in mind, in this study, you will rate 54 products regarding your own perceptions of how objective these products’ qualities are.
High calibrators: • Paper clips • Hangers • Medical treatment Low calibrators • Vacation package • Dessert at a restaurant • Entre´e at a restaurant
1. To what extent is the evaluation of this product’s qualities a subjective or an objective matter? (1-Mainly a subjective matter; 6-Mainly an objective matter; based on [22])
2. To what extent does the quality of this product depend on a personal taste or is objectively the same for everyone?
(1-Quality depends on personal taste; 6-Quality is objective and the same for everyone)
3. To what extent is the quality of this product a matter of opinion or a function of facts? (1-Quality is a matter of opinion; 6-Quality is a function of facts)
Material/ experiential purchase
Some purchases are material, tangible and purchased with the intention of acquiring and having a physical good. Other purchases are
experiential, reflecting events that are lived through and purchased with the intention of acquiring experiences (i.e., with doing something). With this in mind, in this study, you will rate 54 products regarding your own perceptions of these products’ experiential or materialistic characteristics. High calibrators: • Vacation package • Museum ticket • Dinner at a restaurant Low calibrators: • Suit • Necklace • Vase
1. To what extent is the purchase of this product a material purchase or an experiential purchase? (1-Definitely material; 6-Definitely experiential; based on [115])
2. To what extent does the purchase of this product emphasize possession of an object or experiencing an activity?
(1-Definitely emphasis on possession; 6-Definitely emphasis on experiencing)
3. To what extent is the purchase of this product focused on having or focused on doing?
(1-Definitely focused on having; 6-Definitely focused on doing)
Perceived Price A product’s price is the amount of expenses incurred in purchase transactions. While a product’s objective price represents the actual price of the product, perceived price is the subjective perception people have of the objective price of a product. While people do not always remember the exact price of a specific product or service, they may remember the price as relatively “cheap” or “expensive”. With this in mind, in this study, you will rate 54 products regarding your own subjective perceptions of these products’ prices.
High calibrators: • House • Car • Cruise trip Low calibrators: • Dishwashing brush • Pen • Paper clips
1. How expensive is this product?
(1-Very inexpensive; 6-Very expensive; (based on [78–81])
2. How pricey is this product?
(1-Not pricey at all; 6-Very pricey; based on [79,81]) 3. How high is this product’s price?
1-Very low; 6-Very high; based on [79,81])
Familiarity People may have different levels of familiarity with different products/ goods. For instance, a person may have a lot of prior experience with a type of product or purchase it very frequently. Conversely, a person may be less familiar with a given product or its features, or buy it less frequently. With this in mind, in this study, you will rate 54 consumer products regarding your own levels of familiarity with these products.
High calibrators: • Shampoo • Breakfast cereal • Chewing gum Low calibrators: • Life insurance • Cruise trip • 3D printer
1. How familiar are you with this product? (1-Not at all familiar; 6-Extremely familiar; based on [84–86])
2. How familiar are you with the features of this product?
(1-Not at all familiar; 6-Extremely familiar; based on [85,87])
3. How frequently do you buy this product? (1-Never; 6-Very frequently; based on [84,86]) Attitude People have different attitudes and feelings towards different products
and services. On this basis, in this study, you will rate 54 products regarding your own evaluations of how much you like these products.
High calibrators: • Ice cream • Vacation package • Massage Low calibrators: • Toilet brush • Insecticide • Cigarettes
1. How positive do you feel about this product? (1-Not positive at all; 6-Very positive; based on [98,99])
2. How negative do you feel about this product? (reverse-coded)
(1-Not negative at all; 6-Very negative; [98,99]) 3. How much do you like this product?
(1-I don´t like this product at all; 6-I like this product very much; based on [98,99])
respective standard deviations. The table also presents the average internal consistency of the three items used for each dimension across products, and the average means for the low and high calibration products used for each dimension.
Average Cronbach alphas suggested good internal consistency of the items used to evaluate each dimension. The internal consistency of items used to evaluate product familiarity was lower in comparison to the other dimensions, however, suggesting that product familiarity and purchase frequency might reflect different dimensions. The mean value for each of the three items is presented individually for all products in theS1 File(Tables 1–6 inS1 File), not only for the familiarity/acquisition frequency dimension but also for the five other dimensions. This allows researchers not only to make use of the average of the three items but also to use of the mean values for each item.
By observing the average means inTable 2for the low and high calibration products used for each dimension, we see that the calibration items fulfilled their goal of providing partici-pants a sense of the range of the dimension evaluated, by being rated as considerably lower and higher, respectively, in comparison to the average means across all products.
InTable 3, we present a list of the 5 products with the most extreme positive and negative mean ratings on each dimension. These average ratings show a good distribution across the range in their different dimensions.Fig 2presents the frequency distributions of ratings for all products for each of the six dimensions. These further confirm that the products show an over-all variation across the whole range of the dimensions evaluated, with the exception of the atti-tude dimension, for which most products were rated positively (an issue with potentially negative products is that they do not remain available for long–or never make it to market–so using existing products might always skew toward mostly positive attitudes). The distributions inFig 2allow us to conclude that, for each dimension, we largely fulfilled our aim of obtaining products that were perceived across the whole range of the dimensions evaluated.
Correlations between dimensions
Next, we computed correlations among the six dimensions across the evaluations of all 150 products, using products as the unit of analysis (i.e., correlating the mean values for each prod-uct’s features). Overall, the results showed significant correlations between the dimensions (see
Table 4). The stronger correlations show that: 1) perceived complexity correlated positively with perceived higher price; 2) the more products were perceived as experiential the less their quality was perceived as an objective matter; and 3) product familiarity correlated negatively with product perceived complexity and price and positively with product attitude favorability.
Discussion
In this paper, we provide norms for people’s perceptions of 150 consumer products on six rele-vant dimensions: perceived complexity, quality objectivity, material/experiential nature,
Table 2. Descriptive statistics of mean dimension ratings.
Dimension M SD Average Alpha Low calibrators’M High calibrators’M
Perceived complexity 2.80 1.00 0.84 1.91 4.79 Quality objectivity 3.55 1.14 0.85 2.65 4.52 Material/experiential nature 2.97 1.36 0.88 1.90 5.15 Perceived price 2.58 0.97 0.94 1.76 5.12 Familiarity 4.45 1.02 0.60 3.01 5.13 Attitude 4.67 1.08 0.79 3.03 4.94 https://doi.org/10.1371/journal.pone.0238848.t002
perceived price, familiarity and attitude. To our knowledge, this the first available consumer products normative database assessing these dimensions.
The products in this normative database showed a good overall distribution across the rat-ing range of the dimensions evaluated. We thus fulfilled our secondary aim of obtainrat-ing prod-ucts perceived as relatively high and low on these dimensions.
Correlations between dimensions across all products replicate evidence from the previous literature where relevant pairs of dimensions have been examined (e.g., [22], for the perceived complexity-price association; [56], for the experientiality-quality objectivity association). These results provide further evidence that using one dimension to choose stimuli can create a set of stimuli that confounds the dimension used to choose the stimuli with one or more other product dimensions, further justifying the need to control for these alternative dimensions.
Table 3. Products with the most extreme mean ratings per dimension (mean ratings in brackets).
Perceived complexity Quality objectivity Mat/exp. nature Perceived price Familiarity Attitude
Car (5.12) Trash bin (4.98) Massage (5.64) House (5.48) Toilet paper (5.62) Television (5.36)
House (5.12) Aspirin (4.97) Cruise trip (5.56) Car (5.11) Bread (5.61) Pillow (5.30)
Convertible laptop (5.10) Trash bag (4.92) Vacation package (5.40) Medical treatment (4.90) Pizza (5.58) Soap (5.25)
Laptop (5.08) Scissors (4.92) Museum ticket (5.27) Cruise trip (4.76) Soap (5.54) Desktop (5.25)
Smartphone (4.98) DVD player (4.82) Concert ticket (5.22) Vacation package (4.73) Toothpaste (5.43) Air conditioner (5.24) Trash bags (1.52) Breakfast cereal (2.02) Laptop bag (1.70) Postcard (1.40) Motorcycle (3.06) Motorcycle (3.57) Cleaning cloth (1.45) Ice cream (1.97) Table (1.70) Yogurt (1.33) Cruise trip (2.81) Soft drink (3.49)
Coasters (1.45) Whiskey (1.97) Underwear (1.59) Soap (1.32) Nature park ticket (2.80) Disposable plastic cups (3.35)
Hangers (1.43) Tea (1.97) Wall clock (1.53) Air freshener (1.32) 3D printer (2.56) Insecticide (3.22)
Toilet brush (1.38) Chocolate bar (1.80) Trash bin (1.52) Chewing gum (1.25) Power bank (2.41) Cigarettes (2.07)
https://doi.org/10.1371/journal.pone.0238848.t003
Fig 2. Distribution of ratings across products for each of the 6 dimensions.
The norms here presented were obtained with North-American participants. As with other normative databases, generalizations to other populations and cultures should be made with caution and cross-validation is recommended. For instance, product familiarity is an impor-tant dimension to take into account in cross-cultural studies. For example, food products can be differently perceived depending on the consumers’ western and eastern cultural back-grounds (e.g., [116,117]). Similarly, differences in perceived prices may be observed when examining products across different countries and cultures. Therefore, future research should consider extending these norms to other countries/cultures.
Additionally, we did not measure individual differences in participants’ consumption behaviors or preferences. For example, individual differences in preferences for more material items or life experiences [118], green purchasing behavior (e.g., [119]) and hedonic/utilitarian purchase motivations (e.g., [120,121]) might influence consumers’ perceptions of the dimen-sions here assessed, and future researchers might consider controlling for such individual dif-ferences if extending or applying these norms.
Overall, the norms here presented constitute a valuable resource that will allow researchers to select consumer products according to specific attributes and facilitate researchers’ choices aimed at achieving appropriate experimental control. That is, using the dimension values as independent variables can often be done while avoiding confounds with alternative dimen-sions (or at least being aware of some related dimendimen-sions that could inform interpretation of reactions to the chosen stimuli).
To this extent, in addition to theS1 Fileproviding descriptive statistics for all 150 consumer products for each dimension, a user-friendly spreadsheet is made available (see Data Availabil-ity section), that allows researchers to sort (in ascending or descending order) all products for a specific dimension, allowing for a quick examination of the product’s characteristics across all the dimensions.
These norms should also aid consumer behavior practitioners in the sense that they provide insightful information as to how consumers perceive products on a variety of relevant
dimensions.
Supporting information
S1 File.
(DOCX)
Author Contributions
Conceptualization: Filipe Loureiro, Teresa Garcia-Marques, Duane T. Wegener.
Table 4. Correlations between dimensions across all products.
Dimensions 1 2 3 4 5 6 1) Perceived complexity -2) Quality objectivity .05 -3) Material/Experiential nature .18� -.39�� -4) Perceived price .86�� .03 .13 -5) Familiarity -.44�� -.10 -.16� -.55�� -6) Attitude .17� -.10 -.02 .10 .31��
-�. Correlation is significant at the 0.05 level (2-tailed) ��. Correlation is significant at the 0.01 level (2-tailed).
Formal analysis: Filipe Loureiro. Investigation: Filipe Loureiro.
Methodology: Filipe Loureiro, Teresa Garcia-Marques, Duane T. Wegener. Supervision: Teresa Garcia-Marques, Duane T. Wegener.
Writing – original draft: Filipe Loureiro.
Writing – review & editing: Filipe Loureiro, Teresa Garcia-Marques, Duane T. Wegener.
References
1. Peterson RA, Jolibert AJP. A Meta-Analysis of Country-of-Origin Effects. J Int Bus Stud. 1995 Dec 1; 26(4):883–900.
2. Ahmed SA, d’Astous A. Antecedents, moderators and dimensions of country-of-origin evaluations. Int Mark Rev. 2008; 25(1):75–106.
3. Fromkin HL. Effects of experimentally aroused feelings of undistinctiveness upon valuation of scarce and novel experiences. J Pers Soc Psychol. 1970; 16(3):521–9.https://doi.org/10.1037/h0030059
PMID:5497256
4. Lynn WM. The effects of scarcity on perceived value: Investigations of commodity theory [PhD The-sis]. The Ohio State University; 1987.
5. Lynn M. Scarcity effects on value: A quantitative review of the commodity theory literature. Psychol Mark. 1991; 8(1):43–57.
6. Burns DJ. The effects of uniqueness seeking and sensation seeking upon innovative behavior and the adoption process. Kent State University; 1987.
7. Lynn M, Harris J. The desire for unique consumer products: A new individual differences scale. Psy-chol Mark. 1997; 14(6):601–616.
8. Foxall GR. Consumer innovativeness: Novelty-seeking, creativity and cognitive style. Res Consum Behav. 1988; 3:79–113.
9. Im S, Bayus BL, Mason CH. An Empirical Study of Innate Consumer Innovativeness, Personal Char-acteristics, and New-Product Adoption Behavior. J Acad Mark Sci. 2003 Jan 1; 31(1):61–73. 10. Holak SL, Lehmann DR. Purchase Intentions and the Dimensions of Innovation: An Exploratory
Model. J Prod Innov Manag. 1990; 7(1):59–73.
11. Novemsky N, Kahneman D. The Boundaries of Loss Aversion. J Mark Res. 2005 May 1; 42(2):119– 28.
12. Shafir E, Simonson I, Tversky A. Reason-based choice. Cognition. 1993 Oct 1; 49(1):11–36. 13. Tversky A, Kahneman D. Loss Aversion in Riskless Choice: A Reference-Dependent Model. Q J
Econ. 1991 Nov 1; 106(4):1039–61.
14. Nordhielm CL. The Influence of Level of Processing on Advertising Repetition Effects. J Consum Res. 2002 Dec 1; 29(3):371–82.
15. Fang X, Singh S, Ahluwalia R. An Examination of Different Explanations for the Mere Exposure Effect. J Consum Res. 2007 Jun 1; 34(1):97–103.
16. Hekkert P, Thurgood C, Whitfield TWA. The mere exposure effect for consumer products as a conse-quence of existing familiarity and controlled exposure. Acta Psychol (Amst). 2013 Oct 1; 144(2):411– 7.
17. Han S, Shavitt S. Persuasion and Culture: Advertising Appeals in Individualistic and Collectivistic Soci-eties. J Exp Soc Psychol. 1994 Jul 1; 30(4):326–50.
18. Shavitt S, Nelson MR. The social identity function in person perception: Communicated meanings of product preferences. In: Maio GR, Olson JM, editors. Why we evaluate: Function of attitudes. Mah-wah, NJ: Lawrence Erlbaum; 2000. p. 37–58.
19. Chandon P, Hutchinson JW, Bradlow E, Young SH. Measuring the Value of Point-of-Purchase Market-ing with Commercial Eye-TrackMarket-ing Data [Internet]. Rochester, NY: Social Science Research Network; 2006 Jun [cited 2019 Oct 31]. Report No.: ID 1032162. Available from:https://papers.ssrn.com/ abstract=1032162
20. Wedel M, Pieters R. A Review of Eye-Tracking Research in Marketing. In: Malhotra N K., editor. Review of Marketing Research [Internet]. Emerald Group Publishing Limited; 2008 [cited 2020 Jan 4].
p. 123–47. (Review of Marketing Research; vol. 4). Available from: https://doi.org/10.1108/S1548-6435(2008)0000004009
21. Gallo I, Sood S, Mann TC, Gilovich T. The Heart and the Head: On Choosing Experiences Intuitively and Possessions Deliberatively. J Behav Decis Mak. 2017; 30(3):754–68.
22. Inbar Y, Cone J, Gilovich T. People’s intuitions about intuitive insight and intuitive choice. J Pers Soc Psychol. 2010; 99(2):232–47.https://doi.org/10.1037/a0020215PMID:20658841
23. Burke RR, Srull TK. Competitive interference and consumer memory for advertising. J Consum Res. 1988; 15(1):55–68.
24. Langdon P, Lewis T, Clarkson J. The effects of prior experience on the use of consumer products. Univ Access Inf Soc Univers Access Inf Soc Int J. 2007; 6(2):179–91.
25. Mantonakis A, Whittlesea BW, Yoon C. Consumer memory, fluency, and familiarity. In: Handbook of consumer psychology. Routledge; 2008. p. 91–116.
26. Proctor RW, Vu K-PL. Index of norms and ratings published in the Psychonomic Society journals. Behav Res Methods Instrum Comput. 1999 Dec 1; 31(4):659–67.https://doi.org/10.3758/bf03200742
PMID:10633981
27. Loureiro F, Garcia-Marques T, Wegener D. Preference for intuition and analysis: Who, when and why?
28. Cassel EC, Grove JA, Hankins FW, Leopold H, Lovell ND. Fundamental Differences between Indus-trial and Consumer Marketing: IndusIndus-trial Marketing Committee Review Board*. J Mark. 1954 Oct 1; 19 (2):152–8.
29. Kotler P, Armstrong G, Sutherland D, Sutherland J, Svendsen E, Kotler P. Principles of marketing. New Jersey: Pearson Education Inc; 2013.
30. Scholz SW, Meissner M, Decker R. Measuring Consumer Preferences for Complex Products: A Com-positional Approach BasedonPaired Comparisons. J Mark Res. 2010 Aug 1; 47(4):685–98.
31. Netzer O, Srinivasan V. Adaptive Self-Explication of Multiattribute Preferences. J Mark Res. 2011 Feb 1; 48(1):140–56.
32. Dijksterhuis A. Think Different: The Merits of Unconscious Thought in Preference Development and Decision Making. J Pers Soc Psychol. 2004; 87(5):586–98.https://doi.org/10.1037/0022-3514.87.5. 586PMID:15535773
33. Dijksterhuis A, Nordgren LF. A Theory of Unconscious Thought. Perspect Psychol Sci. 2006 Jun 1; 1 (2):95–109.https://doi.org/10.1111/j.1745-6916.2006.00007.xPMID:26151465
34. Dijksterhuis A, Bos MW, Nordgren LF, Baaren RB van. On Making the Right Choice: The Deliberation-Without-Attention Effect. Science. 2006 Feb 17; 311(5763):1005–7.https://doi.org/10.1126/science. 1121629PMID:16484496
35. Hle´dik E. Attribute preference stability for complex products. Mark Menedzsment. 2012; 46(1–2):104– 12.
36. Park Y-H, Ding M, Rao VR. Eliciting Preference for Complex Products: A Web-Based Upgrading Method. J Mark Res. 2008 Oct 1; 45(5):562–74.
37. Cox D, Cox A. The Effect of Arousal Seeking Tendency on Consumer Preferences For Complex Prod-uct Designs. ACR North Am Adv [Internet]. 1994 [cited 2019 Oct 31];NA-21. Available from:http:// acrwebsite.org/volumes/5980/volumes/v21/NA-21
38. WRIGHT P, CREIGHTON P, THRELFALL SM. Some factors determining when instructions will be read. Ergonomics. 1982 Mar 1; 25(3):225–37.
39. Wogalter MS, Brelsford JW, Desaulniers DR, Laughery KR. Consumer product warnings: The role of hazard perception. J Safety Res. 1991 Jun 1; 22(2):71–82.
40. Huber J, Hansen D. Testing the Impact of Dimensional Complexity and Affective Differences of Paired Concepts in Adaptive Conjoint Analysis. ACR North Am Adv [Internet]. 1987 [cited 2019 Oct 31];NA-14. Available from:http://acrwebsite.org/volumes/6676/volumes/v14/NA-14
41. Wiese BS, Sauer J, Ru¨ttinger B. Consumers’ use of written product information. Ergonomics. 2004 Sep 15; 47(11):1180–94.https://doi.org/10.1080/00140130410001695951PMID:15370855
42. Dijksterhuis A, van Olden Z. On the benefits of thinking unconsciously: Unconscious thought can increase post-choice satisfaction. J Exp Soc Psychol. 2006 Sep 1; 42(5):627–31.
43. Abbott L. Quality and Competition. New York: Columbia University Press; 1955. 44. Leffler KB. Ambiguous Changes in Product Quality. Am Econ Rev. 1982; 72(5):956–67.
45. Bei L-T, Chiao Y-C. An integrated model for the effects of perceived product, perceived service quality, and perceived price fairness on consumer satisfaction and loyalty. J Consum Satisf Dissatisfaction Complain Behav. 2001; 14:125–40.
46. Chen Z, Dubinsky AJ. A conceptual model of perceived customer value in e-commerce: A preliminary investigation. Psychol Mark. 2003; 20(4):323–47.
47. Tsiotsou R. The role of perceived product quality and overall satisfaction on purchase intentions. Int J Consum Stud. 2006; 30(2):207–17.
48. Zeithaml VA. Consumer Perceptions of Price, Quality, and Value: A Means-End Model and Synthesis of Evidence. J Mark. 1988; 52(3):2–22.
49. Aaker DA. Managing Brand Equity: Capitalizing on the Value of a Brand Name. Vol. 29. New York: The Free Press; 1991.
50. Gitlow H, Gitlow S, Oppenheim A. Tools and Methods for the Improvement of Quality. Irwin; 1989. 51. Yu H, Fang W. Relative impacts from product quality, service quality, and experience quality on
cus-tomer perceived value and intention to shop for the coffee shop market. Total Qual Manag Bus Excell. 2009 Nov 1; 20(11):1273–85.
52. Curkovic S, Vickery S, Dro¨ge C. Quality-related Action Programs: Their Impact on Quality Perfor-mance and Firm PerforPerfor-mance. Decis Sci. 2000; 31(4):885–902.
53. Garvin DA. What does product quality really mean? Sloan Manage Rev. 1984; 26(1):25–43. 54. Brucks M, Zeithaml VA, Naylor G. Price and brand name as indicators of quality dimensions for
con-sumer durables. J Acad Mark Sci. 2000 Jun 1; 28(3):359–74.
55. Creusen MEH, Schoormans JPL. The Different Roles of Product Appearance in Consumer Choice*. J Prod Innov Manag. 2005; 22(1):63–81.
56. Mudambi SM, Schuff D. What Makes a Helpful Review? A Study of Customer Reviews on Amazon. com [Internet]. Rochester, NY: Social Science Research Network; 2010 [cited 2019 Nov 26]. Report No.: ID 2175066. Available from:https://papers.ssrn.com/abstract=2175066
57. Van Boven L, Gilovich T. To Do or to Have? That Is the Question. J Pers Soc Psychol. 2003; 85 (6):1193–202.https://doi.org/10.1037/0022-3514.85.6.1193PMID:14674824
58. Carter TJ, Gilovich T. The relative relativity of material and experiential purchases. J Pers Soc Psy-chol. 2010; 98(1):146–59.https://doi.org/10.1037/a0017145PMID:20053039
59. Nicolao L, Irwin JR, Goodman JK. Happiness for Sale: Do Experiential Purchases Make Consumers Happier than Material Purchases? J Consum Res. 2009 Aug 1; 36(2):188–98.
60. Pchelin P. In pursuit of happiness: when do purchase experiences live up to expectations? [PhD The-sis]. San Francisco State University; 2011.
61. Carter TJ, Gilovich T. I am what I do, not what I have: The differential centrality of experiential and material purchases to the self. J Pers Soc Psychol. 2012; 102(6):1304–17.https://doi.org/10.1037/ a0027407PMID:22369046
62. Rosenzweig E, Gilovich T. Buyer’s remorse or missed opportunity? Differential regrets for material and experiential purchases. J Pers Soc Psychol. 2012; 102(2):215–23.https://doi.org/10.1037/ a0024999PMID:21843013
63. Raab C, Mayer K, Kim Y-S, Shoemaker S. Price-sensitivity measurement: a tool for restaurant menu pricing. J Hosp Tour Res. 2009; 33(1):93–105.
64. Jacoby J, Olson JC. Consumer response to price: an attitudinal, information processing perspective. In: Wind Y, Greenberg P, editors. Moving Ahead With Attitude Research. Chicago: American Market-ing Association; 1977. p. 73–86.
65. Athanassopoulos AD. Customer Satisfaction Cues To Support Market Segmentation and Explain Switching Behavior. J Bus Res. 2000 Mar 1; 47(3):191–207.
66. Cronin JJ, Brady MK, Hult GTM. Assessing the effects of quality, value, and customer satisfaction on consumer behavioral intentions in service environments. J Retail. 2000 Jun 1; 76(2):193–218. 67. Voß GB, Parasuraman A, Grewal D. The Roles of Price, Performance, and Expectations in
Determin-ing Satisfaction in Service Exchanges. J Mark. 1998 Oct 1; 62(4):46–61.
68. Oh H. Service quality, customer satisfaction, and customer value: A holistic perspective. Int J Hosp Manag. 1999 Mar 1; 18(1):67–82.
69. Quareshi TK. Understanding Consumer Perception of Price-Quality-Value Relationship. 2017; 7. 70. Suhaily L, Darmoyo S. Effect of product quality, perceived price and brand image on purchase
deci-sion mediated by customer trust (study on japanese brand electronic product). J Manaj. 2017 Sep 29; 21(2):179–94.
71. Ahmad A, Noor SM, Wel CAC. Factors influencing consumers’ purchase decision of private label brand products. Int J Econ Pract Theor. 2014; 4(2):101–10.
72. Khan MS, Naumann E, Williams P. Identifying the Key Drivers of Customer Satisfaction and Repur-chase Intentions: An Empirical Investigation of Japanese B2B Services. J Consum Satisf Dissatisfac-tion Complain Behav. 2012 Jan 1; 25:159.
73. Moslehpour M, Wong W-K, Pham KV, Aulia CK. Repurchase intention of Korean beauty products among Taiwanese consumers. Asia Pac J Mark Logist. 2017 Jan 1; 29(3):569–88.
74. Ryu K, Han H. Influence of the Quality of Food, Service, and Physical Environment on Customer Satis-faction and Behavioral Intention in Quick-Casual Restaurants: Moderating Role of Perceived Price. J Hosp Tour Res. 2010 Aug 1; 34(3):310–29.
75. Plassmann H, O’Doherty J, Rangel A. Orbitofrontal Cortex Encodes Willingness to Pay in Everyday Economic Transactions. J Neurosci. 2007 Sep 12; 27(37):9984–8.https://doi.org/10.1523/ JNEUROSCI.2131-07.2007PMID:17855612
76. Winer RS. A Reference Price Model of Brand Choice for Frequently Purchased Products. J Consum Res. 1986 Sep 1; 13(2):250–6.
77. Zeithaml VA. Consumer Response to In-Store Price Information Environments. J Consum Res. 1982 Mar 1; 8(4):357–69.
78. Dodds WB, Monroe KB, Grewal D. Effects of Price, Brand, and Store Information on Buyers’ Product Evaluations. J Mark Res. 1991 Aug 1; 28(3):307–19.
79. Oh H. The Effect of Brand Class, Brand Awareness, and Price on Customer Value and Behavioral Intentions. J Hosp Tour Res. 2000 May 1; 24(2):136–62.
80. Jeng S-P, Huang L-S, Chou Y-J, Teng C-I. Do Consumers Perceive Money-Back Guarantees as Believable? The Effects of Money-Back Guarantee Generosity, Store Name Familiarity, and Per-ceived Price. Serv Sci. 2014 Sep 1; 6(3):179–89.
81. Chua B-L, Lee S, Goh B, Han H. Impacts of cruise service quality and price on vacationers’ cruise experience: Moderating role of price sensitivity. Int J Hosp Manag. 2015 Jan 1; 44:131–45. 82. Alba JW, Hutchinson JW. Dimensions of Consumer Expertise. J Consum Res. 1987 Mar 1; 13
(4):411–54.
83. Johnson EJ, Russo JE. Product Familiarity and Learning New Information. J Consum Res. 1984 Jun 1; 11(1):542–50.
84. Darley WK, Smith RE. Advertising Claim Objectivity: Antecedents and Effects. J Mark. 1993 Oct 1; 57 (4):100–13.
85. Coupey E, Irwin JR, Payne JW. Product Category Familiarity and Preference Construction. J Consum Res. 1998 Mar 1; 24(4):459–68.
86. Freling TH, Forbes LP. An empirical analysis of the brand personality effect. J Prod Brand Manag. 2005 Jan 1; 14(7):404–13.
87. Zhou KZ, Nakamoto K. How do enhanced and unique features affect new product preference? The moderating role of product familiarity. J Acad Mark Sci. 2007 Mar 1; 35(1):53–62.
88. Laroche M, Kim C, Zhou L. Brand familiarity and confidence as determinants of purchase intention: An empirical test in a multiple brand context. J Bus Res. 1996 Oct 1; 37(2):115–20.
89. Heimbach AE, Johansson JK, MacLachlan DL. Product Familiarity, Information Processing, and Country-Of-Origin Cues. ACR North Am Adv [Internet]. 1989 [cited 2019 Oct 31];NA-16. Available from:http://acrwebsite.org/volumes/6947/volumes/v16/NA-16
90. Park CW, Lessig VP. Familiarity and Its Impact on Consumer Decision Biases and Heuristics. J Con-sum Res. 1981 Sep 1; 8(2):223–30.
91. Godfrey SS, Laughery KR. The Biasing Effects of Product Familiarity on Consumers’ Awareness of Hazard. Proc Hum Factors Soc Annu Meet. 1984 Oct 1; 28(5):483–6.
92. WOGALTER MS, BARLOW T, MURPHY SA. Compliance to owner’s manual warnings: influence of familiarity and the placement of a supplemental directive. Ergonomics. 1995 Jun 1; 38(6):1081–91. 93. Choo H, Chung J, Thorndike PD. Antecedents to new food product purchasing behavior among
innovator groups in India. Eur J Mark. 2004 Jan 1; 38(5/6):608–25.
94. Petty RE, Cacioppo JT, Schumann D. Central and Peripheral Routes to Advertising Effectiveness: The Moderating Role of Involvement. J Consum Res. 1983 Sep 1; 10(2):135–46.
95. Petty RE, Wegener DT. Attitude change: Multiple roles for persuasion variables. In: Gilbert D, Fiske S, Lindzey G, editors. The handbook of social psychology. New York: McGraw-Hill; 1998. p. 323–39. 96. Kim H-S. Consumer response toward apparel products in advertisements containing environmental
claims. Retrosp Theses Diss [Internet]. 1995 Jan 1; Available from:https://lib.dr.iastate.edu/rtd/10919
97. Crites SL, Fabrigar LR, Petty RE. Measuring the Affective and Cognitive Properties of Attitudes: Con-ceptual and Methodological Issues. Pers Soc Psychol Bull. 1994 Dec 1; 20(6):619–34.
98. Leclerc F, Schmitt BH, Dube´ L. Foreign Branding and Its Effects on Product Perceptions and Attitudes. J Mark Res. 1994 May 1; 31(2):263–70.
99. Cui AP, Fitzgerald MP, Donovan KR. Extended self: implications for country-of-origin. J Consum Mark. 2014 Jan 1; 31(4):312–21.
100. Wang X, Yu C, Wei Y. Social Media Peer Communication and Impacts on Purchase Intentions: A Con-sumer Socialization Framework. J Interact Mark. 2012 Nov 1; 26(4):198–208.
101. Bilkey WJ, Nes E. Country-of-Origin Effects on Product Evaluations. J Int Bus Stud. 1982 Mar 1; 13 (1):89–100.
102. Becker L, van Rompay TJL, Schifferstein HNJ, Galetzka M. Tough package, strong taste: The influ-ence of packaging design on taste impressions and product evaluations. Food Qual Prefer. 2011 Jan 1; 22(1):17–23.
103. Balaji MS, Raghavan S, Jha S. Role of tactile and visual inputs in product evaluation: a multisensory perspective. Asia Pac J Mark Logist. 2011 Jan 1; 23(4):513–30.
104. Lee J, Park D-H, Han I. The effect of negative online consumer reviews on product attitude: An infor-mation processing view. Electron Commer Res Appl. 2008 Sep 1; 7(3):341–52.
105. Ching RKH, Tong P, Chen J, Chen H. Narrative online advertising: identification and its effects on atti-tude toward a product. Internet Res. 2013 Jan 1; 23(4):414–38.
106. Fennis BM, Stroebe W, Stroebe W. The Psychology of Advertising [Internet]. Psychology Press; 2015 [cited 2019 Oct 31]. Available from:https://www.taylorfrancis.com/books/9781315681030
107. Kim J, Chan-Olmsted SM. Comparative Effects of Organization–Public Relationships and Product-related Attributes on Brand Attitude. J Mark Commun. 2005 Sep 1; 11(3):145–70.
108. MacKenzie SB, Lutz RJ, Belch GE. The Role of Attitude toward the Ad as a Mediator of Advertising Effectiveness: A Test of Competing Explanations. J Mark Res. 1986 May 1; 23(2):130–43. 109. Morris JD, Woo C, Geason JA, Kim J. The Power of Affect: Predicting Intention. J Advert Res. 2002
May 1; 42(3):7–17.
110. Yu JP, Dutta PK, Pysarchik DT. The Impact of Reference Groups and Product Familiarity on Indian Consumers’ Product Purchases. J Glob Acad Mark Sci. 2007 Jun 1; 17(2):75–97.
111. Brysbaert M, Warriner AB, Kuperman V. Concreteness ratings for 40 thousand generally known English word lemmas. Behav Res Methods. 2014 Sep 1; 46(3):904–11.https://doi.org/10.3758/ s13428-013-0403-5PMID:24142837
112. Warriner AB, Kuperman V, Brysbaert M. Norms of valence, arousal, and dominance for 13,915 English lemmas. Behav Res Methods. 2013 Dec 1; 45(4):1191–207. https://doi.org/10.3758/s13428-012-0314-xPMID:23404613
113. Engelthaler T, Hills TT. Feature Biases in Early Word Learning: Network Distinctiveness Predicts Age of Acquisition. Cogn Sci. 2017; 41(S1):120–40.
114. Guevarra DA, Howell RT. To have in order to do: Exploring the effects of consuming experiential prod-ucts on well-being. J Consum Psychol. 2015 Jan 1; 25(1):28–41.
115. Caprariello PA, Reis HT. To do, to have, or to share? Valuing experiences over material possessions depends on the involvement of others. J Pers Soc Psychol. 2013; 104(2):199–215.https://doi.org/10. 1037/a0030953PMID:23276272
116. Torrico DD, Wardy W, Pujols KD, Carabante KM, Jirangrat W, Scaglia G, et al. Cross-Cultural Con-sumer Acceptability and Purchase Intent of Forage-Finished Rib-Eye Steaks. J Food Sci. 2015 Oct; 80(10):S2287–2295.https://doi.org/10.1111/1750-3841.12999PMID:26408954
117. Torrico DD, Fuentes S, Gonzalez Viejo C, Ashman H, Gunaratne NM, Gunaratne TM, et al. Images and chocolate stimuli affect physiological and affective responses of consumers: A cross-cultural study. Food Qual Prefer. 2018 Apr 1; 65:60–71.
118. Howell RT, Pchelin P, Iyer R. The preference for experiences over possessions: Measurement and construct validation of the Experiential Buying Tendency Scale. J Posit Psychol. 2012 Jan 1; 7(1):57– 71.
119. Schlegelmilch BB, Bohlen GM, Diamantopoulos A. The link between green purchasing decisions and measures of environmental consciousness. Eur J Mark. 1996; 30(5):35–55.
120. Childers TL, Carr CL, Peck J, Carson S. Hedonic and utilitarian motivations for online retail shopping behavior. J Retail. 2001 Dec 1; 77(4):511–35.
121. Roy R, Ng S. Regulatory focus and preference reversal between hedonic and utilitarian consumption. J Consum Behav. 2012; 11(1):81–8.