Milton Muñoz, Manuel Roa , Rodrigo Correa (Received: January 10, 2019; accepted: April 15, 2019)
ABSTRACT: This article presents the main results of thermal analytical and drying tests applied to the endocarp of coffee bean samples, in order to analyze their influence on the coffee dehydration process. An infrared analysis, as well as TGA, DTGA and DSC tests, were applied to the parchment of a sample of Castilla variety coffee beans and later compared with similar tests performed on coffee beans of the same variety, upon parchment removal. For analytical tests, the main thermogravimetric transitions are reported up to a temperature of 1000 °C. From thermograms, four temperature range were identified for parchment, with their respective mass loss: 33-33.7°C, 9.48%; 33.7-251.2°C, 16.23%; 251.2-358°C, 47.48%; and 358-800°C, 15.52%. The greatest mass loss was due to cellulose and hemicellulose degradation. The study was complemented by drying experiments on samples of beans with and without parchment. The diffusion coefficients were found using Fick’s second law and metaheuristic optimization methods (global optimization). On average, the diffusion coefficient of grains without endocarp is 46% greater than that of beans dried with the parchment. Coffee beans with parchment took, on average, 50% more time to reaching moisture levels of 12% (on dry basis). The results are considered important for the projection and design of new coffee drying systems and their automatic control.
Index terms: Coffee drying, thermogravimetric analysis, diffusion coefficient, metaheuristic algorithms.
ANÁLISE DO ENDOCARPO DE UMA VARIEDADE DE CAFÉ COLOMBIANO TRADICIONAL
RESUMO: O presente artigo apresenta os principais resultados da realização dos testes termo analíticos e de secagem, em amostras de grãos de café e seu endocarpo, com o objetivo de analisar o efeito deste no processo de desidratação dos grãos. Testes de TGA, DTGA e DSC, assim como análises de espectroscopia de infravermelho, foram feitas na casca de grãos de café da variedade Castilla, e comparadas com testes semelhantes em grãos da mesma variedade, nos quais a casca foi retirada previamente. Para os ensaios feitos reportam-se as principais transições termogravimétricas até os 1000 °C. Dos termogramas, quatro faixas de temperatura foram identificadas para o pergaminho, com sua respectiva perda de massa: 33-33,7 ° C, 9,48%; 33,7-251,2 ° C, 16,23%; 251,2-358, 47,48%; e 358-800 ° C, 15,52%. A maior perda de massa deveu-se à degradação da celulose e hemicelulose.O estudo complementou-se com experimentos de secagem das amostras de grãos com e sem casca. Os coeficientes de difusão foram determinados a partir da aplicação da segunda lei de Fick e o emprego e métodos de otimização metaheurística (otimização global). Em média, o coeficiente de difusão dos grãos sem endocarpo é 46% maior do que os grãos que foram secados com a casca. Grãos de café com pergaminho levaram, em média, 50% mais tempo para atingir os níveis de umidade de 12% (em base seca).Os resultados consideram-se importantes para a projeção e desenho de novos sistemas de secagem de café.
Termos para indexação: Secagem de café, termogravimetria, coeficiente de difusão, algoritmos metaheurísticos.
1,2,3Universidad Industrial de Santander/UIS - Escuela de Ingeniería Eléctrica, Electrónica y Telecomunicaciones/E3T - Escuela de Ingeniería Metalúrgica y Ciencia de Materiales - Carrera 27 Calle 9 - Bucaramanga - Colombia - [email protected], [email protected], [email protected]
1 INTRODUCTION
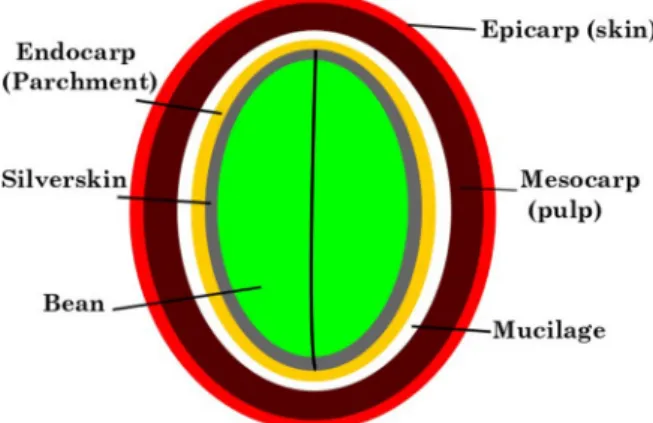
The drying of the coffee bean is a fundamental stage of its postharvest handling. A good drying guarantees not only adequate conservation of the grain during the period of storage, prior to roasting, but also a good cup quality ((FAO, 2011; HENAO, 2015; PUERTA, 2001, 2006; RIBEIRO et al., 2018). In general, the drying of the coffee beans takes place after they are pulped, fermented and washed, in a process known as wet processing (MONTILLA et al., 2008). In depulping, the epicarp or skin and the mesocarp or pulp is removed (see Figure 1), and during the wash, the mucilage is removed, too. In this way, the drying of grain involves the removal of the underlying moisture to the grain, and the removal of the endocarp or parchment that still covers it, as well.
Removing the grain parchment before drying is not easy, given its high moisture content, between 55% and 60% w.b. (BOOT, 2013; GHOSH, 2014). Besides, producers consider the parchment as protection for dry grains, which must be transported from the production centers to the collection centers, although, it must finally be removed before the product is exported. The components of the dried parchment residue, are mainly cellulose (40-49%), hemicellulose (25-32%) and lignin (33-35%) (BEKALO; REINHARDT, 2010; ESQUIVEL; JIMÉNEZ, 2012). The parchment is valued for its potential as combustible material, with a 17.9MJ / kg report on its calorific value (RODRÍGUEZ; ZAMBRANO, 2010).
Knowing the thermal properties of beans and of parchment, as well as the kinetics of their drying characteristics are paramount for improving the coffee drying process.
FIGURE 1 - Coffee Grain Structure. Source: Authors
A thermal analysis of parchment is done in (MANALS; PENEDO; GIRALT, 2011). In this work, we found that after a thermogravimetric experiment with parchment at 40K/min, 44% of the mass was lost. This phenomenon took place between 200 and 400°C, and can be associated with the degradation of cellulose and hemicellulose. Moreover, 34.86% of the mass was lost between 580 and 650°C, which can be associated with lignin degradation. Other researchers have done a similar study, but they focused on a mixture of parchment and pulp (DOS REIS et al, 2011). The authors reported that 8.55% of mass was lost between 25 and 150°C. Also, another 51.20% was lost between 150 and 400°C, with an additional loss of 34.95% between 401 and 580°C, and of 2.08% between 581 and 901°C. Finally, 3.23% of mass was lost at temperatures above 900°C. The sample the authors analyzed had a mass of 25mg and was treated at 10°C/min.
Regarding the coffee drying process, some authors have studied different approaches for measuring moisture in coffee beans (GAUTZ; SMITH; BITTENBENDER, 2008). A review of techniques for process and drying coffee can be found in (GHOSH; VENKATACHALAPATHY, 2014). There is also research targeting Colombia. In (OLMOS, DUQUE; RODRIGUEZ, 2017), the authors compiled the state of the art regarding drying technologies in the country. Some of the models required for simulating the drying dynamics in coffee grains can also be found in literature, e.g. (OLIVEROS ET AL, 2010), (ZULUAGA; GOMEZ, 2015), and (PATIÑO; PENCUE; VARGAS, 2016), among others.
The objective of the study reported in this article is to analyze the way in which the endocarp
influences the drying process of the grain, through the revision of some of its thermal characteristics. For this, the parchment from a sample of Castilla variety coffee beans collected in the southeastern region of the department of Santander, in Colombia, was subjected to a series of thermo-analytical tests, while experimental curves of drying grain, with and without it, were determined. The thermal analysis was compared with results of similar tests made to the single grain, and the differences between the grain drying kinetics, with and without parchment, were contrasted based on the determination of diffusion coefficients. This exploration is important as a preliminary phase on the study of new drying techniques, which might consider the extraction of moisture in endocarp free seeds. The methodology addressed, as well as the main results obtained, are detailed below.
2 MATERIAL AND METHODS 2.1 Thermal Analysis
For the thermal analysis, a sample of parchment from Castilla Variety coffee beans was subjected to Thermo Gravimetric Analysis (TGA), Differential Thermo Gravimetric Analysis (DTGA) and Differential Scanning Calorimetry (DSC) tests, at a heating rate of 5 °C/min. The analysis was carried out in an inert nitrogen atmosphere, in a NETZSCH device (STA 449 F5 JUPITER). The system was also coupled with an infrared (IR) equipment, brand BRUKER. In the process, the ASTM E1131-08 and ASTM E1269-11 standards were followed. The results were compared with the thermal analysis made by the authors to the grains without endocarp as shown in (MUÑOZ; ROA; CORREA, 2018).
2.2 Diffusion Coefficients
Diffusion coefficients were estimated for beans with parchment, without parchment, and for a parchment-only sample, after obtaining the corresponding drying curves. A total of 10 experiments were carried out, 4 for beans with parchment, 4 for parchment free samples and 2 for parchment-only samples. The mass of the samples was 63.5g. The samples were hydrated with distilled water for a period of 48 hours. Subsequently, the already fermented samples were also washed with distilled water and left to rest for 25 minutes. In this way, the fermentation and washing process carried out by the producers was emulated, prior to drying.
To obtain the drying curves, the samples were dried in a convection electric oven at a controlled temperature of 50±2 °C, arranged in a single layer on an aluminum plate. The moisture loss was calculated based on (1) and (2), with the residual moisture of the grain at time t, the initial mass of the grain, the mass of the grain at time t, the initial humidity of the grain, and the dry mass of the sample, which was calculated by drying the samples at a temperature of 104 °C, for one hour. The dry mass for the samples of beans with parchment was calculated at 30.13g; for the parchment free samples in 31.28g; and for the parchment-only samples in 21.01g. The humidity on dry basis M was determined with (3). The first three measurements of mass were taken every 20 minutes, the next two every 30 minutes, and the remaining ones every hour, until obtaining a humidity in the dry basis of less than 12%.
Following the second law of Fick, and the fluid continuity equation (CRANK, 1975), the loss of humidity in the grain with respect to time (M, in dry basis), is determined using (4).
In equation (4), D is the effective diffusion coefficient. Assuming a spherical geometry for the samples, the solution of (4) leads to (5) (BORÉM; LEMOS; DIAS, 2018).
In (5), MR is the dimensionless moisture relation, is the initial moisture in dry basis, the equilibrium moisture, also in dry basis, and r the approximate radius of the grains. The time, t, was measured in minutes, and the radius, r, in millimeters, so D contains mm2/min units. It is important to keep in mind that D is assumed independent of temperature, time and concentration.
A more general solution (RODRIGUES DE OLIVEIRA ET AL., 2016; VARADHARAJU; KARUNANIDHI; KAILAPPAN, 2001) is detailed in (6), from which the effective coefficient of diffusion D is cleared by dividing the first factor, ki, between π2 and multiplying it by r2 (the approximate radius of the grain squared),
2.3 Metaheuristic algorithms
Metaheuristic algorithms are stochastic optimization procedures that implement a local search. Their nature incorporates a tradeoff between the ability to explore the search domain and of exploiting a feasible solution (YANG, 2014). In this work, we used the following metaheuristics: Genetic Algorithms, GA, Drone Squadron Optimization, DSO, and Particle Swarm Optimization, PSO. Trust Region with Dogleg, TRD, a nonlinear optimization algortihm was used too.
Trust Regions algorithms operate by defining a trust region at each iteration, as the name hints. A quadratic convex function is minimized in such a region, starting from a given initial point (CONN; GOULD; TOINT, 2000; CRINA; ABRAHAM, 2012; WU, CHEN, & JIAO, 2010). Genetic Algorithms (GA), on the other hand, operate by mimicking natural selection and genetic rules. This kind of approach starts with a random initial population. The best individuals are determined (1) (2) (3) (4) (5) (6)
based on the objective function and selected for cross-over. This way a new population is generated, which is mutated afterward (DÜNDAR & ŞAHIN, 2013). A third kind of approach is Particle Swarm Optimization (PSO), which was proposed by Eberhart and Kennedy based on the collective behavior of birds and fish (YANG, 2014). This algorithm also starts with a random population, known as particles. The position of each particle represents the values of problem variables. But each particle also has a velocity, which relates to the change of each solution at the next iteration. Such velocity depends on the previous one and on the position of the particle, as well as on the best results found by the particle and by the whole swarm. There are also a couple of coefficients,
known as the individual and social coefficients (MIRJALILI et al, 2020). Finally, the Drone Squadron Optimization algorithm was inspired by an artificial system, i.e. a drone squadron, which is organized in teams. The algorithm is composed of two fundamental blocks: the groups of semi-autonomous drones that search for the minimum, and a central command that governs the logical operation of the drones (de MELO; BANZHAF, 2018).
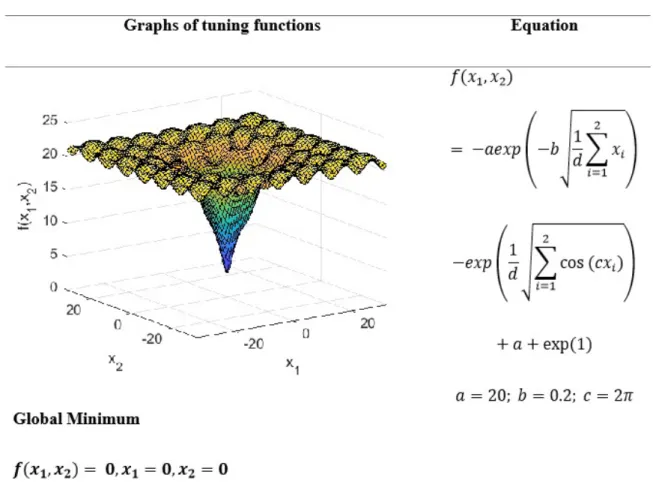
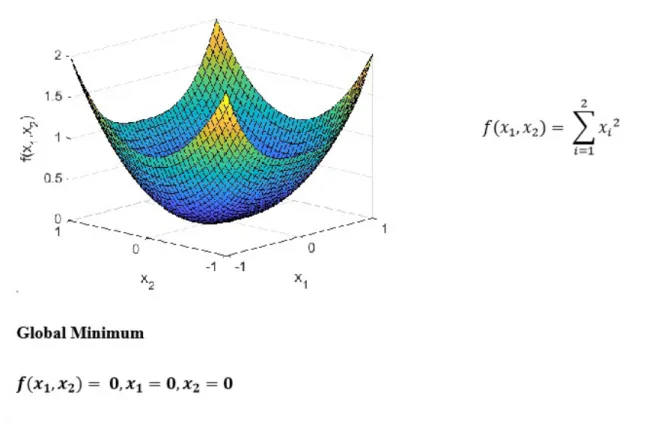
In this work, all the algorithms were tuned with the standard test functions shown in Table 1. The resulting parameters for each algorithm are summarized in Table 2.
Out of all preliminary tests, GA was the approach that yielded the best execution time.
TABLE 2 - Final parameters for each optimization algorithm.
Algorithm Parameter
DSO Number of teams: 20
Number of drones per team: 50 Maximum evaluations: 500000 Tolerance: 1e-20 TRG Maximum evaluations: 500000 Tolerance: 1e-20 GA Population: 1000 Maximum evaluations: 500000 Tolerance: 1e-20
PSO Number of particles: 1000
Maximum evaluations: 500000 Tolerance: 1e-20
Hence, this approach was selected for performing calculations in all the samples. Equation (7) was used as the objective function, since it guarantees minimum variance estimates (BECK, 1977; BARD, 1974). Equation (7) follows the form of equation (6), where M is the vector of N real data points from the drying process. The data estimated by the model were compared with the real data through the measurement of the root mean square error, equation (8), and the determination coefficient, equation (9).
(7) (8)
3 RESULTS AND DISCUSSION
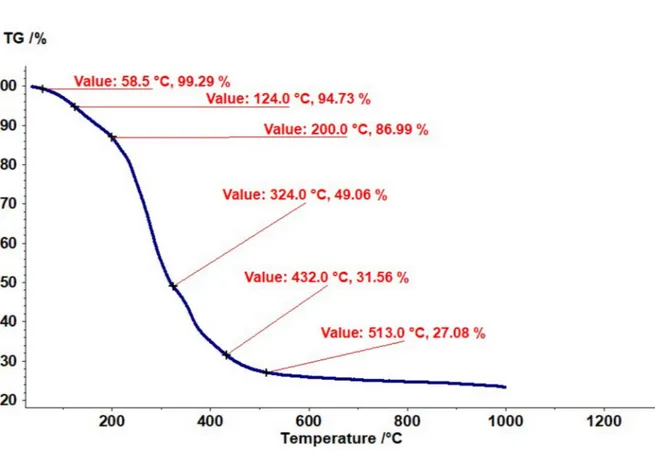
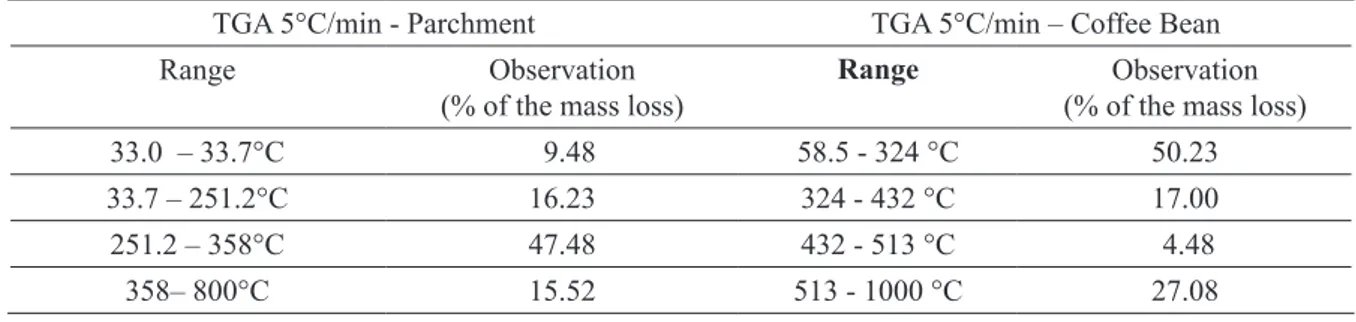
Figures 2 and 3 show the thermograms for the parchment and for the coffee bean, respectively. For the parchment, four areas of interest are differentiated, while for the grain, three zones are clearly differentiable. Table 3 summarizes the temperature ranges that identify these zones and the mass losses that occur in them.
The thermograms done on the parchment show interesting data (Table 3). There is a significant mass loss between 250 ° C and 358 ° C. Degradation of the cellulose compounds occur between these temperatures. Cellulose represents a high percentage of the parchment composition, which does not have alkaloids or some type of molecule with low molecular weight. There is also mass loss above this temperature range, but it belongs to lignin degradation, which represents a low percentage of parchment composition (compared to other polysaccharides). The mass loss below 250°C can be attributed to both, surface and structural water.
For coffee beans, the greatest mass loss is observed between 58 ° C and 324 ° C. This is due to water loss, cellulose compounds loss, and, principally, to the loss of a large number of low molecular weight constituents. These are organic components, some like the caffeine, present in the grain. Subsequent mass loss corresponds to lignin and to similar compounds.
In both cases, it is possible to observe a residual mass, which corresponds to carbonized residues, and to some inorganic compounds present in the compositions of both samples.
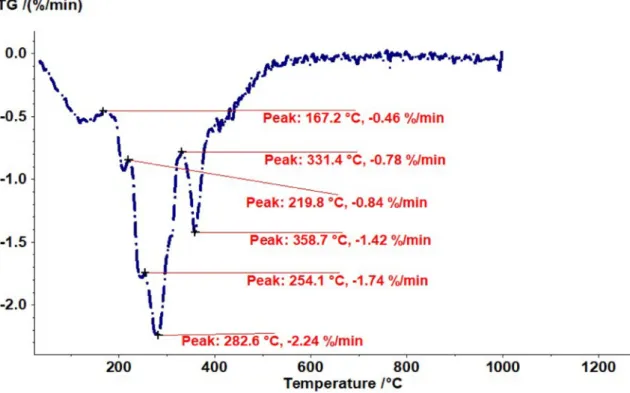
The differential thermogram (DTGA) of the parchment is presented in Figure 4. A single transition can be noticed at 346 °C, which corresponds to the loss of cellulose and hemicellulose, its major constituent parts. In the differential thermogram of the grain (see Figure 5), the dynamic range is greater, and the loss of these same components is observed as a transition between 331.4 °C and 358.7 °C. In fact, polysaccharides begin decomposing between 250-300 °C, and it can go as high as about 700 °C.
But, hemicellulose decomposition also begins at 250 °C. Moreover, cellulose and lignin begin decomposing at 350 °C, although lignin ends up decomposing at temperatures above 500 °C, (MANALS; PENEDO; GIRALT, 2011).
Additionally, it is important to note that the range between 219 °C and 254 °C stands out in the coffee bean data. This is the range where caffeine sublimation occurs. Hence, this information is relevant for the roasting process, as mentioned by the authors in a previous work (MUÑOZ; ROA; CORREA, 2018).
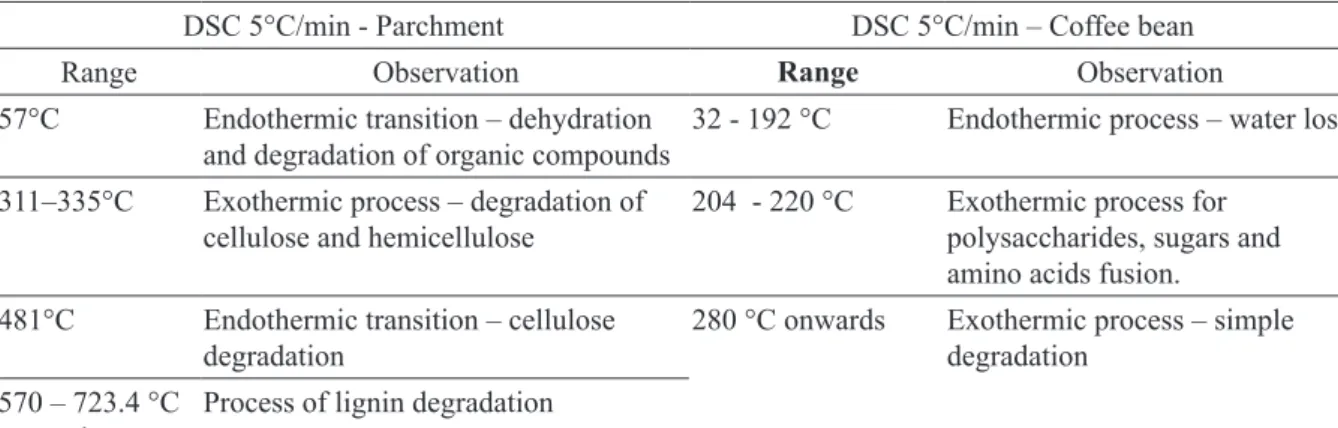
Figures 6 and 7 correspond to the DSC of the parchment and grain. The most outstanding transitions are summarized in Table 4.
DSC data, combined with data from Table 4 supports the idea of an endothermic transition for the parchment, occurring around 57 °C and corresponding to water loss. Such a transition is also observed for the coffee bean. But it occurs in the range between 32 °C and 192 °C. The difference is probably because beans contain more structural water than parchment. The latter is mainly composed of natural polysaccharide, with transitions of hemicellulose occurring from around 300 °C and up to about 480 °C (to cellulose), and above 570 °C (to lignin). Coffee beans contain more molecules with low molecular weight.
Hence, a transition close to 200 °C is observed, corresponding to this type of molecules. There is a subsequent transition corresponding to polysaccharides, mainly cellulose and hemicellulose.
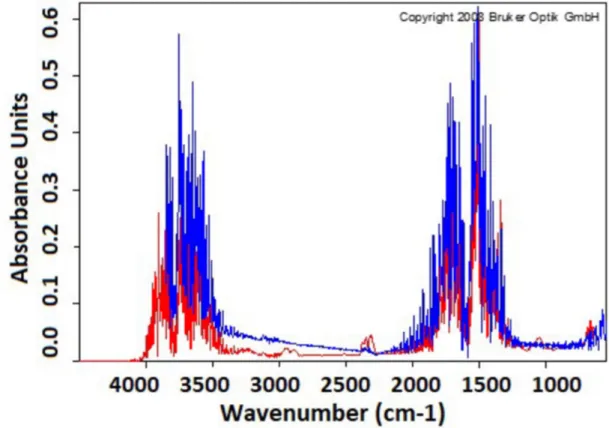
Complementary to the previous analysis, an infrared spectrum was obtained from the IR coupling made in thermogravimetric tests. The acquired spectrum was compared with the Bruker database. Figure 8 shows the spectrum of the parchment at 115 °C, and Figure 9 the grain spectrum at 124 °C. A peak can be observed in both spectra, near 2300cm-1, which corresponds to the carbon dioxide present in the analyzed gas mixtures. This compound is present in the atmosphere of the heating cell. Both spectra correspond to the analysis by FTIR of the gas mixture collected from the thermogravimetric processes, at 115 °C and 124 °C. In both cases, the most representative signals belong to water. This molecule can be found either in the parchment or in the coffee bean, in the form of surface or structural water. The former evaporates near 90-100 °C. Above this temperature, the latter will begin to evaporate. It is possible that at both temperatures, compounds resulting from the evaporation and degradation of molecules with lower molecular weight and low concentration can be obtained. But, the nature and concentration of water in the samples overlap such signals, and only water can be observed.
FIGURE 2 - TGA diagram for parchment: 5°C/min. Source: Authors.
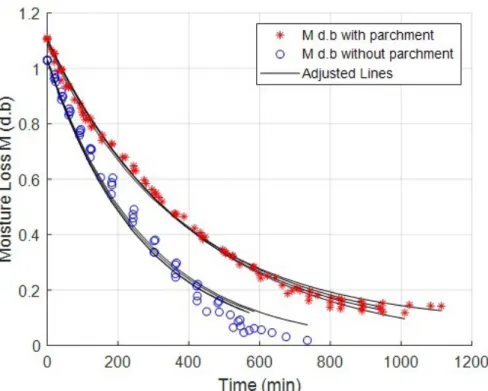
The drying curves, from which the diffusion coefficients were calculated, are shown in Figures 10 and 11. The first one presents the four tests for beans with and without parchment (red and blue points, respectively). The figure also contains black lines. These represent the adjustment using the parameters derived from the optimization procedure (with GA). Figure 11 compares dimensionless moisture in dried base for the four tests of beans with and without parchment, and for the two tests of the only parchment. Drying data for coffee beans with parchment are like those simulated by (ZULUAGA; GOMEZ, 2015). The one for coffee beans without parchment are similar to the ones presented by (PATIÑO; PENCUE;
TABLE 3 - Synthesis of results for TGA analysis of parchment, compared with TGA results for coffee bean. Source: Authors.
TGA 5°C/min - Parchment TGA 5°C/min – Coffee Bean
Range Observation
(% of the mass loss) Range (% of the mass loss)Observation
33.0 – 33.7°C 9.48 58.5 - 324 °C 50.23
33.7 – 251.2°C 16.23 324 - 432 °C 17.00
251.2 – 358°C 47.48 432 - 513 °C 4.48
358– 800°C 15.52 513 - 1000 °C 27.08
FIGURE 4 - DTGA diagram of parchment: 5°C/min. Source: Authors.
VARGAS, 2016). In Figure 12, a box and whisker diagram of the average dimensionless moisture value (MR) is presented, for each type of drying experiment carried out. Table 5 summarizes the results of the tests with the optimization algorithms used to find the parameters of (6), and Table 6 contains the calculation of the diffusion coefficients D and the parameters of (6), for all experiments performed using the GA algorithm.
Drying tests revealed that beans with parchment took around 17 hours to reach moisture levels below 12% (in dry basis). However, drying of parchment-free beans reduces the required time to about 13 hours, i.e. about 25% less time.
FIGURE 5 - DTGA diagram of a coffee bean without parchment: 5°C/min. Source: Authors
FIGURE 7 - DSC diagram for a bean without parchment: 5°C/min. Source: Authors.
TABLE 4 - Synthesis of results for DSC of parchment, compared with DSC of a coffee bean without parchment. Source: Authors.
DSC 5°C/min - Parchment DSC 5°C/min – Coffee bean
Range Observation Range Observation
57°C Endothermic transition – dehydration
and degradation of organic compounds 32 - 192 °C Endothermic process – water loss 311–335°C Exothermic process – degradation of
cellulose and hemicellulose 204 - 220 °C Exothermic process for polysaccharides, sugars and amino acids fusion. 481°C Endothermic transition – cellulose
degradation 280 °C onwards Exothermic process – simple degradation 570 – 723.4 °C
onwards Process of lignin degradation
The boxplot shown in Figure 12 reveals that the drying median for beans with parchment (0.40786) is almost 50% greater than that of beans without it (0.27431). Also, this value is 12% greater than the drying median for parchment-only (0.24506). In all cases, the median drying time is about 6 hours. Also, the width of the second quartile (between 50th and 75th percentile) doubles that of the third one (between 50th and 25th percentile). Therefore, the greatest water loss occurs during the first part of the drying process.
On the other hand, the diffusion coefficient of grain drying for parchment free beans is on average 46% higher than that of the dried grain with its endocarp, and the coefficient of the parchment-only samples is 10% higher than that of the parchment free beans. Data fitted through the parameters achieved with GA is better for the drying of beans with parchment that without it. This may be due to the fact that, as is referred in (RAMIREZ, 2012), the structure of the bean is not homogenous for all moisture values.
FIGURE 8 - IR spectrum of parchment at 115C- 5C/min (red) and IR spect rum of water from Bruker database (blue).
FIGURE10 - Drying curves for coffee beans with parchment (red points) and for coffee beans without parchment (blue points). Source: Authors.
FIGURE 11 - Dimensionless Value of humidity (MR) for beans drying with parchment, without parchment, and for the parchment-only. Source: Authors
FIGURE 12 - Boxplot of the average dimensionless moisture value (MR).
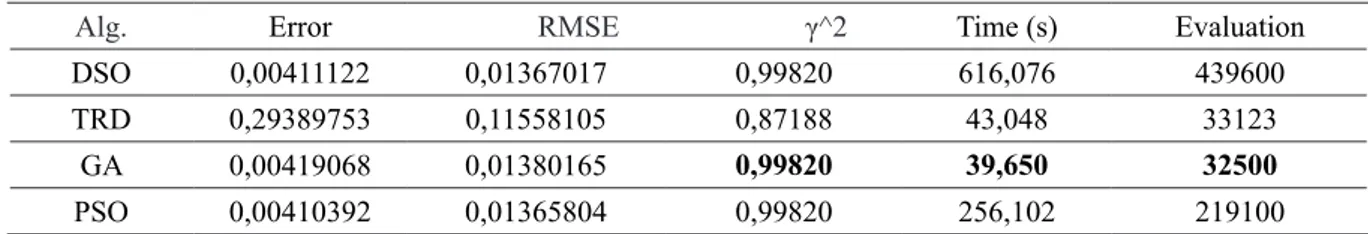
TABLE 5 - Performance parameters example for the two-element drying curves – Algorithms: DSO, GA, and PSO. Source: Authors.
Alg. Error RMSE γ^2 Time (s) Evaluation
DSO 0,00411122 0,01367017 0,99820 616,076 439600
TRD 0,29389753 0,11558105 0,87188 43,048 33123
GA 0,00419068 0,01380165 0,99820 39,650 32500
PSO 0,00410392 0,01365804 0,99820 256,102 219100
TABLE 6 - Diffusion coefficients D and the parameters of equation (6), for all experiments, performed using the GA algorithm
Experimental results of coffee grain drying with parchment
TEST
1 0,94950 0,00245 0,05000 0,00200 0,00750 0,01388 0,99824
2 0,94305 0,00256 0,04956 0,00203 0,00783 0,01508 0,99782
3 0,92741 0,00272 0,05000 0,00201 0,00834 0,02154 0,99579
4 0,94841 0,00254 0,04999 0,00200 0,00778 0,01354 0,99826
Experimental results of coffee grain drying without parchment
TEST
1 0,95000 0,00375 0,05000 0,00383 0,01151 0,04980 0,97925
2 0,95000 0,00378 0,05000 0,00204 0,01159 0,03855 0,98666
3 0,95000 0,00378 0,05000 0,00387 0,01159 0,03143 0,99062
4 0,95000 0,00362 0,05000 0,00285 0,01110 0,04507 0,98369
Experimental results of parchment-only drying
TEST
1 0,95000 0,00424 0,05000 0,0022700 0,01301 0,08457 0,98458
This becomes more evident for beans without parchment. For this reason, the diffusion coefficient is not independent of structure for the whole moisture range. Likewise, although PSO, DSO, and GA optimization methods rendered very similar results in terms of RMSE and of determination coefficient, GA required the lowest computation time, as was explained previously.
4 CONCLUSIONS
Drying of coffee beans was carried out regularly at temperatures between 50 °C and 60 °C. Thermograms and infrared analysis showed that, for these temperatures, processes are completely endothermic. Also, mass lost mainly belongs to water. Thus, parchment and beans compete to consume the energy required for dehydration. The experiments carried out show that the diffusion of water in the dehydration of coffee beans is notoriously diminished by the presence of its endocarp, while drying without it does not alter its composition, and reduces time and energy. Indeed, our tests revealed that the diffusion coefficient of beans is 46% greater without endocarp than with it. Similarly, coffee beans with parchment took, on average, 50% more time for reaching a moisture level below 12% (in dry base). Out of the four optimization algorithms used for determining the diffusion coefficient, PSO, DSO and GA offered quite acceptable results in terms of RMS and diffusion coeficient, without solving the non-linear equation that defines it. Nevertheless, GA found the optimum parameters in a lower time. Data was better fitted for beans with parchment that for those without it. This indicates that, especially for beans without parchment, diffusion coefficient depends on grain structure throughout the whole moisture loss range. The results are considered important for the projection and design of new coffee drying systems and their automatic control.
Additional studies are required to determine what type of system can make it feasible for pre-drying to facilitate the early removal of the endocarp, to achieve more efficient drying.
5 ACKNOWLEDGMENTS
The authors express their gratitude to the Universidad Industrial de Santander, to “Café Legendario Company” that provided the coffee samples, and to COLCIENCIAS for the financial support to Milton Muñoz and Manuel Roa.
6 REFERENCES
AMARAL et al. Simulation of coffee fruit drying using computational fluid dynamics. Coffee Science, 13(4), 2018, 477–488. Available in: http://www.coffeescience. ufla.br/index.php/Coffeescience/article/view/1489/ PDF1489. Accessed on: January 10, 2019.
BARD, Yonathan. Nonlinear parameter estimation, 1975.
BECK, James; ARNOLD, J; KENNETH. Parameter estimation in engineering and science, 1977.
BEKALO, S. A.; REINHARDT, H. W. Fibers of coffee husk and hulls for the production of particleboard. Materials and Structures/Materiaux et Constructions, 43(8), 2010, pp 1049–1060. https:// doi.org/10.1617/s11527-009-9565-0
BOOT, W. From the cherry to the green bean - post harvesting coffee processing. In Coffee Processing Handbook, 2013, pp 173–192. Available in: https:// bootcampcoffee.com/wp-content/uploads/2013/03/ coffeeprocessing-handbook.pdf. Accessed on: October 10, 2018.
BORÉM, F. M.; LEMOS, I. A.; DIAS, C. D. A. Simulation of coffee fruit drying using computational fluid dynamics. Coffee Science, 13(4), 2018, pp 477– 488. Available in: http://www.coffeescience.ufla.br/ index.php/Coffeescience/article/view/1489/PDF1489. Accessed on: January 10, 2019.
CONN, A.; GOULD, N.; TOINT, P. Trust Region Methods. Series on Optimization. Philadelphia: Society for Industrial and Applied Mathematics and Mathematical Programming Society, 2000.
CRANK, J. The Mathematics of Diffusion, Clarendon Press, Oxford 1975. https://doi.org/10.1016/0306-4549(77)90072-X
CRINA, G.; ABRAHAM, A. A New Approach for Solving Singular Nonlinear Equations. Bifurcation and Symmetry, 38(3), 2012, pp 179–189. https://doi. org/10.1007/978-3-0348-7536-3_16
de MELO, V. V.; BANZHAF, W. Drone Squadron Optimization: a novel self-adaptive algorithm for global numerical optimization. Neural Computing and Applications, 30(10), 2018, pp 3117–3144. https:// doi.org/10.1007/s00521-017-2881-3
Dos REIS, R.; MOSCARDINI, E.; MERCURI, L. P.; Do ROSÁRIO, J.; De CARVALHO, F. M. Thermoanalytical study of inner and outer residue of coffee harvest: Applications on biomass. Journal of Thermal Analysis and Calorimetry, 106(3), 2011, pp 741–745. https://doi.org/10.1007/s10973-011-1542-5 DÜNDAR, S.; ŞAHIN, I. Train re-scheduling with genetic algorithms and artificial neural networks for single-track railways. Transportation Research Part C: Emerging Technologies, 27, 2013, pp 1–15. https://doi. org/10.1016/j.trc.2012.11.001
ESQUIVEL, P.; JIMÉNEZ, V. M. Functional properties of coffee and coffee by-products. Food Research International, 46(2), 2012, pp 488–495. https://doi. org/10.1016/j.foodres.2011.05.028
FAO. Grain crop drying, handling and storage. Rural Structures in the Tropics: Design and Development, 2011, pp 363–386. Available in: http://www.fao. org/docrep/015/i2433e/i2433e10.pdf. Accessed on: September 10, 2018
GAUTZ, L. D.; SMITH, V. E.; BITTENBENDER, H. C. Measuring Coffee Bean Moisture Content. Cooperative Extension Service, 2008, pp 2–4.
GHOSH, P.; VENKATACHALAPATHY, N. Processing and Drying of Coffee – A Review. International Journal of Engineering Research & Technology, 3(12), 2014, pp 784–794. https://doi.org/10.1126/ science.1115581
HENAO A. J. Evaluación del proceso de secado del café y su relación con las propiedades físicas, composición química y calidad en taza. Universidad Nacional de Colombia Sede Medellín, 2015. Available in: http:// www.bdigital.unal.edu.co/51841/1/1128270450.2016. pdf%0Ahttp://www.bdigital.unal.edu.co/51841/. Accessed on: December 15, 2018.
MANALS, E.; PENEDO, M.; GIRALT, G. Análisis Termogravimetrico Y Térmico Diferencial De Diferentes Biomasas Vegetales. Tecnología Química, 2011, pp 180–190. Available in: http://scielo.sld.cu/ pdf/rtq/v31n2/rtq05211.pdf. Accessed on: November 15, 2018.
MIRJALILI, S.; DONG, J. S.; LEWIS, A.; SADIQ, A. S. Particle Swarm Optimization: Theory, Literature Review, and Application in Airfoil Design. Nature-Inspired Optimizers, 2020, pp 811, 167–184. https:// doi.org/10.1007/978-3-030-12127-3
MONTILLA, J.; ARCILA, J.; ARISTIZÁBAL, M.; MONTOYA, E. C.; PUERTA, G. I.; OLIVEROS, C. E.; CADENA, G. Propriedades Físicas y Factores de Conversión del Café en el Proceso de Beneficio. Avances Técnicos Cenicafé, 370, 2008, pp 1–8. MUÑOZ, M.; ROA, M.; CORREA, R. Thermal Analysis of Coffee Beans of Castilla Variety Grown in. Revista Mexicana de Ingeniería Química, 17(3), 2018. Available in: http://www.rmiq.org/ojs311/index. php/rmiq/article/view/62. Accessed on: December 15, 2018.
OLIVEROS, C.; LÓPEZ, L.; BUITRAGO, M.; LEÓN, E. Determinación Del Contenido De Humedad Del Café Durante El Secado En Silos. Cenicafé, 61(2), 2010, pp 108–118. Available in: http://www.cenicafe. org/es/publications/arc061(02)108-118.pdf. Accessed on: December 1, 2018.
OLMOS, L. C.; DUQUE, E. A.; RODRIGUEZ, E. State of the art of coffee drying technologies in Colombia and their global development Estado de las tecnologías de secado de café en Colombia y avances a nivel mundial. Espacios, 38, 2017. https://doi.org/10.1021/cg034243p PATIÑO, M.; PENCUE, E.; VARGAS, R. Determinación Del Contenido De Humedad En Granos De Café Pergamino Seco Utilizando Speckle Dinámico. Biotecnoloía En El Sector Agropecuario y Agroindustrial, 14(2), 2016, pp 84-91. https://doi. org/10.18684/BSAA(14)84-91
PUERTA, G. Cómo garantizar la buena calidad de la bebida del café y evitar los defectos. Cenicafé, AT284, 8, 2001. Available in: https://www.cenicafe.org/es/ publications/avt0284.pdf. Accessed on: December 1, 2018.
PUERTA, G. La humedad controlada del grano preserva la calidad del café. Cenicafé, 352, 2006, pp 1–8. Available in: http://biblioteca.cenicafe.org/ bitstream/10778/418/1/avt0352.pdf. Accessed on: December 1, 2018.
RAMIREZ, A. Internal structure and water transport in endosperm and parchment of coffee bean. Montpellier, 2012.
RIBEIRO, B. B.; MICKAEL, F.; CÂMARA, D. M.; NAZARENO, A., MENDES, G.; ANASTÁCIO, V.; MONTANARI, F. F. Sensory analysis of coffee dried with and without stirring. Coffee Science, 13(4), 2018, pp 455–464. Available in: http://www.coffeescience. ufla.br/index.php/Coffeescience/article/view/1472/ PDF1472. Accessed on: January 25, 2018.
RODRIGUES DE OLIVEIRA, A. P.; DUARTE, A. L.; MENDES BOTELHO, F. M.; HORTA DE OLIVEIRA, G. H.; CORRÊA, P. C. Thermodynamic properties of drying process and water absorption of rice grains. CyTA - Journal of Food, 15(2), 2016, pp 204–210. https://doi.org/10.1080/19476337.2016.1238012 RODRÍGUEZ, N.; ZAMBRANO, D. Los subproductos del café. Avances Técnicos Cenicafé, (3), 8, 2010. Available in: http://biblioteca.cenicafe. org/bitstream/10778/351/1/avt0393.pdf. Accessed on: December 1, 2018.
VARADHARAJU, N.; KARUNANIDHI, C.; KAILAPPAN, R. Coffee cherry drying: A two-layer model. Drying Technology, 19(3–4), 2001, pp 709– 715. https://doi.org/10.1081/DRT-100103947
WU, W., CHEN, L., & JIAO, B. A self-adaptive trust region algorithm with line search technique. 3rd International Joint Conference on Computational Sciences and Optimization, CSO 2010: Theoretical Development and Engineering Practice, 1, 2010, pp 46–51. https://doi.org/10.1109/CSO.2010.25
YANG, X. S. Particle Swarm Optimization. Nature-Inspired Optimization Algorithms. Luniver Press, United Kingdom, 2010. https://doi.org/10.1016/B978-0-12-416743-8.00007-5
ZULUAGA, C.; GOMEZ, L. M. Dynamic modeling of coffee beans dryer. IEEE 2nd Colombian Conference on Automatic Control, CCAC - Conference Proceedings, 2015. https://doi.org/10.1109/ CCAC.2015.7345214