Development of a New Standard Procedure for the Evaluation of
Composite Abrasive Wear
Eduardo Carlos Bianchia*, Eraldo Jannone da Silvab, Rodrigo Daun Monicib, Alexandre Pegoraro Xavierb, César Antunes de Freitasc, Ana Rita Rodrigues Bianchid a
Assistant Professor, Department of Mechanical Engineering, Faculty of Engineering, Universidade Estadual Paulista at Bauru Campus, 17033-360 Bauru - SP, Brazil
b
Mechanical Engineer, Universidade Estadual Paulista at Bauru Campus, 17033-360 Bauru - SP, Brazil
c
Professor, Department of Dentistry, Endodontics and Dental Materials, University of São Paulo, 17043-101 Bauru - SP, Brazil
d
Working on Doctorate in Odontology, Department of Dentistry, Endodontics and Dental Materials, University of São Paulo, 17043-101 Bauru - SP, Brazil
Received: January 31, 2001; Revised: August 8, 2001
This article discusses the development of a test bench and a methodology for the study of composite resin abrasive wear. To evaluate the operation of the test bench and to compare the proposed methodology with other existing ones, a study was made of the five composites most commonly used by dentists. The one-way ANOVA method and the Tukey test were used to statistically analyze the results by multiple comparisons of the groups of resins tested. Using the proposed methodology, these resins were classified in an increasing order of abrasive wear strength, as follows: Charisma (the lowest abrasive wear strength), Tetric, TPH, Herculite and Z-100 (the highest abrasive wear strength) (p < 0.05). In comparison to other methodologies, the results of the proposed methodology presented the lowest coefficient of variation.
Keywords:abrasive wear, composites, composite tribology
1. Introduction
Composite resins were developed with the objective of replacing the loss of human dental material, be it by acci-dent or as the result of acci-dental surgery to improve a person’s living conditions. Among the several existing materials that can be used for this purpose, composite resins were chosen because they are more wear resistant, easier to handle (they are sold in tubes like toothpaste), and because their coloring closely resembles that of human teeth, making them almost imperceptible after application.
Dental restoration materials, ideally, should wear simi-larly to the way tooth enamel does. However, owing to the characteristics of each material, this is obviously not the case. The main problem involved in the use of composites is their wear, which may result from brushing and mastica-tion. Thus, studies of this phenomenon are needed in order to foresee the service life of composites, since they require substitution when they wear out.
According to Condon & Ferracani1, Dahl & Oilo2, and Dickinsonet al.3, there are two distinct methods to analyze composite wear: the clinical (in vivo) and the laboratorial (in vitro) methods. The clinical method consists of making restorations in the teeth of several patients and, after a given period of time, usually quite long (a minimum of 2 and a maximum of 6 years), analyzing the wear that the resins have undergone4.
One of the chief problems that researchers faced is that, upon obtaining data on the wear of the tested resins after such a long period, other resins had already been launched and variations had been made in the composition of the old ones. Clinical testing involves inconveniences, among them the difficulty of controlling patients’ visits, the variety of eating habits and of masticating, which are influenced by the pH of each patient’s saliva.
As for laboratory (in vitro) tests, some can be simple while others may be as complex as clinical tests. The lack
of an internationally acceptable method of evaluating the abrasive wear of resins and of the different methods em-ployed makes it difficult to carry out a comparative analysis of the results obtained for the resins tested to date.
The purpose of this work is to propose a standard for the evaluation of the abrasive wear of composite resins for the scientific community and for manufacturers. To this end, a test bench was developed, which was subjected to an initial evaluation and, subsequently, to the necessary modifications. This test bench was compared with the results obtained using the initial version of the method (sharpness balance), confirming the effectiveness of the proposed method.
2. Composite Resin Wear
Carvalho & Salgado5 state that, since Bowen6 discov-ered composite resins over 25 years ago, no other material in odontology has received so much attention. The growing demand of patients for an esthetically attractive look, which implies the white of natural teeth instead of the gold of earlier times, coincides with the appearance of a broad range of new materials and techniques. This may cause dentists to become confused when using composite resins (particularly the posterior one), giving rise to unsatisfactory clinical results.
In their comparative lab study of the abrasive wear of four different types of resins against one abrasive enamel, Hiranoet al.7 found that the most important physical prop-erty of “artificial teeth” used in restorations is abrasive wear strength. In the past, the most widely used materials for this purpose were porcelain and resin. Porcelain possessed high abrasive wear strength and a more stable color than resin; however, it was also more prone to fracturing. Resins, on the other hand, possess excellent strength and adhesiveness to the base of the tooth, although their abrasive wear resistance along time is questionable.
Research work was carried out to improve the abrasive wear resistance of composite resins. The apparatus for in vitro lab tests used to investigate abrasive wear involves, in most cases, an artificial mouth that simulates the move-ments of mastication. The authors of this article have developed an alternative way of simulating these move-ments and conducting lab studies of the abrasive wear of composite resins.
The method involved the construction of test speci-mens, positioning the composite resin on the occlusal sur-face of each tooth. Five abrasive enamels and five test specimens were used for each test. An abrasive and a specimen were positioned in the machine for an analysis of the abrasive wear and tested for 5,000 cycles (during which a fluid - human saliva - was injected between the surfaces), followed by an additional 5,000 cycles, i.e., a total of 10,000 cycles with a 13.4 N load. The apparatus developed to analyze the wear establishes contact between the abra-sive enamel and the surface of the artificial tooth
(speci-men) for 10,000 cycles. All the abrasive wear tests were carried out using human saliva. The wear of the specimens was measured by means of a Profilometer placed at four points along the circular surface created by the abrasive on the surface of the specimen. The maximum depth in the area of wear in relation to the unworn surface was consid-ered as the amount of worn material. The accuracy of these measurements was approximately 1 µm.
The authors state that it is important to evaluate the abrasive wear rate of composite resins because of its influ-ence on the maintenance of efficient mastication and on the vertical dimension and stability of the occlusal surface.
Table 1 presents the mean values and standard deviation obtained from the findings of Hirano et al.7, where the variation coefficient, which is defined as the quotient be-tween the standard deviation and the mean, is calculated according to Costa Neto8. This is often expressed in per-centages and has the advantage of characterizing the dis-persion of data in terms of their mean value.
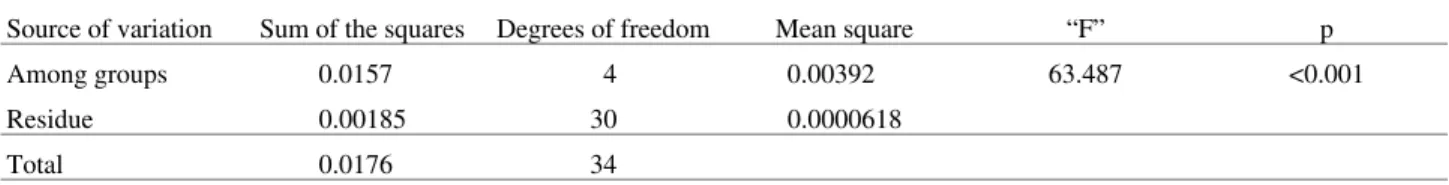
Barkmeieret al.9 state that new composite resins have been developed with a potential to substitute amalgam. They propose to determine and compare the localized abrasive wear of three “high density” composite resins (Alert, Solitair and Surefil) and two “conventional” com-posite resins (TPH and Z-100). Their specimens were pre-pared with a polished surface. The profile of the surface was recorded using a Profilometer. The specimens were subjected to 400,000 cycles in a Leinfelder wear machine (the authors do not give additional information about the machine). After the test, a second specimen profile was made and compared to the first, using the AnSur 3D soft-ware program. The total volume removed and the maxi-mum depth of abrasive wear of each specimen was calculated. The results are given in Table 2. Finally, Bark-meieret al.9 conclude that there was a significant difference in the localized abrasive wear of the five composite resins analyzed.
3. Methodology
The process of coating the metallic disk with resin is manual, with no precision in regard to the eccentricity. To remove geometrical and dimensional imperfections and eliminate the remnant viscous layer, the disks were pre-viously machined with a thick grindstone in a grinding machine.
Both the static and the dynamic disks were prepared with the disk fixed at the extremity of the dynamic disk head. The static disk was produced and removed from the head, while the dynamic disk was not. This was done to minimize decentralization errors.
To set up the guides on the support (in an inverted U form) developed earlier, some joining parts had to be constructed to fix the guides tightly to the support, prevent-ing vibrations and allowprevent-ing for the uniform and simultane-ous displacement of both shafts.
The vertical displacement mechanism was assembled with all the parts that join the shafts, the fixation of the static disk and the applied load. All these parts were built in aluminum to reduce their weight, as will be discussed later herein.
After all the disk fabrication requirements were com-pleted, the search for the best testing conditions began. First, the balance load was varied. The load was divided into four parts to fit into each other. Several tests were carried out under the same testing conditions, with vari-ations only in the load. The load that produced the best results was 6.5 N.
Preliminary tests were also performed varying the rota-tion of the dynamic shaft head. Problems involving burning of the material surface occurred at high rotation rates, while wear rate of the material proved unsatisfactory at lower rotation rates. After a series of tests, the optimal rotation of the motor was found to be 30 Hz, using lubrication by water in the cutting area.
To verify the influence of the initial testing conditions, reiterated tests were carried out with the same dynamic disk, demonstrating that the results obtained from the sec-ond test were significantly different from those of the first, and that all the former showed good repeatability.
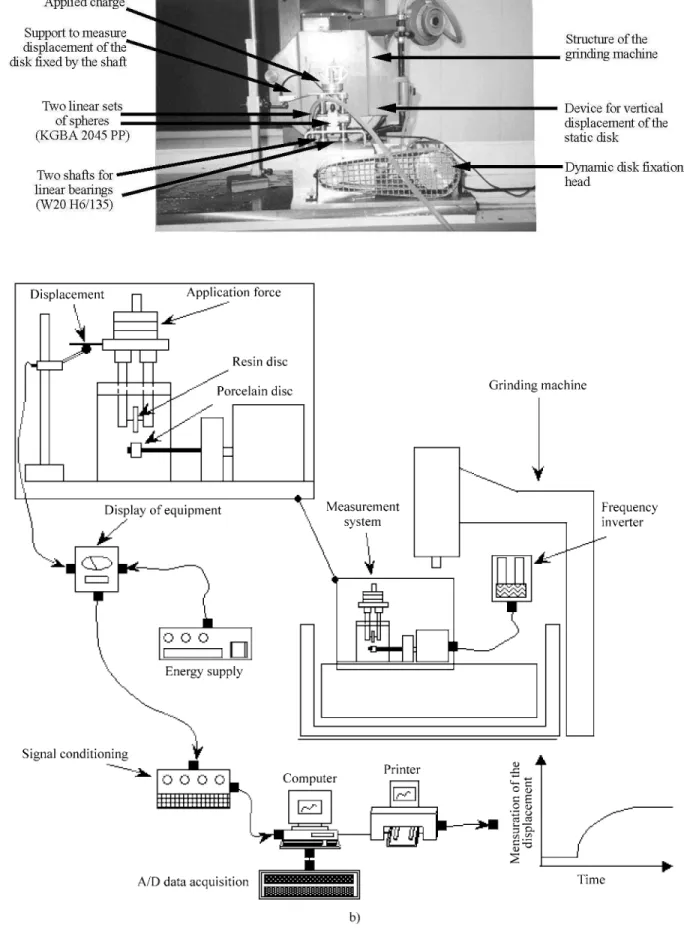
Figure 1 (a) illustrates the test bench developed, show-ing a frontal view of the grindshow-ing machine used to support the test bench and grind the disks. The Fig. 1 (b) shows a schematic drawing with detail of the parts and measure-ment system.
To determine the sharpness (the capacity of porcelain to wear out the resin), an adjustment was made by Bianchi et al.11 (1997), based on the report of Coelho, R.T.10, in which sharpness is expressed by:
k=2b√4r 3Fn (a1)
2⁄
3 [mm3/N.s] (1)
where k is the sharpness [mm3/N.s], b is the width of the static disk [mm], r is the radius of the disks [mm], Fn is the normal applied load [N], a1 is the angular coefficient, generated by the graph, of the straight line recorded between the vertical displacement of the static disk (y axis) and the time elevated to 2/3 (x axis), as described in the mathematical model developed by Coelho, R.T.9,10.
Testing was carried out by placing a wide disk (dy-namic) on the head and a narrow disk (static) on the vertical displacement device. With the shaft of the dynamic disk in a stationary state, the static disk was carefully moved toward the dynamic disk until they touched themselves. To begin the test, the motor was turned on and the
displace-Table 2. Results of the study of Barkmeier et al.9.
Volume removed [mm3]
Coefficient of variation [%]
Z-100 0.010± 0.003 30.0
SureFil 0.014± 0.004 28.6
Alert 0.016± 0.005 31.3
Spectrum TPH 0.042± 0.003 7.1 Solitaire 0.062± 0.008 12.9
Maximum depth [µm]
Coefficient of variation [%]
Z-100 69.2± 8.8 12.7
SureFil 82.6± 11.4 13.8
Alert 80.9± 15.4 19.0
Spectrum TPH 125.2± 11.1 8.9 Solitaire 159.2± 15.0 9.4
Table 1. Mean values and standard deviation of the results obtained by Hirano et al.7.
Mean values and standard deviation of wear after 5,000 cycles in the test machine [mm]
Coefficient of variation [%]
Myerson 0.0034± 0.0017 50.0
DB Plus 0.0034± 0.0022 64.7
Classic 0.0050± 0.0029 58.0
KensonTPH 0.0060± 0.0023 38.3
Mean values and standard deviation of wear after 10,000 cycles in the test machine [mm]
Coefficient of variation [%]
Myerson 0.0040± 0.002 47.5
DB Plus 0.0042± 0.002 47.6
Classic 0.0082± 0.004 48.7
ment values were simultaneously recorded (using a soft-ware program) for subsequent analysis. The test was con-cluded when the maximum vertical displacement reached 450µm.
4. Results and Discussion of the Definitive
Tests
The tests were carried out making sure that the same pattern of physical actions were performed during all the experiments with the five composite resins, i.e., Charisma, Herculite, TPH, Tetric and Z-100.
Upon conclusion of the tests with each type of compos-ite resin, the ceramic was ground in order to keep its surface always new for the tests with a new resin type.
The mean sharpness and the standard deviation ob-tained for each tested resin are shown in Fig. 2. The one-way ANOVA method and the Tukey test were performed in the analysis of the results obtained for sharpness for the comparisons among the groups of resins tested.
When the one-way ANOVA test was performed with the original sharpness values of each resin tested, this set of data didn’t present a normal distribution, a basic prereq-uisite for application of the one-way ANOVA test, which is parametric one.
For this reason, in order to normalize the set of data, the individual values of sharpness for each resin were mathe-matically transformed by extracting the square root of their individual values.
Based on the transformed sharpness values (square root of the initial values), a new one-way ANOVA test was carried out, from which normal data were obtained, thus allowing for the test to continue. Table 3 presents a chart containing the Analysis of Variance. A statistical differ-ence was found between the groups (p < 0.001).
The Tukey test was performed for the multiple compari-sons among groups (types of resin), with a 5% of signifi-cance. The results obtained are given in Table 4.
As shown in Table 3, all the comparisons were signifi-cant (p < 0.05); in other words, a statistical difference was found in each individual comparison with 5% of signifi-cance.
For this reason, Table 3 shows the sharpness of the resins in decreasing order (p < 0.05). Because sharpness is inversely proportional to wear strength, it is assumed that the resins can be classified in an increasing order according to their abrasive wear strength, i.e., Charisma (lowest
abra-sive wear strength), Tetric, TPH, Herculite and Z-100 (highest abrasive wear strength) (p < 0.05).
These results are close to those obtained by Barkmeier et al.9 who, upon comparing and determining the localized abrasive wear of three “high density” composite resins (Alert, Solitair and Surefil) and two “conventional” com-posite resins (TPH and Z-100), found that the Z-100 resin presented the lowest wear among the resins they tested (highest abrasive wear strenght).
Table 5 was drawn up to facilitate a comparative analy-sis of the method proposed herein and the methods of Hiranoet al.9 and of Barkmeier et al.9.
Hiranoet al.7 reported minimum and maximum Vari-ation Coefficient [%] values oscillating between 38.3 and 64.7 for wear after 5,000 cycles in their test machine (mm), and of between 47.5 to 81.6 for wear after 10,000 cycles in the test machine (mm).
In the results reported by Barkmeier et al.9, it can be observed that the minimum and maximum variation
coef-Table 3. Analysis of Variance- a classification criterion (One-way ANOVA).
Source of variation Sum of the squares Degrees of freedom Mean square “F” p
Among groups 0.0157 4 0.00392 63.487 <0.001
Residue 0.00185 30 0.0000618
Total 0.0176 34
Figure 2. Mean sharpness and standard deviation obtained for each resin tested.
Table 4. Multiple comparisons among the groups (* - significant test p < 0.05).
Charisma Tetric TPH Herculite Z-100
Charisma * * * *
Tetric * * * *
TPH * * * *
Herculite * * * *
ficient [%] values obtained from their calculation of the volume of removed material varied, respectively, from 12.9 to 20.0, even though the maximum depth values were measured with a variation coefficient [%] of 8.9 to 19.0.
In the results of the work reported on herein, the mini-mum and maximini-mum variation coefficient [%] values var-ied, respectively, from 4.5 to 13.8.
Thus, it can be observed that the method proposed here presented the lowest minimum and maximum values and the lowest range of variation for the variation coefficient.
5. Conclusions
The analysis of the results of this study, their accuracy and repeatability, as well as the facility and the short period of time required to perform each test, allow the authors to conclude that the test bench proposed herein meets the initial requirements of ensuring a safe and fast method to analyze the abrasive wear of composite resins.
Based on the statistical analysis, it can be stated that the proposed test bench is a fast and accurate instrument to evaluate the property of abrasive wear resistance of com-posite resins, and that it meets the initial expectations of the researchers who developed it. The authors can now propose the use of this test bench by specialists as a standard device to evaluate the abrasive wear of composite resins.
Based on the tests performed in this study and the statistical analysis applied to interpret their results, the tested resins were classified in terms of their resistance to wear, in an increasing order, as follows: Charisma (lowest abrasive wear strength), Tetric, TPH, Herculite and Z-100 (highest abrasive wear strength) (p < 0.05).
Among the methods presented in the formal literature, the one proposed in this article presented the lowest vari-ation in the interval of the coefficient of varivari-ation. It should also be pointed out that the unit measure of wear in the usual methods is volume [mm3] while, in the method presented here, sharpness is calculated based on the wear of a given volume of resin by unit of applied load and testing time [mm3/N.s], which ensures greater reliability of the results.
Acknowledgements
The authors gratefully acknowledge the Brazilian re-search funding institutions FAPESP (Fundação de Amparo à Pesquisa do Estado de São Paulo) for its full financial support of this work, and FUNDUNESP (Fundação para o Desenvolvimento da UNESP) for its help in obtaining their patent.
References
1. Condon, J.R.; Ferracani, J.L. In vitro Wear of Composite with Varied Cure, Filler level, and Filler Treatment. J. dent. Res., v. 76, n. 7, p. 1405-1411, 1997.
2. Dahl, B.L.; Oilo, G. In vivo Wear Ranking of Some Restora-tive Materials. Quintessence International, v. 25, n. 8, p. 561-565, 1994.
3. Dickinson, G.L.; Gerbo, L.R.; Leinfelder, K.F. Clinical Evaluation of Highly Wear Resistant Composite. American Jouranal of Dentistry, v. 6, n. 2, p. 85-87, 1993.
4. Bryant, R.W.; Hodge, K.V. A Clinical Evaluation of Poste-rior Composite Resin Restorations. Australian Dental Jour-nal, v. 39, n. 2, p. 77-81, 1994.
5. Carvalho M.E.A.B.; Salgado F. Resina composta posterior. Artigo publicado em 31 de outubro de 1997 no http://odon-tologia. com.br/artigos/resina-composta-posterior.html. 6. Bowen, R.L. Properties of silica reenforced polymer for
dental restorations. J. Amer. Dent. Ass., v. 66, n. 1, p. 57-64, 1963.
7. Hirano, S.; May, K.B.; Wagner W.C.; Hacker, C.H. In vitro
wear of resin denture teeth. The Journal of Prosthetic Den-tistry, v. 79, n. 2, p. 152-155, 1998.
8. Costa Neto, P.L.O. Estatística. Editora Edgard Blücher Ltda. São Paulo, p. 264, 1977.
9. Barkmeier, W.W.; Wilwerding, T.M.; Latta, M.A.; Blake, S.M.In vitro Wear Assessment of High Density Composite Resins.Journal of Dental Research, 77th General Session of the IADR, v. 78, p. 78, 1999.
10. Coelho, R.T. Estudo experimental da propriedade de dres-sagem de rebolos na retificação de precisão usando o método do disco retificado. São Carlos. 122 p. Dissertação (Mes-trado) - Escola de Engenharia de São Carlos, Universidade de São Paulo, 1991.
11. Bianchi, E.C.; Dias, A.C.P.; Bianchi, A.R.R.; Freitas, C.A. Desenvolvimento de uma metodologia para a avaliação do desgaste abrasivo de resinas compostas. In: Congresso Brasileiro de Engenharia Mecânica, 14; Bauru, de 8 a 12 de dezembro de 1997. Anais do COBEM. São Paulo: Asso-ciação Brasileira de Ciências Mecânicas, 8 páginas (em CD - ROM).
FAPESP helped in meeting the publication costs of this article
Table 5. Mean values and standard deviation of the results obtained in the proposed method.
Resin Mean and standard deviation of the values of sharpness [mm3/N.s] Coefficient of variation [%]
Charisma 0.027± 0.0020 7.2
Tetric 0.022± 0.0029 13.5
TPH 0.018± 0.0025 13.8
Herculite 0.015± 0.0021 14.6
![Table 2. Results of the study of Barkmeier et al. 9 . Volume removed [mm 3 ] Coefficient ofvariation [%] Z-100 0.010 ± 0.003 30.0 SureFil 0.014 ± 0.004 28.6 Alert 0.016 ± 0.005 31.3 Spectrum TPH 0.042 ± 0.003 7.1 Solitaire 0.062 ± 0.008 12.9 Maximum dep](https://thumb-eu.123doks.com/thumbv2/123dok_br/18875406.421246/3.918.97.446.446.750/results-barkmeier-coefficient-ofvariation-surefil-spectrum-solitaire-maximum.webp)