Bench-scale calcination and sintering of a goethite iron ore sample
M.S.S. Silva
a, M.M.F. Lima
b, L.M. Graça
c, R.M.F. Lima
a,⁎
aDepartment of Mining Engineering, Federal University of Ouro Preto, Campus Morro do Cruzeiro, CEP: 35400-000, Ouro Preto, Minas Gerais, Brazil
bDepartment of Control and Automation Engineering and Fundamental Techniques, Federal University of Ouro Preto, Campus Morro do Cruzeiro, CEP: 35400-000, Ouro Preto, Minas Gerais, Brazil cSchool of Mines, Federal University of Ouro Preto, Campus Morro do Cruzeiro, CEP: 35400-000, Ouro Preto, Minas Gerais, Brazil
a b s t r a c t
a r t i c l e
i n f o
Article history: Received 16 March 2015
Received in revised form 16 November 2015 Accepted 31 March 2016
Available online 12 April 2016
This work presents the results of bench calcination and sintering studies conducted on an iron ore sample from Iron Quadrangle, Brazil with high goethite content. The natural samples and the products of calcination and sintering were characterised by inductively coupled plasma optical emission spectroscopy (OES/ICP), X-ray spec-trometry and gravimetric methods. Optical microscopy, X-ray diffraction (XRD) and scanning electron micros-copy with energy-dispersive X-ray spectrosmicros-copy (SEM/EDS) were used to identify the phases in the studied samples. Density, specific surface area, specific pore volume and pore diameter were determined through gas pycnometry. All of the natural sinter feed samples had a Fe gradeN64% and a very high phosphorus grade (~0.17%). After calcination, a 3.1–3.4% increase was observed in the Fe grade compared to that of the natural
sin-ter feed samples. The average Fe grade of the sinsin-tered samples was 59.1%. The identified phases with XRD in the raw materials were hematite and goethite. In the calcined samples, only hematite was identified because of the thermal decomposition of goethite. The density, specific surface area, specific pore volume and pore diameter of the calcined samples increased compared to those of the natural sinter feed samples. Hematite, brownmillerite, anorthite, and gehlenite were identified in the sintered samples. The sites for phosphorus occurrence were cal-cium silicates and apatite. The sintered samples exhibited specific surface areas lower than those of the calcined samples. This result was ascribed to the destruction of the pore structure by the sintering process. No relationship between the proportions of nucleate, intermediate and agglomerate particles used in mixture of sinter tests with the results of microtumbler was identified.
© 2016 Published by Elsevier B.V. Keywords:
Iron ore Goethite Hematite Calcination Sintering
1. Introduction
The total world resources of iron ore (indicated + inferred) are 170 billion tonnes. Approximately 12% of these resources, with an aver-age Fe grade of 50.3%, are located in Brazil and are distributed among the following states: Minas Gerais—70% (46.9% Fe), Mato Grosso do
Sul—15.3% (55.4% Fe), Pará—13.1% (64.8% Fe) and others−1.6%
(Jesus, 2013).
More than 90% of the total world's iron ore production is used in the steel industry (blast furnace and direct reduction) (Wolff, 2009). Iron ore with a Fe grade less than 64.0%, such as the actual ores of Minas Gerais and Mato Grosso do Sul, must be concentrated to achieve satis-factory specifications. The choice of beneficiation route for a specific iron ore depends on its mineralogical composition, Fe and SiO2grades and size distribution (Araujo et al., 2003; Al-Wakeel and El-Rahman, 2006).
Most of the iron ores from Iron Quadrangle, Brazil are related to Pro-terozoic banded iron formations (BIFs) of the Cauê Formation (Carlos et al., 2014). The mineralogy of these ores is basically constituted by quartz and iron oxide minerals. In high-grade iron ores, hematite is the main iron mineral. The iron ore deposits of Iron Quadrangle were subjected at least to two metamorphism and deformation events. The metamorphic and deformation intensity increase from west to east and from south to north in the region. These processes beyond the su-pergene processes were the main factors that changed the texture of the iron ore of this region. In general, the mineral crystal size increases with metamorphism degree (Rosière, 1996; Mendes and Lagoeiro, 2012).
In Brazil, iron ore with a high grade of goethite (FeOOH) (LOIN3.5%), independent of its Fe grade, is considered marginal because goethite causes excessive mud generation in the wet processing step, which is very harmful inflotation (slime coating phenomena) andfiltration (blinding) operations. In agglomeration processes (pelletising and sintering), high goethite contents affect both the process control and thefinal quality of agglomerate (pellet or sinter) (Magalhães et al., 2007; Loo et al., 1994; Yang et al., 2000; Okazaki et al., 2003; Leonel, 2011).
⁎ Corresponding author at: Departamento de Engenharia de Minas, Universidade, Federal de Ouro Preto, Campus Universitário, Morro do Cruzeiro, S/N, CEP: 35400-000, Ouro Preto, MG, Brazil.
E-mail address:[email protected](R.M.F. Lima).
http://dx.doi.org/10.1016/j.minpro.2016.03.008 0301-7516/© 2016 Published by Elsevier B.V.
Contents lists available atScienceDirect
International Journal of Mineral Processing
Loo (2005)reviewed several studies conducted with mix sinter of iron ore containing a high proportion of goethitic (pisolitic) ore; the first of these studies was conducted in Australia in 1990. Although the high porosity and low density of goethitic ore increase its melt volume during sintering, which causes deterioration in granulation and low productivity, among other problems. Operation control (e.g. the addi-tion of more water during granulaaddi-tion, the use of a fasterflame front speed than that used in a sinter bed with a denser ore, maintenance of the green bed permeability during the sintering operation and other factors) can provide good performance for a sinter mix with a high pro-portion of goethite ores.
Detailed technological characterisations (i.e. physical, mineralogical and chemical characterisations) and specific technological experiments such as bench calcination and sintering of Brazilian iron ores with high goethite contents must be conducted to predict the behaviour of such ores in industrial processes. Such predictions would facilitate modifi ca-tions to the actual beneficiation routes, which could support the rational use of these ores. This information will be very important for increasing the lifetimes of the mines located in the Iron Ore Quadrangle region.
This work presents the results of bench calcination and sintering studies performed with a natural iron ore sample with high goethite content from the Iron Quadrangle, Brazil; the samples contained differ-ent proportions of nucleating, intermediate and adherdiffer-ent particles.
2. Experimental
2.1. Materials
The raw iron ore sample (52 kg) preparation was constituted by comminution by jaw and roll crushers to−3.36-mm size. This size
was determined based on work carried out byUmadevi et al. (2011), who studied the influence of iron orefines (mean particle size from 1.22 to 3.95 mm) on mineralogy, productivity, physical and metallurgi-cal properties of the sinter. The comminuted ore, after being homogenised, was split into sub-samples for the physical, chemical and mineralogical characterisations. For calcination and sintering tests, the sample was size classified by wet sieving in the following fraction sizes:−3.36 + 1.182 mm (nucleating particles),−1.186 + 0.209 mm
(intermediate particles) and−0.209 mm (adherent particles), which
were mixed in different proportions (Table 1).
The higher proportion of nucleating particles (70%) compared to ad-herent particles (30%) in SF1 aimed to intensify the granulation of mix-ture and, consequently, it could directly affect the permeability of bed sintering. The substitution of 15 wt.% of nucleating particles and adher-ent particles by intermediate particles, respectively in SF2 and SF3, was based on practise of industrial plant of sintering, which uses the maxi-mum of 15 wt.% intermediary particles. This is done because intermedi-ate particles do not have defined behaviour like nucleating or adherent particles. The higher proportion of adherent particles (70%) compared to particles nucleating (30%) in SF4 aimed to assess the main mecha-nisms of granulation usingfine particles in mixture of sintering, which provide the increase in bed of sintering (Silva, 2014).
2.2. Methods
2.2.1. Calcination and sintering tests
For calcination tests, approximately 20 g of each sinter feed sample (SF1, SF2, SF3 and SF4) was placed in an alumina crucible that was pre-viously weighed. The crucible with the sinter feed sample was again weighed and introduced into a furnace (FortLab, model ML 1300).
The run conditions of the calcination tests were as follows: natural atmosphere (air), ramp of 10 °C/min from 25 to 700 °C and an isotherm of 35 min at 700 °C, as previously used bySilva (2014); the tests were conducted on a TA Instruments model TGA Q50 thermogravimetric analyser. After the calcination process, the crucible with the calcined sample was removed from the furnace and cooled in a normal labora-tory environment until it reached room temperature (~25 °C). The cru-cible was then reweighed to determinate the sample weight loss. This procedure was performed three times for each sinter feed sample to produce samples of sufficient mass for the characterisation (physical, chemical and mineralogical) and sintering tests.
For the sintering tests, the calcined sinter feed samples (C1, C2, C3 and C4) were mixed with lime (CaO) and activated charcoal in the fol-lowing proportions: 80 wt.% calcination product, 19.35 wt.% CaO and 0.65 wt.% charcoal. Because of the intrinsic characteristics of this iron ore sample, water was carefully added to the mixture during the granu-lation step to avoid deformation of the sintering bed (Sakamoto et al., 1993; Sakamoto et al., 1997). The control was done by visual inspection. Then, the granulated mixture (approximately 100 g) was placed over a refractory brick and sintered in the same furnace used in the calcination tests. After the sintering process, the samples were cooled in the furnace under natural atmosphere until they reached environmental tempera-ture (~25 °C).
The run conditions for the sintering tests were as follows: i) natural atmosphere (air), ramp of 5 °C/min from 25 to 300 °C, isotherm of 10 min at 300 °C; ii) ramp of 5 °C/min to 700 °C, isotherm of 10 min at 700 °C; iii) ramp of 10 °C/min to 1000 °C, isotherm of 10 min at 1000 °C; iv) ramp of 10 °C/min to 1200 °C, isotherm of 10 min at Table 1
Constitutions of the natural sinter feed samples.
Natural sinter feed sample
Proportions of particles (wt.%)
Nucleating (−3.36 + 1.182 mm)
Intermediate (−1.182 + 0.209 mm)
Adherent (−0.209 mm)
1 70 … 30
2 55 15 30
3 30 15 55
4 30 … 70
Table 2
Chemical composition and ignition loss (LOI) of the samples studied: natural sinter feed (SF), calcined sinter feed (C) and sinter (S).
Chemical composition (wt.%) Sample
Type Condition
1 2 3 4
Fe(T) SF 64.10 64.20 64.40 64.60
C 67.58 67.60 67.65 67.72
S 58.70 58.55 59.96 59.22
FeO SF 0.20 0.20 0.20 0.20
S 0.93 0.74 0.38 0.42
SiO2 SF 1.34 1.39 1.36 1.29
C 1.26 1.36 1.36 1.19
S 2.02 1.40 1.41 1.26
Al2O3 SF 0.72 0.73 0.76 0.77
C 0.84 0.83 0.94 0.92
S 0.89 0.74 0.88 0.82
CaO SF 0.04 0.04 0.03 0.03
S 12.42 12.51 11.37 12.50
MgO SF 0.03 0.04 0.04 0.04
C 0.06 0.06 0.07 0.06
S 0.15 0.18 0.15 0.15
TiO2 SF 0.05 0.05 0.06 0.06
C 0.07 0.07 0.08 0.08
S 0.06 0.05 0.07 0.06
P SF 0.17 0.17 0.16 0.16
C 0.17 0.17 0.17 0.15
S 0.17 0.18 0.16 0.15
Mn SF 0.06 0.06 0.06 0.06
C 0.07 0.06 0.07 0.06
S 0.06 0.06 0.06 0.06
LOI SF 6.11 6.07 5.67 5.46
1200 °C; v) ramp of 10 °C/min to 1280 °C, isotherm of 2 min at 1280 °C. The twofirst steps were performed to avoid damaging the ceramic brick on which the sintering bed was deposited. Steps iii–v were based on the
results ofHsieh and Whiteman (1989), who reported that the hydration and dehydration of lime (CaO), water vapour condensation, humidity evaporation and coal combustion occur by 700 °C. From 700 to 1280 °C (steps ii–v), the reactions in the solid and liquid states occur
in the sintering bed (Loo and Leung, 2003; Zhang et al., 2012).
2.2.2. Characterisation of natural, calcined and sintered samples
2.2.2.1. Chemical characterisation.The chemical compositions of the sin-ter feed and sinsin-ter samples (Fe(T), FeO, SiO2, Al2O3, P, Mn) were deter-mined by inductively coupled plasma optical emission spectrometry (Spectro Agilent, model 725). The FeO and LOI determinations were performed using the gravimetric method. The calcined samples were analysed by X-ray spectrometry (Spectrometer Philips-PANalytical, model MagiX).
2.2.2.2. Mineralogical and textural characterisation.The minerals and crystalline phases in the investigated samples (i.e. sinter feed (SF1, SF2, SF3 and SF4), calcined sinter feed (C1, C2, C3 and C4) and sinter (S1, S2, S3 and S4)) were identified by X-ray diffraction (total powder method). For this purpose, a diffractometer (PANalytical, model Empy-rean) equipped with a Cu-Kαradiation source (λ= 1.5405 Å) was used. The samples were scanned from 2°≤θ≤70° at an interval of 2°. The
da-tabase PDF-2/ICDD was used to identify the minerals and crystalline phases in the diffractograms.
Optical microscopy (Leica, model DLP) was used for microtextural analysis of the samples of iron ore and the calcination and sintering products. The semiquantification of mineral phases present in the iron ore sample was performed by point count (Jones, 1987).
The microtextural analysis and the chemical compositions of the phases present in the iron ore sample and in the calcination and sintering products were carried out by scanning electron microscopy (SEM) on a JEOL model JSM 6360 LV equipped with an energy-dispersive X-ray spectroscopy (EDS) unit (ThermoNORAN model QUEST). For this purpose, the sample sections were previously covered
with a thin skin (20 nm) of Au. The SEM/EDS operations were carried out at voltage of 20 kV and a current of 10 nA.
2.2.2.3. Physical characterisation.The densities of samples were deter-mined using a Quantachrome model 1200e ultra pycnometer. The run conditions for the density determinations were as follows: small sample holder, 4 min purge with helium gas at environmental temperature and a target pressure of 127 kPa. Four measurements were performed on each sample. Thefinal result was calculated from the average values of three measurements with a standard deviation of 0.005%.
The specific surface area and porosity parameters of samples were measured using a Quantachrome model Nova 1200e surface and poros-ity analyser. The run conditions for the determinations were as follows: degassing for 17 h at 195 °C, as previously established by thermal anal-ysis (Silva, 2014); stabilisation time of 180 s. The multipoint Brunauer–
Emmett–Teller (BET) method was used to determine the specific
sur-face area. The pore size distribution was determined using the Barrett–Joyner–Halenda (BJH) model.
2.2.2.4. Mechanical properties of sinter samples.The mechanical resis-tances of sintered samples were evaluated using the methodology de-scribed byYang and Loo (1997):
i—Determination of microhardness by Eq.(001)
HV¼Xii¼¼k1ðHVÞið%VolÞi
ð01Þ
where, i is a considered phase, and %Vol is volume proportion of a con-sidered phase.
ii—Determination of microtumbler (TI) by Eq.(02):
TI¼ð0:000231ÞHVþð0:809Þ ð02Þ
The EmcoTest microhardness, model DuraScan 10 was used to de-termine the Vickers Hardness (HV) of the polished sections of sintered samples. Since the magnetite was not identified in all sintered samples and the calcium silicates occurred in small areas to accommodate the adequate indentation, only the phases hematite and calcium ferrite were considered in HV determination. The strength applied was respec-tively of 0.1 and 0.3 kgf for hematite and calcium ferrites, determined after preliminary tests, considering the perfect visualisation of the im-pressions of diagonals. For determination of microhardness of each phase, 10 measurements with 15 s of indentation were performed. Thefinal microhardness value for each phase was the arithmetic mean of the 10 measurements.
3. Results and discussion
3.1. Chemical characterisation
Table 2presents the chemical composition of natural sinter feed (SF), calcined sinter feed (C) and sinter (S). As evident from the results in the table, the Fe(T)grades of all sinter feed samples were higher than 64% and the ignition loss (LOI) values varied from 5.5 to 6.1%. These values are mainly related to the high grade of goethite in these samples because the alumina (Al2O3) content normally ascribed to kaolinite is low. The silica (SiO2) grades of all analysed samples were below the specification limit of a standard sinter feed (4–6%), and the phosphorus
(P) grades were much higher than standard specifications (maximum 0.07%) (Lima, 1997).
After the calcination process, a considerable enrichment in Fe con-tent was observed; this enrichment is related to the thermal decompo-sition of goethite at 320 °C. In their differential thermal analysis of the iron ore sample used in this study,Silva (2014)verified the appearance of an endothermic peak at approximately 320 °C. In addition, very small weight losses for this iron ore sample at temperatures above 700 °C have also been verified. According toLiu et al. (2012, 2013a, 2013b) Table 3
Mineral phases present in the studied samples: natural sinter feed (SF), calcined sinter feed (C) and sinter (S).
Mineral phase Sample
Type Condition
1 2 3 4
Goethite (FeOOH) SF X X X X
C N/I N/I N/I N/I
S N/I N/I N/I N/I
Hematite (Fe2O3) SF X X X X
C X X X X
S X X X X
Magnetite (Fe3O4) SF X X X X
C N/I N/I N/I N/I
S N/I N/I N/I X
Quartz (SiO2) SF X X X X
C N/I N/I N/I N/I
S N/I N/I N/I N/I
Anorthite (Al2O3·CaO·2SiO2) SF N/I N/I N/I N/I
C N/I N/I N/I N/I
S X X N/I N/I
Gehlenite (Al2O3·2CaO·SiO2) SF N/I N/I N/I N/I
C N/I N/I N/I N/I
S N/I X N/I N/I
Brownmillerite (CaO·Fe2O3) SF N/I N/I N/I N/I
C N/I N/I N/I N/I
S X N/I X X
Legend: X—presence; N/I—not identified.
andChen (2013), the dehydroxylation of goethite occurs at approxi-mately 300 °C.
The FeO contents after the sintering process (0.38% to 0.93%) were higher compared to those of the sinter feed samples (0.2%) (Table 2). This result can likely be ascribed to the partial reduction of hematite to magnetite (via solid-state reaction) or formation of magnesiowustite
in the presence of a liquid phase at temperatures above 1050 °C (Kalenga and Garbers-Craig, 2010). Magnetite was not identified in cal-cined products (Table 3) due to its very low concentration.
The average chemical composition of commercialised Brazilian sin-ters are as follows (Silva, 2014): Fe(T): 62.0–57.0%; FeO: 5.6–7.4%; CaO: 9.99–10.6%; SiO2: 5.60–5.77%; Al2O3: 0.94–1.49%; P:
0.050–0.064%; Mn: 0.38–0.61%; MgO: 1.25–1.41%). As evident in
Table 2, the chemical‘quality’of sinters produced under the
experimen-tal conditions were superior, with the exceptions of the FeO, CaO and P grades, to current Brazilian sinters produced using iron ores with low goethite content. However, metallurgical properties such as tumble index, reducibility, have to be performed with sintered samples of this material from large scale.
3.2. Mineralogical and textural characterisation
3.2.1. X-ray diffraction
Table 3presents the main phases identified in the studied natural sinter feed (SF), calcined (C) and sinter (S) samples produced under the experimental conditions. Only the hematite and goethite were iden-tified in the SF samples, likely because of the very small proportions of other mineral phases (quartz, magnetite, kaolinite, gibbsite and talc) identified bySilva (2014)in the fraction size−0.037 mm of this iron
ore. All of the calcined samples contained only hematite in their miner-alogical composition, which is ascribed to the thermal decomposition at approximately 320 °C of goethite present in SF (Silva, 2014; Leonel, Table 4
Microtextural composition of sinter feed and sintered samples.
Sample Microtextural composition (vol.%)
Sinter feed Heg Hel HeM HeT Mg Gob Goe GoT QZ
SF1 18.3 6.0 16.3 40.6 0.03 2.6 55.6 58.2 1.1
SF2 19.0 6.3 17.7 43.0 0.03 2.5 53.1 55.6 1.4
SF3 26.4 6.8 16.9 50.1 0.05 2.1 45.5 47.6 2.2
SF4 30.1 6.9 15.1 52.1 0.06 2.0 43.4 45.4 2.4
Sinter Hematite Magnetite Silicatesa Ferritesb Pores
S1 22.9 - 7.7 47.1 22.3
S2 33.1 - 5.2 33.8 27.9
S3 24.0 - - 40.6 35.4
S4 41.7 0.6 1.1 18.9 37.7
Heg—granular hematite; Hel—lamellar hematite; HeM—martitic hematite; HeT—total hematite; Mg—magnetite; Qz—quartz Gob—botryoidal goethite; Goe—earthy goethite; GoT—total goethite.
HeT= Heg+ Hel+ HeM;GoT= Gob+ Goe. aSystem Al
2O3·CaO·SiO2. b System CaO·Fe
2O3.
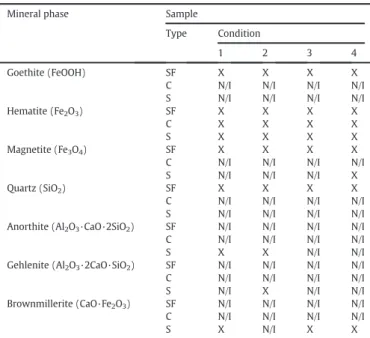
Fig. 1.Typical optical microscopy images of the investigated iron ore sample studied illustrating: (a) botryoidal goethite—Goband earthy goethite—Goe; (b) earthy goethite—Goeand massive goethite—Gom; (c) hematite morphologies (granular and lamellar—light region) in the earthy goethitic (Goe) matrix (grey region); (d) mineral association between goethite and hematite martitic—HeM(light region). Note: Pr—pore.
2011; Liu et al., 2012, 2013a, 2013b; Chen, 2013). Hematite was identi-fied in all of the sinter samples; however, magnetite was identified only in sinter sample S4. The calcium silicates (identified as anorthite and gehlenite) were observed in sinter samples S1 and S2. Calcium ferrites (identified as brownmillerite, in accordance withWebster et al. (2013)) were observed in all sinter samples except sinter sample S2.
3.2.2. Optical microscopy
Table 4 present the semi-quantitative mineralogical and microtextural compositions of sinter feed and sintered products, per-formed by optical microscopy. Magnetite was identified only in S4, which is coherent with XRD data presented before. Probably, it is due to the higher proportion of adherent particles, which have higher pro-portion of magnetite as reported bySilva (2014). The main minerals in the studied iron ore sample, as identified and semi-quantified by op-tical microscopy, were goethite (48.8 wt.%) and hematite (50.1 wt.%). The typical microtextural aspects of this sample are shown inFig. 1. The goethite occurs in massive, earthy and botryoidal forms (Figs. 1a and 1b). The hematite occurs as granular, lamellar and martite microtextures (Fig. 1c). High porosity (dark regions in images) and fre-quent association between goethite and martite were observed in this ore (Fig. 1d).
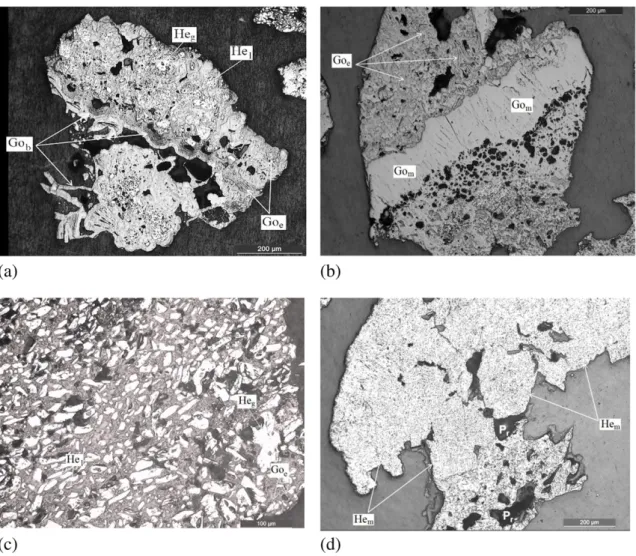
As evident in images of the calcination products presented inFig. 2, the products were highly porous, which is related to the porosity in-crease due to goethite's thermal decomposition to hematite (Fig. 2a). The micropores in the martite were converted into mesopores through
coalescence. In addition, the hematite preserved the original texture of goethite (Figs. 2c). These images confirm that hematite was the major-ity phase in the calcination products, consistent with the X-ray diffrac-tion results (Table 3).
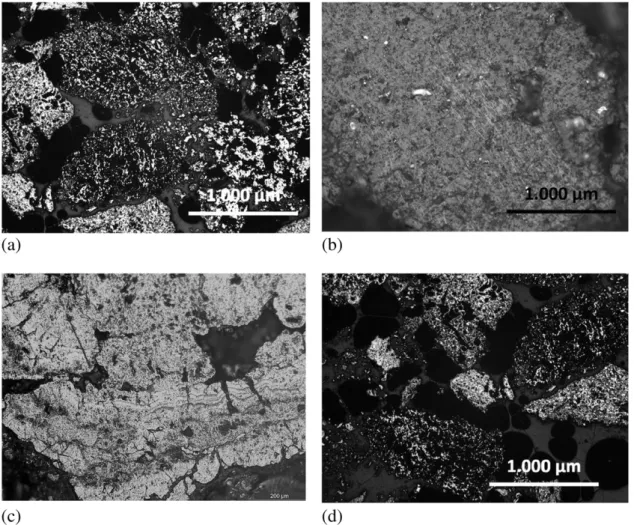
Fig. 3presents optical microscopy images of the sinter products. Fig. 3a shows the main phases in sinter sample S1: secondary hematite and calcium ferrites. The crystals of hematite exhibit a subeuedric mor-phology, reflecting its irregular contacts. The calcium ferrites constitute the matrix, and the calcium ferrite crystals also exhibit subeuedric mor-phology. The pores exhibit diverse sizes and forms.
The main microstructural aspect observed in sinter sample S2 (Fig. 3b) was the presence of the eutectic constituent. This constituent in iron ore sinters is defined as a structure of the CaO·SiO2·Fe2O3system that is formed by the liquid decomposing into two solids at tempera-tures lower than 1300 °C during the cooling step, where the approxi-mate chemical composition of the liquid is 20 wt.% CaO, 35 wt.% SiO2 and 45 wt.% Fe2O3(Inazumi, 1975; Kasai and Saito, 1996; Kasai et al.,
2000; Nyembwe, 2011). In addition, in the case of sinter sample S2, small crystals of calcium silicates were observed near the pores, as also observed byMagalhães et al. (2007).
The phases present in sinter sample S3 (Fig. 3c) and its microstruc-tural aspects were identical to those observed in sinter sample S1: cal-cium ferrites and hematite in a highly porous matrix.Fig. 3d shows crystals of calcium silicates inside the pores of sinter sample S4. These crystals can be detrimental to the mechanical and metallurgical proper-ties of the sinter because the calcium silicates are poorly reducible brit-tle phases (Loo and Bristow, 1994).
Fig. 2.Typical optical microscopy images of calcined sinter feed samples: (a) C1, highlighting the diversity of the pores' (dark regions) size distribution; (b) C2, illustrating the martite occurrence; (a) C3, showing the hematite with the same microtextural characteristic originating from goethite botryoidal; (b) C4, highlighting the majority presence of the hematite.
In general, we observed no correspondence among sintering mix-ture compositions (proportion and particle type in the sinter feed sam-ple) and the mineralogical composition of the obtained sinter samples. This lack of correspondence is likely related to the fact that the interme-diate particles (1.182–0.209 mm) in the sinter feed sample did not
ex-hibit well-defined behaviour. These intermediate particles sometimes promoted a balance between hematite and calcium ferrites, as observed in sinter sample S2 (33%v/v average for both phases). In other cases, they promoted the formation of calcium ferrites, such as in the case of sinter sample S3 (41%v/v calcium ferrite and 24%v/v of hematite). SeeTable 4.
An increase in the proportion of adherent particles (−0.209 mm) in
the sinter feed sample promoted an increase in porosity in the sinter samples. Sinter sample S4 exhibited the highest porosity value (38%v/ v) and the highest proportion of hematite (42%v/v). Therefore, both the mineralogy of the iron ore sample and its previous calcination strongly influenced the sinter structure, consistent with the results of Kimura and Murao (2013)andWebster et al. (2013).
3.2.3. Scanning electronic microscopy with energy-dispersive X-ray spec-troscopy (SEM/EDS)
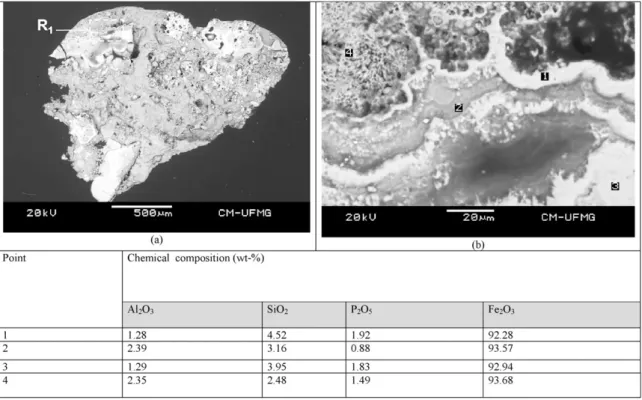
A backscattered electron (BSE) image of a particle of the studied iron ore, which is constituted basically by goethite, is presented inFig. 4a. Fig. 4b presents the region R1 of this particle, where the chemical anal-ysis was performed by EDS. As evident inFig. 4a, high P2O5levels (0.88
to 1.92%) are present in all of the analysed points in region R1. The Al2O3 grades in earthy goethite (points 1 and 4) are higher than in massive and botryoidal goethite, where the SiO2grades (points 1 and 3) were higher than in earthy goethite.
Fig. 5presents the BSE image of a goethite-martite mineral associa-tion. As evident in thefigure, the particle has an external surface with high rugosity. The EDS analysis revealed the presence of Al2O3 in martite, which might stem from the isomorphic substitution of Fe3+ by Al3+in its crystalline structure. P
2O5and SiO2were identified in goe-thite (point 1).
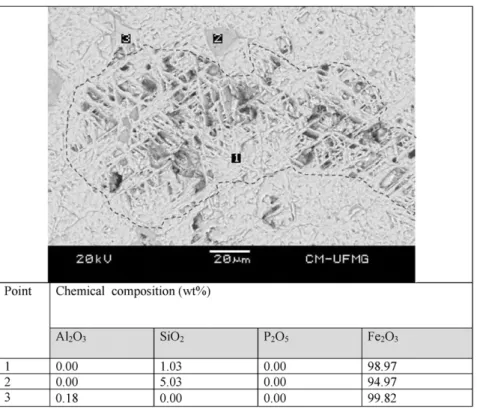
Fig. 6presents a BSE image of a typical martite crystal and its EDS chemical composition (points 1, 2 and 3), which have a high Fe2O3 grade (N94.97%).Figs. 7, 8 and 9present typical BSE images of sinter samples. On the basis of the chemical composition (EDS) of the points in these images, hematite, calcium ferrites and calcium silicates were identified. The calcium ferrites and calcium silicates phases were previ-ously identified in X-ray diffractograms of the sinter samples as brownmillerite, anorthite and gehlenite, respectively. All of the sinter particles have subeuedric crystals and high porosity.
EDS analysis of the sinter samples revealed that P2O5was present in calcium silicate sites (Fig. 8—point 1). This result is consistent with the
value reported byMagalhães et al. (2007). However, the higher propor-tion of P2O5(23.8 to 27.11%) and CaO (45.4 to 47.13%) can be ascribed to apatite (Fig. 7), which was not identified in any sinter feed sample (op-tical microscopy and XRD) due its low proportion in those samples. Fig. 3.Typical optical microscopy images of sintered samples: (a) S1; (b) S2; (c) S3; (d) S4. Note: Hem—secondary hematite (light region); FC (or CF)—calcium ferrites (grey region); CE —eutectic structure; CS—calcium silicates (dark-grey regions); Pr—pore (dark regions). White arrows in image‘b’indicate small crystals of calcium silicates arranged in the vicinity of pores.
The CaO grade of the eutectic constituent in sinter sample S2 was ap-proximately 21% (Fig. 8), which is in accordance with the CaO content of the sinter sample reported byKasai and Saito (1996).
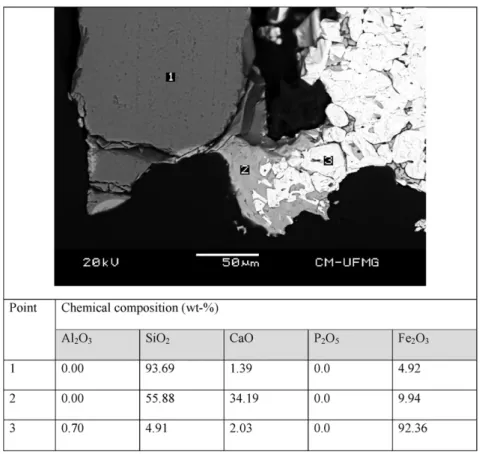
Fig. 9shows a quartz particle in sinter sample S3; the quartz particles do not react during the sintering process. As evident in the EDS analysis results, a balance exists between the Ca and Si levels in the calcium sil-icate chemical composition.
3.3. Physical characterisation
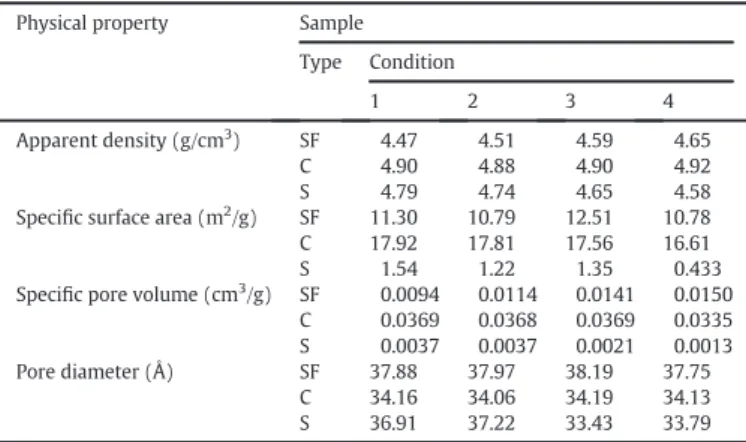
Table 5summarises the physical properties of the natural sinter feed (SF), calcined sinter feed (C) and sinter (S) samples. The densities of the SF samples slightly increased from SF1 to SF4; this increase is likely re-lated to the lower LOI levels in the sinter feed samples. After the calcina-tion process, the densities were approximately constant at 4.90 g/cm3.
Fig. 5.—BSE image showing the typical mineral association between goethite (grey region) and martite (region of greater reflection) occurring in the iron ore sample. This image is from fraction size−2.36 mm + 1.67 mm, and the indicated points 1 and 2 show the chemical composition of the goethite massive and martite, respectively.
Fig. 4.(a) Backscattered electron (BSE) image of a goethite particle in the fraction size−2.36 mm + 1.67 mm of the iron ore sample; (b) details of the R1 region with several goethite morphologies in the particle exhibited in image‘a’; the chemical composition of this particle is indicated by points 1, 2, 3 and 4, which represent Gob—goethite botryoidal, Goe— goethite earthy, Gom—goethite massive and Goe—goethite earthy, respectively.
Fig. 6.BSE image of martite with a typical microporous microtexture in the fraction size−2.36 mm + 1.67 mm of the iron ore sample. The indicated points 1, 2 and 3 in the image show the chemical composition of this mineral phase.
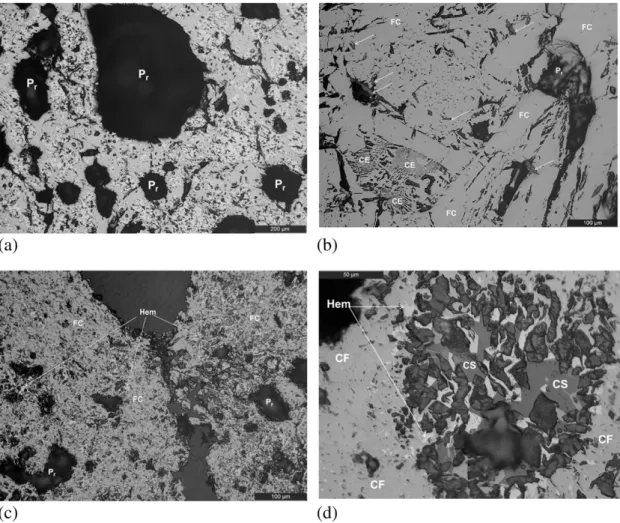
Fig. 7.BSE image of the sinter sample S1 illustrating small crystals of calcium silicates (dark-grey region) dispersed within an all-calcium ferrite matrix (grey region). The indicated points 2, 3 and 4 show the chemical composition of apatite. The point 1 shows the chemical composition of calcium ferrite.
Fig. 8.BSE image of sinter sample S2 showing the presence of the eutectic constituent (or structure), hematite and apatite, as indicated by points 1, 2 and 3, respectively. These points also represent the chemical compositions of the mineral phases determined by EDS analysis.
Fig. 9.BSE image of sinter sample S3. The chemical composition of the main mineral phases presents are indicated by points 1 (quartz, dark-grey region), 2 (calcium silicate, grey region) and 3 (hematite, region of greater reflection).
The thermal decomposition of the goethite to hematite in the calci-nation step (Table 2) resulted in a significant increase in the specific sur-face area and specific pore volume. This behaviour is consistent with the results of the studies reported byNaono et al. (1987),Weissenborn et al. (1994),Zhang et al. (2010)andLiu et al. (2013a, 2013b).
The specific surface areas of the sinter samples were smaller than those of the calcination products. This result is related to pore structure destruction by the sintering process (Nampi et al., 2011; Strezov et al., 2011).
3.4. Mechanical properties of sinter samples
Table 6presents the values of microhardness and microtumbler of the sintered samples calculated by equations(01) and (02). As can be observed, the microhardness of S1 (70% nucleating particles/30% adher-ent particles) increased from 639 HV to 647 HV in S4 (30% nucleating particles/70% adherent particles). The substitution of 15% of nucleating particles by intermediate particles (S2) resulted in decreasing of micro-hardness. Opposite behaviour happened when 15% of adherent particles were replaced by intermediate particles (S3).
The results of microhardness for hematite and calcium ferrites deter-mined in this work are coherent with the values deterdeter-mined bySinha and Ramma (2009): hematite (525–1246 HV) and calcium ferrite
(454 HV–974 HV). It was verified the small reproducibility of
micro-hardness values determined. In accordance withBristow and Loo (1992)the small reproducibility of the microhardness determinations of sintered samples in bench scale can be ascribed to the irregularity measurements of cracks, which are associated to the residual inside stresses.
The microtumbler of sintered samples varied from 94.8% (S2) to 98.1% (S3). No relationship between the proportions of nucleate, inter-mediate and agglomerate particles used in mixture of sinter tests with the results of microtumbler calculated from Eq.(02)was identified.
4. Conclusions
On the basis of studies of bench-scale calcination followed by a sintering step conducted with an iron ore with a high grade of goethite, we concluded that all of the sinter feed samples exhibited an Fe grade greater than 64% and a very high P grade (~0.17%). After the calcination process, an enrichment of 3.1–3.4% of the Fe grade was observed
be-cause of the thermal decomposition of goethite to hematite, which in-volves the loss goethite's hydroxyl group. The sinter samples exhibited an average Fe grade of 59.1%. The main mineral phases in the iron ore sample were goethite and hematite. In the calcined samples, only hema-tite was identified because of the thermal decomposition of goethite at 320 °C. In the sinter samples, hematite, calcium ferrite (brownmillerite) and calcium silicate (anorthite and gehlenite) were identified. The sites for phosphorus occurrence were calcium silicates and apatite (an aver-age of 26.1% by EDS analysis). Increases were observed in the specific surface area, specific pore volume and pore diameter of the calcined samples compared to those of the raw materials. The lowest values of specific surface area observed in the sinter samples (0.43–1.54 m2/g)
compared to the calcined samples (16.6–17.9 m2/g) are likely related
to the destruction of the pore structure by the sintering process. No re-lationship between the proportions of nucleating, intermediate and ag-glomerate particles used in mixture of sinter tests with the results of microtumbler was identified.
Acknowledgements
The authors gratefully acknowledge the financial support by Fapemig and PROPP/UFOP, CAPES, CNPq through scholarships for two authors and Vale S.A by providing the iron ore sample.
References
MI, Al-Wakeelm, El-Rahman, M.K., 2006.Beneficiation of low grade Ghorabi iron ore, Bahariya Oasis, Egypt: a case study. Min. Proc. Ext. Metall. (Trans. Inst. Mineral Metall. C) 115 (4), 177–182.
Araujo, A.C., Amarante, S.C., Souza, C.C., Silva, R.R.R., 2003.Ore mineralogy and its rele-vance for selection of concentration methods in processing of Brazilian iron ores. Min. Proc. Ext. Metall. (Trans. Inst. Mineral Metall. C) 112, C44–C64.
Bristow, N.J., Loo, C.E., 1992.Sintering properties of iron ore mixes containing titanium. ISIJ Int. 32 (7), 819–828.
Carlos, D.U., Uieda, L., Barbosa, V.C.F., 2014.Imaging iron ore from the Quadrilátero Ferrífero (Brazil) using geophysical inversion and drill hole data. Ore Geol. Rev. 61 (2014), 268–285.
Chen, Y., 2013. Thermal properties of nanocrystalline goethite, magnetite, and maghemite. J. Alloys Compd. 553, 194–198.
Hsieh, L.H., Whiteman, J., 1989.Sintering conditions for simulating the formation mineral phases in industrial iron ore sinter. ISIJ Int. 29 (1), 24–32.
Inazumi, T., 1975.Applied Mineralogical Studies on Self-Fluxing Sinter of Iron Ore PhD Thesis Tokyo University, Tokyo, Japan.
Jesus, C.A.G., 2013.Brazilian Mineral Summary. Publishing by National Department for Mineral Research—DNPM site (Accessed 03 May 2014).
Jones, M.P., 1987.Introduction to applied mineralogy. Applied Mineralogy a Quantitative Approach 1. Graham and Trotman Ltd., Oxford-Great Britain, pp. 1–12 259p. Chapter. Kalenga, M., Garbers-craig, A., 2010.Investigation into how the magnesia, silica, and alu-mina contents of iron ore sinter influence its mineralogy and properties. J. South. Afr. Inst. Min. Metall. 110, 447–456.
Kasai, E., Saito, F., 1996.Differential thermal analysis of assimilation and melt-formation phenomena in the sintering process of iron ore. ISIJ Int. 36 (8), 1109–1111. Kasai, E., Sakano, Y., Kawaguchi, T., Nakamura, T., 2000.Influence of properties offluxing
materials on theflow of melt formed in the sintering process. ISIJ Int. 40 (9), 857–862.
Kimura, M., Murao, R., 2013.Continuous Cooling transformation (CCT) Concept for iron Ore sintering using in Situ Quick X-ray diffraction and Confocal Laser Microscope. ISIJ Int. 53 (12), 2047–2055.
Leonel, C., 2011.Calcination Process Study as Unitary Additional Operation on High LOI Level Iron Ore Pelletizing PhD Thesis Federal University of Minas Gerais, Belo Horizonte, Brazil (in Portuguese).
Lima, R.M.F., 1997.Starch and amines adsorption on hematite and quartz surfaces and its influence inflotation PhD Thesis Federal University of Minas Gerais, Belo Horizonte, Brazil (238pp in Portuguese).
Liu, H., Chen, T., Chang, J., Zou, X., Frost, R., 2013a.The effect of hydroxyl groups and sur-face area of hematite derived from annealing goethite for phosphate removal. J. Colloid Interface Sci. 398, 88–94.
Table 5
Physical properties of the studied samples: natural sinter feed (SF), calcined sinter feed (C) and sinter (S).
Physical property Sample
Type Condition
1 2 3 4
Apparent density (g/cm3) SF 4.47 4.51 4.59 4.65
C 4.90 4.88 4.90 4.92
S 4.79 4.74 4.65 4.58
Specific surface area (m2/g) SF 11.30 10.79 12.51 10.78
C 17.92 17.81 17.56 16.61
S 1.54 1.22 1.35 0.433
Specific pore volume (cm3/g) SF 0.0094 0.0114 0.0141 0.0150
C 0.0369 0.0368 0.0369 0.0335
S 0.0037 0.0037 0.0021 0.0013
Pore diameter (Å) SF 37.88 37.97 38.19 37.75
C 34.16 34.06 34.19 34.13
S 36.91 37.22 33.43 33.79
Table 6
Microhardness and microtumbler of sintered samples.
Sample Microhardness (HV) Microtumbler (%)
Hematite Calcium ferrite Agglomerate
S1 853 ± 339 535 ± 168 639 95.7
S2 794 ± 125 412 ± 157 601 94.8
S3 977 ± 213 605 ± 121 743 98.1
S4 699 ± 160 598 ± 247 647 95.8
Liu, H., Chen, T., Xie, Q., Zou, X., Qing, C., Frost, R., 2012.Kinetic study of goethite dehydra-tion and the effect of aluminium substitudehydra-tion on the dehydrate. Thermochim. Acta 545, 20–25.
Liu, H., Chen, T., Zou, X., Qing, C., Frost, R., 2013b.Thermal treatment of natural goethite: thermal transformation and physical properties. Thermochim. Acta 568, 115–121. Loo, C.E., Bristow, N., 1994.Mechanism of low-temperature reduction degradation of iron
ore sinters. Trans. Instn. Min. Metall. (Sect. C: Mineral processing and Extr. Metall.) 103, C126–C134.
Loo, C.E., Leung, W., 2003.Factors influencing the bonding phase structure of iron ore sin-ters. ISIJ Int. 43 (9), 1393–1402.
Loo, C.E., Witchard, D., Penny, G.C., 1994.Improving sintering performance of ore blend containing pisolitic ore. Trans. Instn. Min. Metall. (Sect. C: Mineral processing and Extr. Metall.) 103, C135–C146.
Loo, C.E., 2005.A perspective of goethite ore sintering fundaments. ISIJ Int. 45 (4), 436–448.
Magalhães, M.S., Brandão, P.R., Tavares, R.P., 2007.Types of goethite from Quadrilátero Ferrifero's iron ores and their implications in the sintering process. Trans. Instn. Min. Metall. (IMM Transactions Section C) 116, 54–64.
Mendes, M., Lagoeiro, L., 2012.Microstructures, crystallographic fabric development and deformation mechanisms in natural hematite aggregates deformed under varied metamorphic conditions. Journal of Structural Geology. 40, 29–43.
Nampi, P., Ghosh, S., Warrier, K., 2011.Calcination and associated structural modifications in boehmite and their influence on high temperature densification of alumina. Ceram. Int. 37, 3329–3334.
Naono, H., Nakai, K., Sueyoshi, T., Yagi, H., 1987.Porous texture in hematite derived from goethite: mechanism of thermal decomposition of goethite. J. Colloid Interface Sci. 120 (2), 439–450.
Nyembwe, M., 2011.Study of Sinter Reactions When Fine Ore is Replaced With Coarse Ore, Using an Infrared Furnace and Sinter Pot Tests PhD thesis University of Pretoria, Pretoria, South of Africa.
Okazaki, J., Higuchi, K., Hosotani, Y., Shinagawa, K., 2003.Influence of iron ore character-istics on penetrating behavior of melt into ore layer. ISIJ Int. 43 (9), 1384–1392. Rosière, C. A. 1996. A model for microstructural evolution of iron ore from Iron
Quadran-gle. Pat II—trame, texture and anysotropism of magnetic susceptibility. Geonomos, v.4, n.1, pp. 61–75 (in Portuguese).
Sakamoto, N., Niwa, Y., Komatsu, O., Noda, H., Kumasaka, A., 1993.Commercial produc-tion of iron ore agglomerates using sinter feeds containing a large amount offines ores. ISIJ Int. 33 (4), 454–461.
Sakamoto, N., Noda, H., Kawata, H., Ichikawa, K., Sato, H., 1997.A commercial production test of iron ore sinter using high amounts of pisolites ores and quality evaluation of the sinter products. ISIJ Int. 37 (11), 1066–1071.
Silva, M.S.S., 2014.Sintering in Bench Scale of Calcined Goethitic Iron Ore Dissertation Federal University of Ouro Preto, Ouro Preto, Brazil 145 pp. (in Portuguese). Sinha, M., Ramna, R.V., 2009.Effect of variation of alumina on the microhardness of iron
ore sinter phases. ISIJ Int. 49 (5), 719–721.
Strezov, V., Evans, T., Zymla, V., Strezov, L., 2011.Structural deterioration of iron ore par-ticles during thermal processing. Int. J. Miner. Process. 100, 27–32.
Umadevi, T., Brahmacharyulu, A., Roy, A., Mahapatra, P., Prabhu, M. and Ranjan, M. 2011. Influence of Iron Ore Fines Feed Size on Microstructure, Productivity and Quality of Iron Ore Sinter. ISIJ International 51, n. 6, 922–929.
Webster, N., Pownceby, M., Madsen, I., Kimpton, J., 2013.Effect of oxygen partial pressure on the formation mechanisms of complex Ca-rich ferrites. ISIJ Int. 53 (5), 774–781. Weissenborn, P., Dunn, J., Warren, L., 1994.Quantitative thermogravimetric analysis of
haematite, goethite and kaolinite in western Australian iron ores. Thermochim. Acta 239, 147–156.
Wolff, A.P., 2009.Characterization of Iron Ore Tailings from Vale's Mines M.Sc. disserta-tion Federal University of Ouro Preto, Ouro Preto, Brazil 90pp (in Portuguese). Yang, L.X., Loo, C.E., 1997.Structure of sinters formed from complex chinese iron ores. ISIJ
Int. 37 (5), 449–457.
Yang, L.X., Witchard, D., Yu, Z.N., 2000.Introduction of pisolitic goethite ore into a Chinese ore blend. ISIJ Int. 40 (7), 647–653.
Zhang, F., An, S., Luo, G., Wang, Y., 2012.Effect of basicity and alumina-silica ratio on for-mation of silico ferrite of calcium and aluminum. J. Iron Steel Res. Int. 19, 1–5. Zhang, W.J., Huo, C.F., Feng, G., Li, Y.W., Wang, J., Jiao, H., 2010.Dehydration of goethite to