Structural properties of CaCu
3
Ti
4
O
12
obtained by mechanical
alloying
A.F.L. Almeida
a, R.S. de Oli
v
eira
b, J.C. Go´es
c, J.M. Sasaki
d, A.G. Souza Filho
e,
J. Mendes Filho
e, A.S.B. Sombra
c,*
a
Departamento de Quı´mica Orgaˆnica e Inorgaˆnica, Centro de Cieˆncias, UFC, Fortaleza, Ceara, Brazil
bDepartamento de Cieˆncias de Natureza, Faculdade de Cieˆncias e Letras do Serta˜o Central (FECLESC), Uni
versidade Estadual do Ceara´ (UECE),
63900-000, Quixada, Ceara, Brazil
cLaborato´rio de O´ ptica Na˜o Linear e Cieˆncia dos Materiais (LOCEM), Departamento de Fı´sica, UFC Campus do Pici, Caixa Postal 6030, CEP 60,
455-760 Fortaleza, CE, Brazil
dLaborato´rio de Raios-X, Departamento de Fı´sica, UFC Campus do Pici, Caixa Postal 6030, CEP 60, 455-760 Fortaleza, CE, Brazil eLaborato´rio de Espalhamento de Luz, Departamento de Fı´sica, UFC Campus do Pici, Caixa Postal 6030, CEP 60, 455-760 Fortaleza, CE, Brazil
Received 12 July 2002; accepted 6 September 2002
Abstract
Mechanical alloying has been used successfully to produce nanocrystalline powders of CaCu3Ti4O12(CCTO), for the first time,
using two different experimental procedures. The milled CCTO were studied by X-ray powder diffraction, infrared and Raman
scattering spectroscopy. For two different milling procedures, CCTO was obtained after a couple of hours of milling (in average 30 h
of milling, depending on the reaction procedure). The X-ray diffraction (XRD) patterns indicate that the crystallite size is within the
range of 20/35 nm. After 100 h of milling the formation of CCTO was confirmed by X-ray powder diffraction in both procedures,
with good stability. We also prepare the CCTO ceramic using the traditional procedure described in the literature and compared the
physical properties of these samples with those ones obtained by milling process and good agreement was observed. The infrared
and Raman scattering spectroscopy results suggest that the increase of the milling time leads to the formation of nanocrystalline
CCTO, as seen by XRD analysis. These materials are attractive for capacitor applications and certainly for microelectronics,
microwave devices (cell mobile phones for example), where the decrease of the size of the devices are crucial. This milling process
presents the advantage that melting is not necessary and the powder obtained is nanocrystalline with extraordinary mechanical
properties. The material can be compacted and transformed in solid ceramic samples or used in others procedures of film preparation. The high efficiency of the process opens a way to produce commercial amount of nanocrystalline powders. Due to the
nanocrystalline character of this powder, their mechanical properties have changed and for this reason a pressure of 1 GPa is enough
to shape the sample into any geometry.
# 2002 Elsevier Science B.V. All rights reserved.
Keywords: Ceramics; Titanium oxide; XRD
1. Introduction
High dielectric constants (DC) have been found in oxides of the type CaCu3Ti4O12 [1/3] (CCTO) which shows a DC at 1 kHz of about 10 000 that is nearly
constant from room temperature to 300 8C. Oxides with the perovskite structure are well stabilised by their high DC which lead these class of materials to a big number of technological applications [4]. However, this behaviour is generally associated to ferroelectric or relaxor properties. In these cases the highest value of the DC is obtained during a phase transition (as a function of temperature) presented by the material.
The existence of the transition temperature event is generally a problem when one is talking about applica-* Corresponding author. Fax:/55-8-5287-4138
E-mail address: [email protected](A.S.B. Sombra).
www.elsevier.com/locate/mseb
tions of these materials. The reported results for CCTO shows that the DC is high but with small dependence on the temperature[3].
Such material isvery promising for capacitor applica-tions and certainly for microelectronics, microwave devices (cell mobile phones for example), where the miniaturization of the devices are crucial.
High DC ceramics make it possible to noticeably miniaturize passive microwave devices. Their size can typically be reduced in comparing with classical resona-tors and fillers by a factor ofor(relative DC)
The structure of CCTO was previously determined from neutron powder diffraction data[5]. It belong to space group Im3 (No. 204)[5].
Together with the traditional procedure of ceramic preparation, the mechanical alloying is proving to be a powerful technique to obtain any quantity of powder with controlled microstructure[6]. Nowadays the tech-nique is used in a large range of commercial products, moreover, most of these applications are on metallic domain. The mechanical alloying technique was already used, by our group, to obtain nanocrystalline ferro-electric ceramics of lithium niobate LN (LiNbO3) [7]. LN is a ferroelectric material with a trigonal crystal structure, with melting point at 1253 8C and Curie temperature at 1210 8C. It is characterised by a large pyroelectric, piezoelectric, electro-optic, photo-elastic coefficients and is naturally birefringent. Furthermore the technique isvery effective to produce nanocrystalline piezoelectric ceramics.
In this work we report the application of mechanical alloying technique to produce a polycrystalline material CCTO, from elementary powders. The advantage of this procedure remains on the fact that melting is not necessary, the powders are nanocrystalline and exhibits extraordinary mechanical properties [8]. It can also be easily shaped (injected, compacted, etc.) into any geometry or used in others procedures of film prepara-tion. The production, and the study of the properties of the CCTO ceramics is important in view of possible applications as bulk devices like microwave resonators and oscillators, thick and thin high DC films. In this paper we obtain, for the first time, the CCTO ceramic using the mechanical alloying. The milled CCTO were studied by X-ray powder diffraction, infrared and Raman scattering spectroscopy.
2. Experimental procedure
2.1. Sample preparation
Commercial oxides Ca(OH)2(Vetec, 97% with 3% of CaCO3), CaCO3 (Aldrich, 99%) and titanium oxide (TiO2) (Aldrich, 99%), CuO (Aldrich, 99%) were used in the CCTO preparation. The material was ground on a
Fritsch Pulverisette 6 planetary mill with the propor-tionality of Ca(OH)2-3CuO-4TiO2 (Reaction 1) and CaCO3-3CuO-4TiO2 (Reaction 2). Milling was per-formed in sealed stainless steel vials and balls under air. Mechanical alloying was performed for 1, 5, 10, 15, 20, 30, 60 and 100 h of milling for both procedures.
The reaction occurring during milling can be sum-marised as:
Reaction 1
Ca(OH)23CuO4TiO2 0
IMPACTS
CaCu3Ti4O12H2O
Reaction 2
CaCO33CuO4TiO2 0
IMPACTS
CaCu3Ti4O12CO2
The compounds were also prepared by the conv en-tional powder-sintering technique using the same start-ing materials. The materials were weighed accordstart-ing to the stoichiometric ratios and mixed thoroughly in an agate mortar. The mixed powder was submitted to calcination at 900 8C for 12 h. The samples were sintered in air at 1050 8C for 24 h. The milled samples also suffer calcination (C) and sintering (S) under the same conditions (Table 1).
2.2. X-ray diffraction
The X-ray diffraction (XRD) patterns were done using a Siemens D5000 equipment with Ka/Cu radia-tion in a Bragg-Brentano geometry at room temperature (300 K) by step scanning using powdered samples. We used 5 s for each step of counting time, with a Cu/Ka tube at 40 kV and 25 mA.
2.3. Infrared spectroscopy
The infrared spectra (IR) were measured using KBr pellets made from a mixture of powder for each glass composition. The pellet thicknessvaried from 0.5 to 0.6
Table 1
Procedure Reaction 2 Reaction 1
Milled 1 h CO1 OH1
Milled 5 h CO5 OH5
Milled 10 h CO10 OH10
Milled 15 h CO15 OH15
Milled 20 h CO20 OH20
Milled 30 h CO30 OH30
Milled 60 h CO60 OH60
Milled 100 h CO100 OH100
Milled 100 hcalcination CO100C OH100C Milled 1 hcalcination (C)sintering (S) CO100CS OHC100CS
Calcination COC OHC
Calcinationsintering COCS OHCS
mm. The IR spectra were measured from 400 to 1400 cm1
with a Nicolet 5ZPX FT-IR spectrometer.
2.4. Raman spectroscopy
Micro-Raman measurements were performed using a T64000 Jobin Yvon spectrometer equipped with an N2 -cooled charge coupled device to detect the scattered light. The spectra were excited with an argon-ion laser (5145 A˚ ). The spectrometer slits were set to give a spectral resolution always better than 2 cm1
. The Raman scattering was measured in a back scattering geometry directly from the powder.
3. Results and discussion
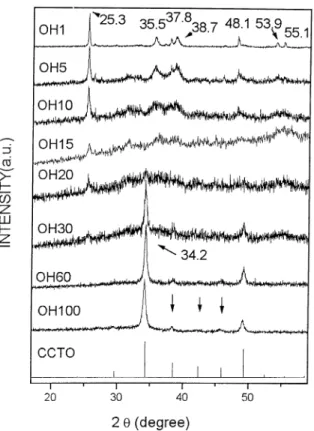
Fig. 1 presents the XRD pattern of reaction 1
(Ca(OH)2/3CuO/4TiO2) powder at different milling times (1, 5, 10, 15, 20, 30, 60 and 100 h) compared with the diffraction peaks of crystalline CCTO obtained from Ref.[9]. As can be observed the reaction 1 (Ca(OH)2/ 3CuO/4TiO2) becomes CCTO, as a result of grinding, as indicated by XRD.Fig. 1indicates that after l h of milling peaks at 25.3, 35.5, 37.8, 38.7, 48.1, 53.9, 55.1 degree were observed. In Fig. 2one show the XRD of the same milled samples for 1, 5 and 10 h of milling of
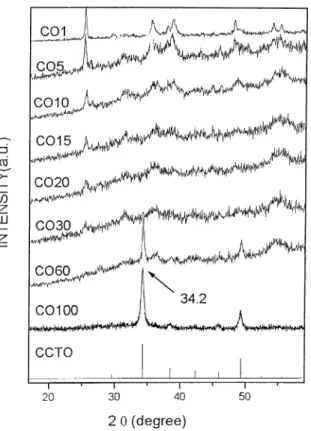
reaction 1 compared with the XRD of the precursors of this reaction [Ca(OH)2, CuO, and TiO2]. One can easily notice that the peaks associated to TiO2 and CuO are easily identified. The peaks associated to Ca(OH)2was not identified. After 15 h of milling (Fig. 1) all these peaks are very weak. At 20 h of milling the 25.38peak (associated to TiO2) is very weak. At 30 h of milling a strong peak at 34.28 associated to the CCTO phase is very strong. After 60 h of milling the CCTO phase is easily identified. After 100 h the phase is still present showing good stability. In Fig. 3 one has the same procedure for reaction 2 (CaCO3/3CuO/4TiO2). In
Fig. 3, for 1 h of milling, one can observe the peaks
associated to TiO2 and CuO (Fig. 4). Alter 60 h of milling the CCTO phase is easily identified. After 100 h the phase is still present showing good stability.
The analysis of the crystallite size (Lc) of the CCTO phase has been done for all samples using the Schemer’s equation[10],
Lc kl
bcosu (1)
wherek is the shape coefficient (value between 0.9 and 1.0), l is the X-ray wave length, b is the full width at half maximum (FWHM) of each phase and u is the Fig. 1. XRD of reaction l, Ca(OH)2/3CuO/4TiO2, milled samples
at different milling times (1, 5, 10, 15, 20, 30, 60 and 100 h) compared with the diffraction peaks of crystalline CCTO obtained from the literature.
Fig. 2. XRD of reaction 1, Ca(OH)2/3CuO/4TiO2, milled samples
diffraction angle. For this purpose, we chose the single peak near 34.28within the pattern and according to Im3 space group of CCTO. We have used the LaB6 (SRM 660*/National Institute of Standard Technology) pow-der standard pattern to determine the instrumental width (winst/0.0878) and afterward to calculate the crystallite size via Eq. (1). The b parameter has to be correct using the following equation:
b
ffiffiffiffiffiffiffiffiffiffiffiffiffiffiffiffiffiffiffiffiffiffi
w2
expw2inst
q
(2)
where wexp correspond to the experimental FWHM obtained for each sample. The crystalline size for all samples, assuming coefficientk/1, can be seen inFig.
5. The XRD patterns indicates that the grain size is Within the range of 20/35 nm. The averageLa values are 22 and 30 nm for reactions 1 and 2, respectively (Fig.
5).
In Fig. 6 and Fig. 7 we are comparing samples
prepared by milling with samples prepared by the conventional procedure. Looking for Fig. 6 (reaction 1) one can notice that a calcination (C) applied to the milled sample (OH100) lead to strong changes in the intensity and bandwidth of the diffraction peaks (OH100C).All the peaks present a shortening in the
bandwidth leading to an increase of the grain size. The posterior sintering procedure lead to an increase of this behaviour (OH100CS). When one compares these Fig. 3. XRD of reaction 2, CaCO3/3CuO/4TiO2, milled samples at
different milling times (1, 5, 10, 15, 20, 30, 60 and 100 h) compared with the diffraction peaks of crystalline CCTO obtained from the
literature. Fig. 4. XRD of reaction 2, CaCO3/3CuO/4TiO2, milled samples at
different milling times (1, 5, 10 h) compared with the diffraction peaks of the starting materials.
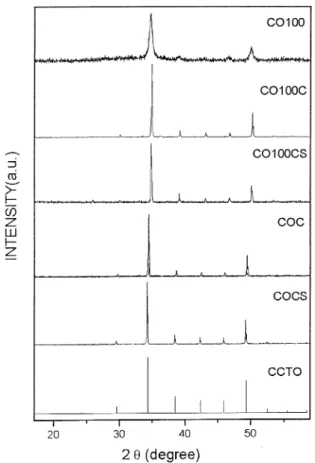
ceramics with the ceramics prepared with the normal procedure (OHC and OHCS) one can notice that there is a little shift of the diffraction peaks toward lower 20 values.
This is attributed to the surface effect on the nanocrystalline samples. It also appears for reaction 2
(Fig. 7).
InFig. 8one has the Raman spectra of the reaction 1
for the same group of time of milling. For 1 h of milling peaks at 144, 196, 395, 512, 635 cm1
are easily identified. In Fig. 9 we are comparing the Raman spectra of milled samples OH1, OH5 and OH10 with the Raman spectra of the precursor oxide TiO2. All the modes are associated to TiO2(Anatase). According to Ref.[11]the anatase phase showedvery intense bands at 720, 638, 515, 395, 196 and 143 cm1
. They correspond to the Raman active normal modes of representations A1g, 2B1g, 3Egof the space group D4h19. For sample OH1
(Fig. 9) all the peaks associated to the anatase phase arc
present (exception to the 720 cm1
mode). For sample OH5 the intensities of these peaks arc decreasing and a broad band around 400/500 cm
1
is increasing (Fig. 9). This behaviour is in good agreement of the XRD results. After 100 h of milling (sample OH100) a very broad Fig. 6. Comparison of the XRD of the milled sample (OH100) submitted to calcination (OH100C) and sintering (OH100CS) and the samples prepared by the traditional procedure (OHC and OFCS).
Fig. 7. Comparison of the XRD of the milled sample (CO100) submitted to calcination(CO100C) and sintering(COl00CS) and the samples prepared by the traditional procedure (COC and COCS).
Fig. 8. Comparison of the Raman spectra of reaction 1, Ca(OH)2/ 3CuO/4TiO2, milled samples at different milling times (1, 5, 10, 15,
band with peaks at 445, 572 and 730 cm1
is present in the Raman spectra (Fig. 8).
Looking now for the spectra of the calcined and sinterized sample (basic procedure) OHCS one has three main peaks at 445, 508 and 572 cm1
(Fig. 8).
Assign-ment of the Raman spectral features to the crystalline
CCTO has been reported previously [2], Scattering peaks at 445, 513 and 572 cm1
were observed [2]. The agreement between the previous Raman results for CCTO with our sample obtained by sintering process is remarkable.
InFig. 10one has a more detailed study of the Raman
spectra of the milled sample (OH100). Taking this sample and applying a calcination procedure (OH100C) the three sharp peaks associated to the basic ceramic, OHCS, is growing very fast and a broad peak at 730 cm1
is start increasing (OH100C in Fig. 10). After the sintering process, this peak is very clear (OH100CS in Fig. 10). The interesting point here is that this peak is not detectable in the conventional ceramic (OHCS) which was submitted to the same procedure (Fig. 10).
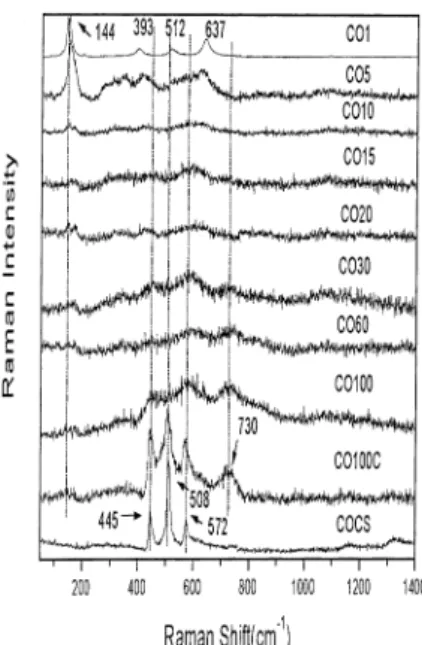
Similar behaviour was obtained for reaction 2. InFig. 11one has the Raman spectra of the reaction 2 for the same group of time of milling. For 1 h of milling, the peaks associated to the anatase phase is easily detected. Increasing the milling time, these peaks loose intensity andvery broad bands centred at 445, 572 and 730 cm1 appears at 100 h of milling (CO100 in Fig. 11).
In Fig. 12 we are comparing the milled ceramic of
reaction 2 (CO100) with the ceramic prepared in the traditional procedure. The behaviour is quite similar to the reaction 1 (Fig. 10). Taking this sample and applying a calcination (CO100C) the three main peaks associated to the basic ceramic, COCS, are present however, a broad peak at 730 cm1
is increasing in intensity. After the sintering process, this peak isvery clear (CO100CS). Fig. 9. Comparison of the Raman spectra of reaction 1, Ca(OH)2/
3CuO/4TiO2, milled samples at different milling times (1, 5, 10 h)
with the Raman shift of the starting materials (TiO2).
Fig. 10. Comparison of the Raman spectra of the milled sample (OH100) submitted to calcination (OH100C) and sintering (OH100CS) and the samples prepared by the traditional procedure (OHC and OHCS).
Fig. 11. Comparison of the Raman spectra or reaction 2, CaCO3/ 3CuO/4TiO2, milled samples at different milling tithes (1, 5, 10, 15,
This peak is not detectable in the conventional ceramic (COCS) which was submitted to the same procedure
(Fig. 12). The same behaviour was detected with
reaction 1 (Fig. 10). We believe that this mode is associated to a surface grain effect which is present in the ceramic submitted to the high energy milling (CO100 and OH100) and it is also present after the heating treatment (CO100CS and OH100CS).
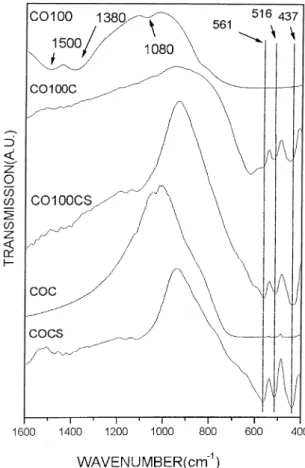
InFig. 13one has the IR spectra of the conventional
ceramics OHCS and COCS, together with the spectra of the starting materials.
One can notice that the CCTO phase present reso-nance absorptions at 561, 516 and 441 cm1
for OHCS and 561, 516 and 437 cm1
for COCS. Several authors have assigned [12] this region of absorptions with the titanium ion. These bands were associated to vTiO/ 653/550 cm
1
andvTiOTi/495/436 cm
1 .
InFig. 14andFig. 15we have the IR of the samples
OH100 and CO100. One can notice a very broad absorption in the region of 400/800 cm
1
and small absorptions at 1500, 1380 and 1080 cm1
for CO100 and 1486, 1390 and 1090 cm1
t for OH100. After the calcination and sintering three main absorptions around 561, 516 and 437 cm1
for the CO100CS and 561, 516 and 441 cm1
for the OH100CS were detected.
In summary, mechanical alloying has been used successfully to produce nanocrystalline powders of CCTO. These materials arevery promising for capacitor applications and certainly for microelectronics,
micro-wave devices (cell mobile phones for example), where the decrease of the size of the devices are crucial.
This milling process presents the advantage that melting is not necessary and the powder obtained is nanocrystalline with extraordinary mechanical proper-ties. The material, can be compacted and transformed in bulk ceramic samples or used in others procedures of film preparation. The reaction occurring during milling can be summarised as:
CaCO33CuO4TiO2 0
IMPACTS
CaCu3Ti4O12CO2
Ca(OH)23CuO4TiO2IMPACTS0 CaCu3Ti4O12H2O
The high efficiency of the process, opens a way to produce commercial amount of nanocrystalline pow-ders. Due to the nanocrystalline character of this powder, their mechanical properties have changed and for this reason a pressure of 1 GPa is enough to shape the sample into any geometry. Comparison of the structural properties between classical ceramics and mechanical alloyed ones were done in this paper. Fig. 12. Comparison of the Raman spectra of the milled sample
(CO100), submitted to calcination (CO100C) and sintering (CO100CS) and the samples prepared by the traditional procedure (COC and COCS).
4. Conclusions
In conclusion, mechanical alloying has been used successfully to produce nanocrystalline powders of CCTO. The obtained nanocrystalline ceramic CCTO were studied by X-ray powder diffraction, infrared and Raman scattering spectroscopy. After 30 h of milling the formation of CCTO was confirmed by X-ray powder diffraction. The infrared and Raman scattering spectro-scopy results suggest that the increase of the milling time lead to the formation of nanocrystalline CCTO, as seen by XRD analysis. These materials are attractive for capacitor applications and certainly for microelectro-nics, microwave devices (cell mobile phones for exam-ple), where the miniaturization of the devices is crucial. This milling process presents the advantage that melting is not necessary and the powder obtained is nanocrystal-line with extraordinary mechanical properties. The material, can be compacted and transformed in solid ceramic samples or used in others procedures of film preparation.
The high efficiency of the process, opens a way to produce commercial amount of nanocrystalline pow-ders. Due to the nanocrystalline character of this
powder, their mechanical properties have changed and for this reason a pressure of 1 GPa is enough to shape the sample into any geometry.
Acknowledgements
This work was partly sponsored by Ericsson EDB, Ericsson Research Center Brazil, under contract Erics-son/UFC-04/02 and by FINEP, CNPq, FUNCAP, CAPES (Brazilian agencies).
References
[1] M.A. Subramanian, D. Li, N. Duran, B.A. Reisner, A.W. Sleight, J. Sol. State Chem. 151 (2000) 323/325.
[2] A.P. Ramirez, M.A. Subramanian, M. Gardel, G. Blumberg, D. Li, T. Vogt, S.M. Shapiro, Solid State Comm. 115 (2000) 217. [3] M.A. Subramanian, A.W. Sleight, Solid State Sci. 4 (2002) 347. [4] N. Setter, E.L. Colla, Ferroelectric Ceramics, Birkhauser Verlag,
1993.
[5] B. Bochu, M.N. Deschizeaux, J.C. Joubert, J. Solid State Chem. 29 (1979) 291.
[6] (a) I.F. Vasconcelos, M.A. Pimenta, A.S.B. Sombra, J. Mat. Sci. 36 (2001) 587/592;
Fig. 14. IR of the milled sample (OH100), submitted to calcination (OH100C) and sintering (OH100CS) and the samples prepared by the traditional procedure (OHC and OHCS).
(b) I.F. Vasconcelos, R.S. de Figueiredo, S.J. Guedes de Lima, A.S.B. Sombra, J. Mat. Sci. Lett. 18 (1999) 1871.
[7] R.S. de Figueiredo, A. Messai, A.C. Hernandes, A.S.B. Sombra, J. Mat. Sci. Lett. 17 (1998) 449.
[8] (a) H. Gleiter, Nanostruc. Mater. 1 (1992) 1; (b) Idem, J. Appl. Crystallogr. 24 (1991) 79.
[9] A. Hassini, M. Gervais, J. Coulon, V.T. Phoue, F. Gervais, Mat. Sci. Eng. B 87 (2001) 164.
[10] L.V. Aza´roff, Elements of X-ray Crystallography, McGraw-Hill Book Company, 1968.
[11] M. Pineda, J.L.G. Fierro, J.M. Palacios, C. Silleruelo, E. Garcia, J.V. Ibarra, Appl. Surf. Sci. 119 (1997) 1.