Food Sci. Technol, Campinas, 35(2): 237-246, Abr.-Jun. 2015 237
Food Science and Technology ISSN 0101-2061
DI:
D http://dx.doi.org/10.1590/1678-457X.6438
1 Introduction
Aroma is one of the most important factors determining the character and quality of wine (Vilanova et al., 2007). Some of the aroma compounds are released directly from the grape berries while others are formed during the process of fermentation and aging (Rapp, 1998). The most important flavor compounds in wine made from neutral grape varieties are those arising from the fermentation process, which include mainly ethyl esters, acetate esters, higher alcohol, fatty acids, and aldehydes. Ethyl esters of hexanoic, octanoic, and decanoic acids and isoamyl and isobutyl acetates are often considered to give wine much of its characteristics (Ferreira et al., 1995). Interestingly, the grape flavor is also the major driver of preference for acceptance of the nectar (Voorpostel et al., 2014). Conde et al. (2007) state that wine aromas consist of several hundred volatile compounds at concentrations ranging from several mg/L to a few ng/L or even less. The olfactory perception threshold for each compound varies considerably; the olfactory impact of a compound will thus depend on whether it is present at concentrations above this perception threshold; thus, odor activity values (DAVs) were introduced to choose impact odorants (Li et al., 2006). Dnly the odorants with DAVs>1 can be perceived.
The aroma and flavor expression of wines has been considered to be intimately related to the climate, soil, and further aspects of the physical environment, as reflected in the concept of terroir (Imre et al., 2012). Lee et al. (2007) reported that Cabernet Sauvignon had the highest concentration of β-damascenone in non-defoliated grapes and subsequent wines
compared to grapes from vines which were defoliated at fruit set by either lateral or primary leaf removal or individually. Research conducted by Ristic et al. (2007) established that bunch shading of Shiraz grapes decreased the levels of norisoprenoids in the wine and suggest that other compounds may have changed, which influenced wine aroma and flavor. The variation between C13 norisoprenoid synthesis in Shiraz (Ristic et al., 2007) and Cabernet Sauvignon (Lee et al., 2007) may be due to microclimate, mesoclimate, canopy architecture, training system, light, temperature, and varietal differences. Keller (2010) states that the influence of temperature on most grape aroma and flavor compounds are not presently very well understood.
The northern piedmonts of Tianshan mountains in Xinjiang is one of the important wine-producing regions of China for its great day-night temperature difference, intense sunlight, dry and rainless climate. The hot climate during the stage of maturation and intense sun exposure in this region results in wines with high alcohol content, poor colour stability, and lack of fruit note and elegance in aroma. Fan-shaped training system making vines retain more than two trunks has been widely used in Xinjiang, where trunks need to be pulled down and covered with soil in the winter. The fruiting zones of vines trained to Fan-shaped systems were distributed from the top to the bottom of the canopy. The clusters located in different positions (east or west, shade or exposure) of the canopy showed different temperature and sunlight exposure conditions in some previous studies (Spayd et al., 2002; Tarara et al., 2008). However, little
Comparison between aroma compounds in wines from four
Vitis vinifera
grape varieties grown in different shoot positions
Guo CHENG1, Ye LIU1, Tai-Xin YUE1, Zhen-Wen ZHANG1*
a
Received 21 Jul., 2014 Accepted 20 Oct., 2014
1College of Enology, Northwest A&F University, Yangling, Shaanxi, China *Corresponding author: [email protected]
Abstract
The aroma characteristics of wines from four Vitis vinifera grape varieties (‘Cabernet sauvignon’, ‘Merlot’, ‘Chardonnay’, and ‘Italian Riesling’) grown in three shoot positions were evaluated by HS-SPME-GC/MS. In this study, the numerous significant differences found in most of the aromatic compounds influence of different shoot positions on the quality of wine. The results showed that the middle shoot position increased significantly the aroma concentration in the majority of wines investigated. The volatile components showing the greatest differences in the wines of different cultivars were aldehydes and terpenes. 8 and 11 compounds were found and quantified (DAVs>1) in the two red wines and white wines at concentrations higher than their corresponding odor thresholds, respectively; and therefore they significantly contributed to the wine aromas. According to their DAVs, fruity, floral, cheese and fatty aroma strongly influenced the characteristics of the four monovarietal wines, while the two white wines showed the green and fresh aroma characteristics. These results are related to the different microclimate of the canopies of the different shoot positions and varieties. They suggest that proper elevating the fruiting zones could improve the accumulation of aroma compounds in wines from the different varieties. Dn the other hand, grapevines trained to systems with uniform fruiting zones could improve the quality of wine.
Aroma compounds in wines from different bearing positions
Food Sci. Technol, Campinas, 35(2): 237-246, Abr.-Jun. 2015 238
experimental work about the influence of shoot positions on the aroma compounds in wines has been done. In the present study, the canopies of grapevines trained to Fan-shaped systems were artificially divided into three different shoot positions: upper, middle and lower. The purpose was to compare the aroma composition and concentration in wines made from different cultivars grown in three different shoot positions and to provide theoretical support to proper elevating the fruiting zones to improve wine quality.
2 Materials and methods
2.1 Microclimate evaluation
The experimental field was located in a temperate continental arid and semi-arid climate zone with climatic features of cold winter, hot summer, abundant sunshine and dry and rainless periods. The annual average temperature was 7.2°C. Extremely maximum temperature was 39.6°C, and extremely minimum temperature to –37.4°C. Annual frost-free period was 165-172 days, and average annual rainfall was 173.3 mm. Several microclimatic parameters (including average air temperature, relative humidity, and light intensity) in the canopies of ‘Cabernet sauvignon’, ‘Merlot’, ‘Chardonnay’ and ‘Italian Riesling’ grapes grown in different shoot positions on 25/07/2011, 16/08/2011, and 8/09/2011 were respectively recorded. The light intensity in each shoot position was measured using a digital lux meter (Smart Sensor, AR823).
2.2 Chemicals
All standards for aroma analysis were purchased from Fluka (Buchs, Switzerland) and Aldrich (Milwaukee, WI, USA). Purity of all standards was above 99%. 4-Methyl-2-pentanol was used as the internal standard. Model solutions were prepared using the methods reported by Howard et al. (2005). For quantification, 8-point calibration curves for each compound were prepared using the method described by Ferreira et al. (2000), which was also used as a reference to determine the concentration range of standard solutions.
2.3 Sample collection and vinification
The field experiments were performed in the Manas County (belonging to Shihezi City), the wine-producing region of Xinjiang, China. The vineyard is located at 44°17’55” North, 86°12’2” East and at an altitude of 475 m (Cheng et al., 2014). The vines were planted in 2000, furrow irrigated, and grown on their own roots in a north–south row orientation. Soils in the treatment blocks were relatively uniform, typified by silt loam, and pH 8.0. In 2011, 45 vines of ‘Cabernet sauvignon’, ‘Merlot’, ‘Chardonnay’ and ‘Italian Riesling’ in this vineyard were selected on the basis of uniformity of shoot growth and cluster development. All vines were trained to Fan-shaped systems, spaced at 2.5 m × 1.0 m, and the treatments were applied to four grape varieties according to their inherent fruit position. Three levels of shoot positions are shown in Table 1. All samples were harvested at technological ripeness, and the harvest dates of each cultivar were determined by the cooperating winery.
Grapes were crushed on an experimental destemmer– crusher and then transferred to stainless steel containers. The clear juices of two white grape varieties were prepared before fermentation. A total volume of 20 L of each treatment wine was produced in three replicates, and 40-60 mg/L of SD2 were added to the musts; the specific amounts depended on the acidity and the health status of the grapes. After maceration of the musts for 24 h, 200 mg/L of dried active yeast (Lalvin D254, France) were added to the musts, according to commercial specifications. Alcoholic fermentation was carried out at 25 °C (for red wines) and 20 °C (for white wines) to dryness (reducing sugar < 4 g/L), which took place over a 6-8 day period, and density controls were maintained during this period. At the end of alcoholic fermentation, the wines were separated from the pomace, and 60 mg/L of SD2 were added. After fermentation, the wine samples were bottled and stored at 10-15 °C prior to analysis. All samples were five months old at the time of analysis. Residual sugar, total acidity, total tannins, and ethanol were analyzed (Dffice International de la Vigne et du Vin, 1990).
2.4 Headspace solid phase microextraction (HS-SPME) procedure
The aroma compounds of all wine samples were extracted by HS-SPME and analyzed using gas chromatography/mass spectrometry, as described by Zhang et al. (2007). Five milliliters of the wine sample and 1 g NaCl were placed in a 15 ml sample vial. The vial was tightly capped with a PTFE-silicon septum and heated at 40°C for 30 min on a heating platform agitation at 400 rpm. The SPME (50/30-μm DVB/Carboxen/PDMS, Supelco, Bellefonte, PA, USA), preconditioned according to manufacturer’s instruction, was then inserted into the headspace, where extraction was allowed to occur for 30 min with continued heating and agitation by a magnetic stirrer. The fiber was subsequently desorbed in the GC injector for 25 min.
2.5 GC–MS analysis
The GC–MS system used was an Agilent 6890 GC equipped with an Agilent 5975 mass spectrometer. The column used was a 60 m×0.25 mm HP-INNDWAX capillary with 0.25 μm film Table 1. Treatments of different shoot positions for four grape varieties.
Varieties Treatment Distance from ground level (cm)
Cabernet Sauvignon Lower 40
Middle 70
Upper 100
Merlot Lower 40
Middle 80
Upper 120
Chardonnay Lower 40
Middle 70
Upper 100
Italian Riesling Lower 40
Middle 70
Cheng et al.
Food Sci. Technol, Campinas, 35(2): 237-246, Abr.-Jun. 2015 239
thickness (J &W Scientific, Folsom, CA, USA). The carrier gas used was helium, at a flow rate of 1 ml/min. Samples were injected by introducing the SPME fiber into the GC inlet for 25 min in the splitless mode. The oven starting temperature was 50 °C, which was held for 1 min, then raised to 220 °C at a rate of 3 °C/min, and held at 220 °C for 5 min. The mass spectrometry in the electron impact mode (MS/EI) at 70 eV was recorded in the range m/z 20 to 450 U. It was operated in the selective ion mode under auto tune conditions, and the area of each peak was determined by ChemStation software (Agilent Technologies). Analyses were carried out in triplicate.
2.6 Odor activity values (OAVs)
The contribution of each volatile compound to wine aroma was evaluated qualitatively by its associated descriptor and quantitatively by its DAVs. DAVs were calculated using the equation DAV=c/t, where c is the total concentration (in μg/L) of each compound in the wine samples, and t is the odor threshold value (in μg/L) of the compound in water/ethanol solution (Hellín et al., 2010); threshold values were obtained from information available in the literature (references are shown in Table 2).
2.7 Statistical analysis
The mean values were obtained from at least 3 repetitions. Dne-way ANDVA and Tukey’s Range Test were used to evaluate the differences between the three shoot positions for each grape variety. Principal component analyses (PCA) was used to determine the best description and discrimination of the aroma profile between the three shoot positions and four varieties. Statistical analysis was performed using the SPSS (SPSS Inc., Chicago, IL) for Windows, version 20.0.
3 Results and discussion
3.1 The microclimate of canopies and wine composition of four grape varieties grown in different shoot positions
Table 3 shows the microclimatic parameters of the canopies of four grape varieties in the three shoot positions evaluated in the present study. It has been confirmed that the upper shoot position increased the air temperature and light intensity, but decreased relative humidity. Since one layer of V. vinifera leaves will absorb 80 to 90% of incident solar radiation (Smart, 1985), this natural shading was expected to allow only low levels of light intensity to strike clusters in lower positions. Moreover, some previous studies suggest that berry temperature is elevated as a result of increased sunlight exposure (Millar, 1972; Bergqvist al., 2001). Therefore, the previous studies mentioned above were conducted to understand the different microclimates between three shoot positions. Table 3 shows that the alcohol and total tannins in the wines made from the grapes grown in the middle and lower shoot positions decreased significantly compared to those that were grown in the upper shoot position. Dn the other hand, ttitratable acidity was high in the wines made from the grapes grown in the middle and lower positions, and there were no statistically significant differences in residual sugar between the three shoot positions for each variety.
3.2 The aroma profile of wines made from four grape cultivars grown in different shoot positions
The volatile compounds identified in four monovarietal wines are shown in Table 2. A total of 43 compounds were identified and quantified in all wine samples, including 16 alcohols, 12 esters, 5 fatty acids, 7 aldehydes, 2 terpenes, and 1 phenol compound. Many of these volatile compounds are commonly found in wines and are derived from grapes and yeast strain during the fermentation and the vinification process (Cliff et al., 2002).
Considering the number and concentration of volatile compounds identified in the wines made from four varieties grown in different shoot positions, the major volatiles found were alcohols, esters, and acids. Aldehydes, terpenes, and volatile phenols were identified as minor compounds. In the present study, according to the quantitative data, the concentrations of the total volatile compounds in the wines made from grapes grown in three positions varied with the range from 129.0 to 247.0 mg/L in ‘Cabernet Sauvignon’ wines, from 175.1 to 302.1 mg/L in ‘Merlot’ wines, from 156.0 to 319.6 mg/L in ‘Chardonnay’ wines, and from 167.1 to 342.1 mg/L in ‘Italian Riesling’ wines. The wines made from four varieties of grapes grown in the middle position had the highest aroma intensity, while those from the lower shoot position had the lowest.
A
ro
m
a co
m
p
o
un
d
s in w
in
es f
ro
m dif
fer
en
t b
ea
rin
g p
osi
tio
n
s
F
o
o
d S
ci
. T
ec
hn
o
l, C
am
p
in
as, 35(2): 237-246, A
b
r.-J
un. 2015
240
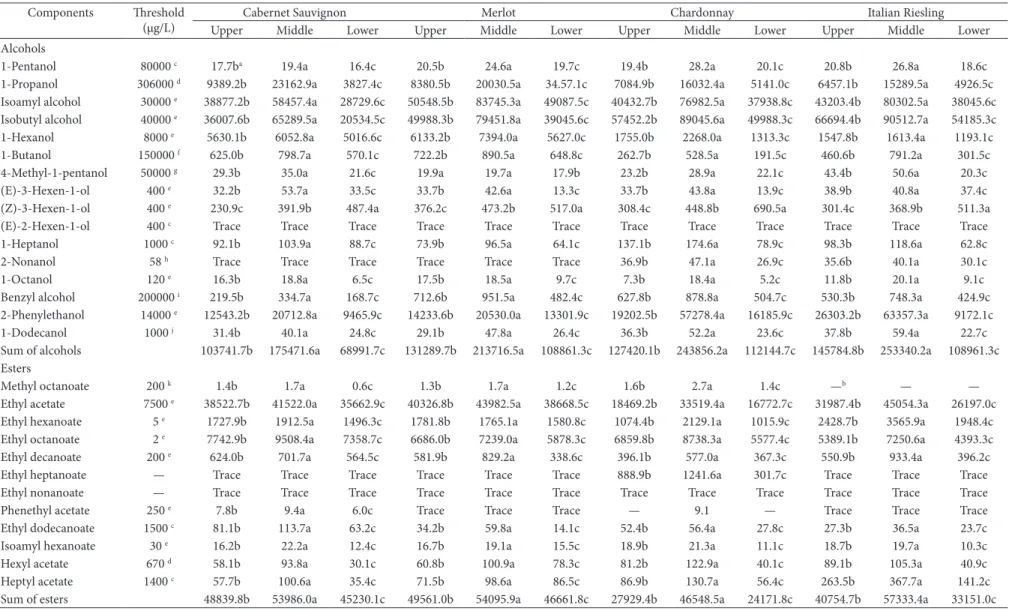
Table 2. Concentrations of aroma components (μg/L) in wines of four varieties grown in three shoot positions.
Components Threshold (μg/L)
Cabernet Sauvignon Merlot Chardonnay Italian Riesling
Upper Middle Lower Upper Middle Lower Upper Middle Lower Upper Middle Lower Alcohols
1-Pentanol 80000 c 17.7ba 19.4a 16.4c 20.5b 24.6a 19.7c 19.4b 28.2a 20.1c 20.8b 26.8a 18.6c
1-Propanol 306000 d 9389.2b 23162.9a 3827.4c 8380.5b 20030.5a 34.57.1c 7084.9b 16032.4a 5141.0c 6457.1b 15289.5a 4926.5c
Isoamyl alcohol 30000 e 38877.2b 58457.4a 28729.6c 50548.5b 83745.3a 49087.5c 40432.7b 76982.5a 37938.8c 43203.4b 80302.5a 38045.6c
Isobutyl alcohol 40000 e 36007.6b 65289.5a 20534.5c 49988.3b 79451.8a 39045.6c 57452.2b 89045.6a 49988.3c 66694.4b 90512.7a 54185.3c
1-Hexanol 8000 e 5630.1b 6052.8a 5016.6c 6133.2b 7394.0a 5627.0c 1755.0b 2268.0a 1313.3c 1547.8b 1613.4a 1193.1c
1-Butanol 150000 f 625.0b 798.7a 570.1c 722.2b 890.5a 648.8c 262.7b 528.5a 191.5c 460.6b 791.2a 301.5c
4-Methyl-1-pentanol 50000 g 29.3b 35.0a 21.6c 19.9a 19.7a 17.9b 23.2b 28.9a 22.1c 43.4b 50.6a 20.3c
(E)-3-Hexen-1-ol 400 e 32.2b 53.7a 33.5c 33.7b 42.6a 13.3c 33.7b 43.8a 13.9c 38.9b 40.8a 37.4c
(Z)-3-Hexen-1-ol 400 e 230.9c 391.9b 487.4a 376.2c 473.2b 517.0a 308.4c 448.8b 690.5a 301.4c 368.9b 511.3a
(E)-2-Hexen-1-ol 400 c Trace Trace Trace Trace Trace Trace Trace Trace Trace Trace Trace Trace
1-Heptanol 1000 c 92.1b 103.9a 88.7c 73.9b 96.5a 64.1c 137.1b 174.6a 78.9c 98.3b 118.6a 62.8c
2-Nonanol 58 h Trace Trace Trace Trace Trace Trace 36.9b 47.1a 26.9c 35.6b 40.1a 30.1c
1-Dctanol 120 e 16.3b 18.8a 6.5c 17.5b 18.5a 9.7c 7.3b 18.4a 5.2c 11.8b 20.1a 9.1c
Benzyl alcohol 200000 i 219.5b 334.7a 168.7c 712.6b 951.5a 482.4c 627.8b 878.8a 504.7c 530.3b 748.3a 424.9c
2-Phenylethanol 14000 e 12543.2b 20712.8a 9465.9c 14233.6b 20530.0a 13301.9c 19202.5b 57278.4a 16185.9c 26303.2b 63357.3a 9172.1c
1-Dodecanol 1000 j 31.4b 40.1a 24.8c 29.1b 47.8a 26.4c 36.3b 52.2a 23.6c 37.8b 59.4a 22.7c
Sum of alcohols 103741.7b 175471.6a 68991.7c 131289.7b 213716.5a 108861.3c 127420.1b 243856.2a 112144.7c 145784.8b 253340.2a 108961.3c Esters
Methyl octanoate 200 k 1.4b 1.7a 0.6c 1.3b 1.7a 1.2c 1.6b 2.7a 1.4c —b — —
Ethyl acetate 7500 e 38522.7b 41522.0a 35662.9c 40326.8b 43982.5a 38668.5c 18469.2b 33519.4a 16772.7c 31987.4b 45054.3a 26197.0c
Ethyl hexanoate 5 e 1727.9b 1912.5a 1496.3c 1781.8b 1765.1a 1580.8c 1074.4b 2129.1a 1015.9c 2428.7b 3565.9a 1948.4c
Ethyl octanoate 2 e 7742.9b 9508.4a 7358.7c 6686.0b 7239.0a 5878.3c 6859.8b 8738.3a 5577.4c 5389.1b 7250.6a 4393.3c
Ethyl decanoate 200 e 624.0b 701.7a 564.5c 581.9b 829.2a 338.6c 396.1b 577.0a 367.3c 550.9b 933.4a 396.2c
Ethyl heptanoate — Trace Trace Trace Trace Trace Trace 888.9b 1241.6a 301.7c Trace Trace Trace Ethyl nonanoate — Trace Trace Trace Trace Trace Trace Trace Trace Trace Trace Trace Trace Phenethyl acetate 250 e 7.8b 9.4a 6.0c Trace Trace Trace — 9.1 — Trace Trace Trace
Ethyl dodecanoate 1500 c 81.1b 113.7a 63.2c 34.2b 59.8a 14.1c 52.4b 56.4a 27.8c 27.3b 36.5a 23.7c
Isoamyl hexanoate 30 e 16.2b 22.2a 12.4c 16.7b 19.1a 15.5c 18.9b 21.3a 11.1c 18.7b 19.7a 10.3c
Hexyl acetate 670 d 58.1b 93.8a 30.1c 60.8b 100.9a 78.3c 81.2b 122.9a 40.1c 89.1b 105.3a 40.9c
Heptyl acetate 1400 c 57.7b 100.6a 35.4c 71.5b 98.6a 86.5c 86.9b 130.7a 56.4c 263.5b 367.7a 141.2c
Sum of esters 48839.8b 53986.0a 45230.1c 49561.0b 54095.9a 46661.8c 27929.4b 46548.5a 24171.8c 40754.7b 57333.4a 33151.0c
C
h
en
g
et
al
.
F
o
o
d S
ci
. T
ec
hn
o
l, C
am
p
in
as, 35(2): 237-246, A
b
r.-J
un. 2015
241
Components Threshold (μg/L)
Cabernet Sauvignon Merlot Chardonnay Italian Riesling
Upper Middle Lower Upper Middle Lower Upper Middle Lower Upper Middle Lower Acids
Acetic acid 200000 e 13061.6b 16193.2a 14116.8c 24214.4b 33044.8a 18844.8c 20306.2b 28050.2a 18844.8c 27230.5b 30436.9a 24351.4c
Hexanoic acid 3000 e 174.4b 232.3a 128.9c 184.4b 264.6a 146.3c 413.4b 524.4a 260.9c 407.9b 534.9a 354.9c
Dctanoic acid 500 e 232.4b 351.2a 163.1c 343.9b 351.3a 269.5c 106.5b 137.9a 82.2c 123.4b 230.2a 93.0c
Decanoic acid 15000 e 217.5b 349.7a 151.6c 328.8b 340.0a 248.9c 150.2b 202.9a 123.6c 81.3b 92.4a 52.1c
Isobutyric acid 200000 e Trace 22.1 Trace Trace 18.2 Trace Trace Trace Trace Trace Trace Trace
Sum of acids 13685.9c 17148.5a 14560.4b 25071.5b 34018.9a 19509.5c 20976.3b 28915.4a 19311.5c 27843.1b 31294.4a 24851.4c Aldehydes
Hexanal 4.5 l — — — — — — 88.0c 118.6b 156.3a 40.7c 51.7b 90.5a
(E)-2-Hexenal 17.0 l — — — — — — 83.8c 115.9b 150.6a 11.7c 54.6b 68.2a
Nonanal 0.7 l Trace Trace Trace Trace Trace Trace 8.2c 8.2c 10.4a 7.2c 8.2a 8.5a
Decanal 1000 g 111.9b 181.3a 64.3c 188.7b 237.9a 94.3c 1.3a 1.4a 1.2a 1.1a 1.5a 1.3a
Benzealdehyde 2000 d Trace Trace Trace 1.5b 5.9a 1.8b Trace Trace Trace Trace Trace Trace
Benzeneacetaldehyde — Trace Trace Trace Trace Trace Trace 6.1c 10.0a 7.9b 7.3b 9.7a 6.9c
Furfural — 167.8b 219.8a 150.0c — — — — — — — — —
Sum of aldehydes 279.7b 401.1a 214.3c 190.2b 243.8a 96.1c 187.4c 254.1b 326.4a 68.0c 125.7b 175.4a Dthers
Limonene 200 h 13.0b 24.5a 11.9c — — — — — — — — —
Linalool 25.2 l — — — — Trace — — Trace — — Trace —
Phenol — Trace Trace Trace Trace Trace Trace Trace Trace Trace Trace Trace Trace Sum of others 13.0b 24.5a 11.9c Trace Trace Trace Trace Trace Trace Trace Trace Trace Total 166560.1b 247031.7a 129008.4c 206112.4b 302075.1a 175128.7c 176513.2b 319574.2a 155954.4c 214450.6b 342093.7a 167139.1c
Values are the means of three replicates. a Different letters in each row of the same cultivar are significantly different at the 0.05 level according to ANDVA by Duncan’s test. b‘—’represent not determined. c Li (2006). d Peinado et al. (2004). e Guth (1997). f Tominaga et al. (1998). g Moyano et al. (2009). h Du et al. (2010). i Gómez-Míguez et al. (2007). j Li et al. (2008). k Takeoka et al. (1989). l Wen et al. (2014).
Aroma compounds in wines from different bearing positions
Food Sci. Technol, Campinas, 35(2): 237-246, Abr.-Jun. 2015 242
of vines. Moreover, the improvement of wine aroma could be related to a proper height of fruiting zone.
In order to analyze the differences in the wines made from four varieties grown in three shoot positions, a comparison of the subtotal of each chemical group between the wines made from the grapes grown in different shoot positions was made. In this study, sixteen kinds of higher alcohols were identified in the four monovarietal wines. Alcohols were the major group in terms of number and concentration of aroma compounds identified in all wine samples, followed by esters and acids. The subtotal concentration of alcohols in ‘Cabernet Sauvignon’ wines was from 69.0 to 175.5 mg/L, from 108.9 to 213.7 mg/L in ‘Merlot’ wines, from 112.1 to 243.9 mg/L in ‘Chardonnay’ wines, and from 109.0 to 253.3 mg/L in ‘Italian Riesling’ wines. The four monovarietal wines made from the grapes grown in the middle shoot position had the highest content of alcohols except for (Z)-3-Hexen-1-ol, which was highest in wines made from the grapes grown in the lower shoot position (Table 2). This volatile fraction was mainly composed of isoamyl alcohol, isobutyl alcohol, 2-phenylethanol and 1-propanol in all wine samples, which could be the potential impact odorant in our study, contributing to the desirable complexity of wine aroma for their low concentration (<300 mg/l) (Swiegers & Pretorius, 2005).
Esters are the second major volatile constituents in wine and have long been regarded as especially important contributors to wine aroma because they are the primary source of fruity aromas (Sumby et al., 2010). Acetate esters are the result of the reaction of acetyl-CoA with higher alcohols that are formed from degradation of amino acids or carbohydrates (Perestrelo et al., 2006). The concentrations of acetate esters of higher alcohols in the wines made from four cultivars grown in all shoot positions were higher than the concentrations of ethyl esters. Ethyl acetate, phenethyl acetate, hexyl acetate and heptyl acetate were detected as the acetate esters. Acetate esters in wines are considered as factors contributing to the quality of young wines (Ferreira et al., 2000). Ethyl acetate was the most abundant compound among the esters analyzed, and its total concentrations were 35.7-41.5 mg/L in ‘Cabernet Sauvignon’
wines, 38.7-44.0 mg/L in ‘Merlot’ wines, 16.8-33.5 mg/L in ‘Chardonnay’ wines, and 26.2-45.1 mg/L in ‘Italian Riesling’ wines. In addition, the four monovarietal wines made from the grapes grown in different shoot positions showed significant differences in the concentrations of each ester. Dne of the most important groups of volatile compounds in wine is the ethyl esters of fatty acids. Their concentration depends on several main factors: yeast strain, fermentation temperature, aeration degree, and sugar content (Perestrelo et al., 2006). A total of 6 ethyl esters were identified in all wine samples, and the most abundant compounds were ethyl hexanoate and ethyl octanoate. Besides the acetate and ethyl esters, some other fatty acid esters of higher alcohols were also identified in a very low concentration, including methyl octanoate and isoamyl hexanoate.
Five fatty acids were identified in all wine samples. This group of volatile compounds is produced by yeast and bacteria during fatty acid metabolism (Swiegers & Pretorius, 2005). Acetic acid was the most abundant fatty acid; it is produced during alcoholic and malolactic fermentation. Volatile fatty acids can contribute to the complexity of the wine bouquet even if present at sub-sensory threshold levels, and they have negative effect on wine aroma when above their thresholds (Swiegers & Pretorius, 2005). Acids, such as isobutyric acid and decanoic acid are not associated with wine quality, but they play an important role in the complexity of the aroma (Shinohara, 1985). In the present study, there were significant differences in the fatty acid content of between the wines made from grapes grown in the three different shoot positions. Furthermore, the concentrations of all kinds of acids detected in the four monovarietal wines made from the grapes grown in the middle position were higher than those of the wines made from grapes grown in the other two positions.
The compositions and concentrations of aldehydes and other kinds of aroma components in the wines varied between the different wine varieties evaluated. Hexanal and (E)-2-hexenal were found only in the wine samples of two white varieties. Moreover, the concentrations of hexanal, (E)-2-hexenal and nonanal were the highest in the white wines made Table 3. Microclimatic parameters of the canopies during grape maturation and general composition of wines from four varieties grown in three shoot positionsa. Tair: air temperature (°C); RH: relative humidity (%); Li: light intensity (×105 lx). Titratable acidity was expressed as grams of
tartaric acid equivalents per liter basis (g/L). Total tannins was expressed as milligrams of tannin acid equivalents per liter basis (g/L).
Cabernet Sauvignon Merlot Chardonnay Italian Riesling
Upper Middle Lower Upper Middle Lower Upper Middle Lower Upper Middle Lower
Tair 35.0ab 30.5b 27.0c 35.8a 31.8b 28.2c 32.9a 29.8b 26.5c 34.7a 30.2b 27.8c
RH 32.5c 37.6b 40.1a 30.2c 35.5b 38.8a 36.7c 40.5b 44.6a 36.5c 40.8b 43.7a
Li 0.66a 0.47b 0.21c 0.87a 0.55b 0.28c 0.59a 0.37b 0.19c 0.64a 0.40b 0.25c
Residual sugar (g/L) 2.4a 2.3a 2.5a 2.8a 2.7a 2.7a 1.4a 1.6a 1.6a 1.6a 1.8a 1.8a Titratable acidity (g/L) 6.5c 6.6b 6.8a 6.2c 6.4b 6.7a 6.2c 7.7b 7.9a 6.1c 6.6b 7.1a Alcohol (%) 13.5a 12.3c 13.0b 14.0a 14.3a 13.7b 12.7a 12.8a 12.2b 15.1a 13.7b 13.1b Total tannins (g/L) 629.7a 438.8b 313.3c 753.5a 652.3b 282.5c 13.4a 12.6b 12.3c 20.4a 19.7a 15.4c
aValues are the means of at least three replicates of analysis of the microclimatic parameters and general composition of wines. bDifferent letters in each row of the same cultivar are
Cheng et al.
Food Sci. Technol, Campinas, 35(2): 237-246, Abr.-Jun. 2015 243
monovarietal wines, the DAVs of most aroma compounds in the wines made from the grapes grown in the middle position were higher than those from the other two positions. However, the DAVs of 1-hexanol, hexanal, (E)-2-hexenal, and nonanal in wines made from the grapes grown in the lower position were higher than those from the other two positions.
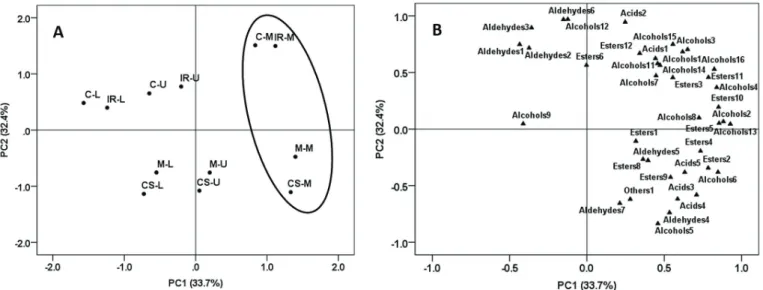
3.4 Principal component analysis (PCA) of the wine samples of four grape varieties grown at different shoot positions
Principal component analysis (PCA) of the wines made from four grape varieties grown in different shoot positions was conducted using the variables including the concentrations of each aroma compounds, which were significantly different between the three shoot positions and four varieties according to ANDVA (P < 0.05). As shown in Figure 1, the first and second principal components explained together 66.1% of the total variance. PC1 explained 33.7% of total variance and was characterized by the wines made from four grape varieties grown in the middle shoot position on the positive side (Figure 1A). Although, the wines made from two red grape varieties grown in the upper shoot position were also located on the positive side, PC1 separated all samples of the middle shoot position from the other two shoot positions Furthermore, the results were explained by most alcohols, esters and acids, which had bands of positive loading (Figure 1B). In addition, PC2 explained 32.4% of total variance, which separated all wines of two red grape varieties from those of two white varieties. The results indicate great differences in the concentrations of the aroma compounds in the wines made from the grapes grown in different varieties and shoot positions; the wines made from the grapes grown in the middle shoot position were richer in most aroma compounds when compared to those in the upper and lower shoot positions for each variety.
from the grapes grown in the lower shoot position. However, furfural and limonene were identified only in the ‘Cabernet Sauvignon’ wines. Terpene compounds belong to the secondary plant constituents, in which biosynthesis begins with acetyl-CoA. Two compounds were detected in the studied wines, including the limonene and linalool. Linalool was detected only in the wines made from the grapes grown in the middle position for ‘Merlot’, ‘Chardonnay’ and ‘Italian Riesling’, and the concentrations of this compound were very low. In this study, phenol was present only in trace amounts.
3.3 Odor activity values (OAVs)
Although dozens of volatiles were detected in each wine sample, not all components had a great impact on the overall aroma character of these wines. To evaluate the contribution of various volatile compounds to the olfactory impression of wines, DAVs were calculated from the averages of analytical concentrations and published odor thresholds. Generally, only the compounds with DAVs higher than 1 were considered to contribute to wine aroma, (Table 4). Table 4 indicates that 8 and 11 quantified compounds (DAVs>1) can be found in the two red wines and white wines at concentrations higher than their corresponding odor thresholds, respectively, and thereby they probably contribute to the wine aromas. Ethyl octanoate and ethyl hexanoate are the major compounds in the four monovarietal wines due to their high values of DAVs. Both of them are byproducts of yeast metabolism. They were responsible for the ‘fruity’, ‘floral’ and ‘anise’ sensory properties of young wine. C6 alcohols usually supply ‘vegetal’ and ‘herbaceous’ nuances to wines causing negative effect on wine aroma (Ferreira et al., 2000). Four C6 alcohols were identified in this study, and only 1-hexanol was above the threshold (Table 4). Among the aldehydes, hexanal, (E)-2-hexenal, and nonanal compounds were those with concentrations reaching their threshold in two white wines (Table 4). For the four
A
ro
m
a co
m
p
o
un
d
s in w
in
es f
ro
m dif
fer
en
t b
ea
rin
g p
osi
tio
n
s
F
o
o
d S
ci
. T
ec
hn
o
l, C
am
p
in
as, 35(2): 237-246, A
b
r.-J
un. 2015
244
Table 4. DAVs of the aroma compounds of wines made from four varieties of grapes grown in three shoot positions.
Compounds Ddor threshold (μg/L) Ddor description Cabernet Sauvignon Merlot Chardonnay Italian Riesling Upper Middle Lower Upper Middle Lower Upper Middle Lower Upper Middle Lower Isobutyl alcohol 40000 Fresh, banana 0.9 1.6 0.5 1.3 2.0 1.0 1.4 2.2 1.3 1.7 2.3 1.3
Isoamyl alcohol 30000 Cheese 1.3 1.9 1.0 1.7 2.8 1.6 1.3 2.6 1.3 1.4 2.7 1.3
(Z)-3-Hexen-1-ol 400 Green 0.6 1.0 1.2 0.9 1.2 1.3 0.8 1.1 1.7 0.8 0.9 1.3
2-Phenylethanol 14000 Flowery, pollen, perfume 0.9 1.5 0.7 1.0 1.5 1.0 1.4 4.1 1.2 1.9 4.5 0.7 Ethyl acetate 7500 Fruity, sweet 5.1 5.5 4.8 5.4 5.9 5.2 2.5 4.5 2.2 4.3 6.0 3.5 Ethyl hexanoate 5 Fruity, strawberry, anise 345.6 382.5 299.3 356.4 353.0 316.2 214.9 425.8 203.2 485.7 713.2 389.7 Ethyl octanoate 2 Pineapple, pear, floral 3871.5 4754.2 3679.4 3343.0 3619.5 2939.2 3429.9 4369.2 2788.7 2694.6 3625.3 2196.7 Ethyl decanoate 200 Fruity, fatty, pleasant 3.1 3.5 2.8 2.9 4.2 1.7 2.0 2.9 1.8 2.8 4.7 2.0
Hexanal 4.5 Grassy, green — a — — — — — 19.6 26.4 34.7 9.0 11.5 20.1
(E)-2-Hexenal 17 Green, fresh, fruity — — — — — — 4.9 6.8 8.9 0.7 3.2 4.0
Nonanal 0.7 Citrusy, green — — — — — — 11.7 11.7 14.9 10.3 11.7 12.1
Cheng et al.
Food Sci. Technol, Campinas, 35(2): 237-246, Abr.-Jun. 2015 245
Falqué, E., Fernández, E., & Dubourdieu, D. (2001). Differentiation of white wines by their aromatic index. Talanta, 54(2), 271-281. http://dx.doi.org/10.1016/S0039-9140(00)00641-X. PMid:18968249 Ferreira, V., Fernández, P., Peña, C., Escudero, A., & Cacho, J. (1995).
Investigation on the role played by fermentation esters in the aroma of young Spanish wines by multivariate analysis. Journal of
the Science of Food and Agriculture, 67(3), 381-392. http://dx.doi.
org/10.1002/jsfa.2740670316.
Ferreira, V., López, R., & Cacho, J. F. (2000). Quantitative determination of the odorants of young red wines from different grape varieties.
Journal of the Science of Food and Agriculture, 80(11), 1659-1667.
http://dx.doi.org/10.1002/1097-0010(20000901)80:11<1659::AID-JSFA693>3.0.CD;2-6.
Gómez-Míguez, M. J., Cacho, J. F., Ferreira, V., Vicario, I. M., & Heredia, F. J. (2007). Volatile components of Zalema white wines.
Food Chemistry, 100(4), 1464-1473. http://dx.doi.org/10.1016/j.
foodchem.2005.11.045.
Guth, H. (1997). H. Identification of character impact odorants of different white wine varieties. Journal of Agricultural and Food
Chemistry, 45(8), 3022-3026. http://dx.doi.org/10.1021/jf9608433.
Hellín, P., Manso, A., Flores, P., & Fenoll, J. (2010). Evolution of aroma and phenolic compounds during ripening of ‘superior seedless’ grapes. Journal of Agricultural and Food Chemistry, 58(10), 6334-6340. http://dx.doi.org/10.1021/jf100448k. PMid:20438135 Howard, K. L., Mike, J. H., & Riesen, R. (2005). Validation of a
solid-phase microextraction method for headspace analysis of wine aroma components. American Journal of Enology and Viticulture,
56(1), 37-45.
Imre, S. P., Kilmartin, P. A., Rutan, T., Mauk, J. L., & Nicolau, L. (2012). Influence of soil geochemistry on the chemical and aroma profiles of pinot noir wines. Journal of Food Agriculture and Environment,
10(2), 280-288.
Keller, M. (2010). Managing grapevines to optimise fruit development in a challenging environment: a climate change primer for viticulturists.
Australian Journal of Grape and Wine Research, 16(Suppl. 1), 56-69.
http://dx.doi.org/10.1111/j.1755-0238.2009.00077.x.
Lee, S., Seo, M., Riu, M., Cotta, J., Block, D., Dokoozilian, N., & Ebeler, S. (2007). Vine microclimate and norisoprenoid concentration in Cabernet Sauvignon grapes and wine. American Journal of Enology
and Viticulture, 58(3), 291-301.
Li, H. (2006). Wine tasting. Beijing: China Science Press.
Li, H., Tao, Y. S., Kang, W. H., & Yin, C. L. (2006). Wine aroma analytical investigation progress on GC [review]. Food Science and
Biotechnology, 25, 99-104.
Li, H., Tao, Y. S., Wang, H., & Zhang, L. (2008). Impact odorants of Chardonnay dry white wine from Changli County (China).
European Food Research and Technology, 227(1), 287-292. http://
dx.doi.org/10.1007/s00217-007-0722-9.
Marais, J., Hunter, J. J., & Haasbroek, P. D. (1999). Effect of fruit zone leaf thinning on total glycosides and selected aglycone concentrations of Riesling (Vitis vinifera L.) grapes. South African Journal for Enology
& Viticulture, 20, 19-30.
Millar, A. A. (1972). Thermal regime of grapevine. American Journal
of Enology and Viticulture, 23, 173-176.
Moyano, L., Zea, L., Villafuerte, L., & Medina, M. (2009). Comparison of odor-active compounds in sherry wines processed from ecologically and conventionally grown Pedro Ximenez grapes.
Journal of Agricultural and Food Chemistry, 57(3), 968-973. http://
dx.doi.org/10.1021/jf802252u. PMid:19146368 4 Conclusions
The aroma profiles of the wines from the varieties ‘Cabernet Sauvignon’, ‘Merlot’, ‘Chardonnay’ and ‘Italian Riesling’ from three shoot positions were investigated and compared. The results showed that the middle shoot position increased significantly the concentrations of aroma compounds in the wines. However, lowering the shoot positions reduced the aroma compounds in the four monovarietal wines. The volatile components that had the greatest differences in the wines made from different cultivars were aldehydes and terpenes. Eight and eleven volatile compounds were considered to be the most powerful odorants in the red and white wines, with DAVs higher than 1. According to their DAVs, fruity, floral, cheese and fatty aroma strongly influenced the characteristics of the four monovarietal wines, while the two white wines showed green and fresh aroma characteristics. These results are related to the different microclimate of the canopies of the three shoot positions and different cultivars. They suggest that proper elevating the fruiting zones can improve the accumulation of aroma compounds in wines made from different cultivars. Dn the other hand, grapevines trained to systems with uniform fruiting zones can improve the quality of wine.
Acknowledgements
This work was funded by a grant from the China Technology System for Grape Industry (CARS-30). The authors would like to thank the Center for Viticulture and Enology, China Agricultural University for technical assistance in the completion of the HPLC experiments. We also thank Citic Guoan Wine Co., Itd for their technical support in 2011.
References
Bergqvist, J., Dokoozlian, N., & Ebisuda, N. (2001). Sunlight exposure and temperature effects on berry growth and composition of Cabernet Sauvignon and Grenache in the central San Joaquin valley of California. American Journal of Enology and Viticulture,
52(1), 1-7.
Cheng, G., He, Y. N., Yue, T. X., Wang, J., & Zhang, Z. W. (2014). Effects of climatic conditions and soil properties on Cabernet Sauvignon berry growth and anthocyanin profiles. Molecules
(Basel, Switzerland), 19(9), 13683-13703. http://dx.doi.org/10.3390/
molecules190913683. PMid:25185071
Cliff, M., Yuksel, D., Girard, B., & King, M. (2002). Characterization of Canadian ice wines by sensory and compositional analysis.
American Journal of Enology and Viticulture, 53(1), 46-53.
Conde, C., Silva, P., Fontes, N., Dias, A. C. P., Tavares, R. M., Sousa, M. J., Agasse, A., Delrot, S., & Gerós, H. (2007). Biochemical changes throughout grape berry development and fruit and wine quality.
Global Science Books, 1(1), 1-22.
Corino, L., & Stefano, D. R. (1988). Response of white Muscat grapes in relation to various growing environments and evaluation of systems for training and pruning. Rivista di Viticoltura e di Enologia,
41, 72-85.
Aroma compounds in wines from different bearing positions
Food Sci. Technol, Campinas, 35(2): 237-246, Abr.-Jun. 2015 246
of Vitis vinifera cv. Merlot berries. American Journal of Enology and
Viticulture, 53(3), 171-182.
Sumby, K. M., Grbin, P. R., & Jiranek, V. (2010). Microbial modulation of aromatic esters in wine: Current knowledge and future prospects.
Food Chemistry, 121(1), 1-16. http://dx.doi.org/10.1016/j.
foodchem.2009.12.004.
Swiegers, J. H., & Pretorius, I. S. (2005). Yeast modulation of wine flavor. Advances in Applied Microbiology, 57, 131-175. http://dx.doi. org/10.1016/S0065-2164(05)57005-9. PMid:16002012
Takeoka, G., Buttery, R. G., Flath, R., Teranishi, R., Wheeler, E. L., & Wieczorek, R. L. (1989). Flavor chemistry: trends and development
(ACS Symposium Series, 388). Washington: ACS Publishing House. Tarara, J. M., Lee, J., Spayd, S. E., & Scagel, C. F. (2008). Berry
Temperature and Solar Radiation Alter Acylation, Proportion, and Concentration of Anthocyaninin Merlot Grapes. American Journal
of Enology and Viticulture, 59(3), 235-247.
Tominaga, T., Murat, M. L., & Dubourdieu, D. (1998). Development of amethod for analyzing the volatile thiols involved in the characteristic aroma of wines made from Vitis vinifera L. cv Sauvignon Blanc. Journal of Agricultural and Food Chemistry, 46(3), 1044-1048. http://dx.doi.org/10.1021/jf970782o.
Vilanova, M., Zamuz, S., Vilariño, F., & Sieiro, C. (2007). Effect of terroir on the volatiles of Vitis vinifera cv. Albariño. Journal of the
Science of Food and Agriculture, 87(7), 1252-1256. http://dx.doi.
org/10.1002/jsfa.2833.
Voorpostel, C. R., Dutra, M. B. D. L., & Bolini, H. M. A. (2014). Sensory profile and drivers of liking for grape nectar among smoker and nonsmoker consumers. Food Science and Technology
(Campinas.), 34(1), 164-173.
http://dx.doi.org/10.1590/S0101-20612014000100024.
Wen, Y. Q., He, F., Zhu, B. Q., Lan, Y. B., Pan, Q. H., Li, C. Y., Reeves, M. J., & Wang, J. (2014). Free and glycosidically bound aroma compounds in cherry (Prunus avium L.). Food Chemistry,
152, 29-36. http://dx.doi.org/10.1016/j.foodchem.2013.11.092. PMid:24444903
Zhang, M., Xu, Q., Duan, C., Qu, W., & Wu, Y. (2007). Comparative study of aromatic compounds in young red wines from cabernet sauvignon, cabernet franc, and cabernet gernischet varieties in China. Journal of Food Science, 72(5), C248-C252. http://dx.doi. org/10.1111/j.1750-3841.2007.00357.x. PMid:17995710
Dffice International de la Vigne et du Vin. (1990). Recueil des méthods
internationales d’analyse des vins et des moûts. Paris: D.I.V.
Peinado, R. A., Moreno, J., Bueno, J. E., Moreno, J. A., & Mauricio, J. C. (2004). Comparative study of aromatic compounds in two young white wines subjected to pre-fermentative cryomaceration.
Food Chemistry, 84(4), 585-590.
http://dx.doi.org/10.1016/S0308-8146(03)00282-6.
Perestrelo, R., Fernandes, A., Albuquerque, F. F., Marques, J. C., & Camara, J. S. (2006). Analytical characterization of the aroma of Tinta Negra Mole red wine: Identification of the main odorants compounds. Analytica Chimica Acta, 563(1-2), 154-164. http:// dx.doi.org/10.1016/j.aca.2005.10.023.
Rapp, A. (1998). Volatile flavour of wine: correlation between instrumental analysis and sensory perception. Die Nahrung,
42(6), 351-363. http://dx.doi.org/10.1002/(SICI)1521-3803(199812)42:06<351::AID-FDDD351>3.3.CD;2-U.
PMid:9881361
Reynolds, A. G. (2010). Viticultural and vineyard management practices and their effects on grape and wine quality. In A. G. Reynolds (Ed.), Managing wine quality: viticulture and wine quality
(pp. 365-444). Sawston: Woodhead Publishing.. http://dx.doi.org/1 0.1533/9781845699284.3.365.
Ristic, R., Downey, M., Iland, P., Bindon, K., Francis, L., Herderich, M., & Robinson, S. (2007). Exclusion of sunlight from Shiraz grapes alters wine colour, tannin and sensory properties. Australian
Journal of Grape and Wine Research, 13(2), 53-65. http://dx.doi.
org/10.1111/j.1755-0238.2007.tb00235.x.
Shinohara, T. (1985). Gas chromatographic analysis of volatile fatty acids in wines. Agricultural and Biological Chemistry, 49(7), 2211-2212. http://dx.doi.org/10.1271/bbb1961.49.2211.
Skinkis, P. A., Bordelon, B. P., & Butz, E. M. (2010). Effects of sunlight exposure on berry and wine monoterpenes and sensory characteristics of traminette. American Journal of Enology and
Viticulture, 61(2), 147-156.
Smart, R. E. (1985). Principles of grapevine canopy microclimate manipulation with implications for yield and quality. A review.
American Journal of Enology and Viticulture, 36(3), 230-239.