Food Science and Technology ISSN 0101-2061
DI:
D http://dx.doi.org/10.1590/1678-457X.6493
1 Introduction
Red wine is the beverage resulting from the fermentation of juice or must extracted from red grapes. Maceration is necessary to provide color, aromas and flavors to the wine. Maceration is the contact, for a rather longer period, of the must with solids (skin, pulp and bloom) after pressing and/or destemming through maceration (Alves, 2009). Such must is made up mostly by sugars, alcohol, organic acids, salts from mineral and organic acids, phenolic compounds, pigments, nitrogenous substances, pectins, gums, mucilage, volatile aromatic compounds (esters, aldehydes and ketones), vitamins, salts and sulfur dioxide (Souza et al., 2006; Ali et al., 2010). Wine yields different chemical and sensory properties, depending on soil, climate and water in the vineyard site where grapes are planted (Andrade et al., 2008).
Quality of the wine depends on the quality of the grape used for its production. Micro climate conditions in the growing period of the vine, particularly in the development of the bud until harvest time, are one of the key factors affecting the quality of the fruit and consequently, the quality of the wine (Révillion et al., 2007; Santos et al., 2011).
In every vineyard, a unique combination of climate, topography and soil, known as terroir, shapes the character of the vines and the grapes they yield. Typicity and quality of the wines are determined by the terroir that houses the vineyard. Such typicity is due to the complexity of its composition. Even with identical elaboration processes, it is impossible to create a wine
that is equal to another one made from grapes of either different origins or different vintages (Guerra et al., 2003; Leeuwen et al., 2004; Adams et al., 2009; Zsófi et al., 2009).
Among the main factors interfering with the typicity of wines are grape variety, region of origin, vintage, cultural traits and elaboration methods. Thus, by combining these distinctive factors, several different wines can be created, each one of them with its own unique characteristics (Guerra et al., 2003; Lee et al., 2006).
Mineral elements, organic acids, phenolic compounds and aromas are the chemical components that mostly impact the characteristics of grapes and wines of each region, either in their final sensory or chemically properties (Guerra et al., 2003).
Chemical and physical properties of the soil affect vine nutrition and the composition of the fruit in such a way that they will eventually impact wine characteristics. The wine industry has, therefore, an interest in the effects of terroir on the characteristics of the fruits and wines and, particularly, in the influence of the type of soil and its minerals (Mackenzie & Christy, 2005; Andrés-de-Prado et al., 2007).
Mineral elements found in grapes and wines are absorbed from the soil through the roots of the vine. They are present mainly in the skin, seeds and cellular walls of the pulp of the grape. The mineral composition of a wine reflects its particular origin and development, making it unique and identifiable.
Chloride concentration in red wines: influence of
terroir
and grape type
Marina Sonegheti CDLI1, Angelo Gil Pezzini RANGEL2, Elizangela Silva SDUZA2,
Margareth Ferraro DLIVEIRA2, Ana Cristina Nascimento CHIARADIA1*
Received 22 Sept., 2014 Accepted 10 Feb., 2015
1Departamento de Ciências Farmacêuticas, Centro das Ciências da Saúde, Universidade Federal do Espírito Santo – UFES, Vitória, ES, Brasil
2Laboratório de Bebidas de Origem Vegetal do Espírito Santo – Labeves, Instituto Tecnológico da UFES – ITUFES, Universidade Federal do Espírito Santo – UFES, Vitória, ES, Brasil *Corresponding author: achiaradia@gmail.com
Abstract
Red wines from different countries have been assessed in order to determine the influence of terroir and grape variety in their concentration of chloride. Chloride analysis was carried out by Laboratório de Bebidas de Origem Vegetal do Espírito Santo
(Labeves), using the potentiometric method, in which the dosing is directly applied to the sample with an Ag/AgCl electrode. Data were collected to establish the level of chloride, as presented in the analysis reports issued by Labeves, and to serve as a wine categorization database, according to grape variety and country of origin. Australia and Argentina presented the highest levels of chloride and the wines made from the Syrah variety presented the highest concentration of such ion. We have, therefore, found that terroir and grape variety do have an influence over the concentration of chloride in red wines.
Keywords: salinity; chloride; wine characterization.
It significantly contributes the wine’s sensory characteristics, affecting color, clearness, flavor and aroma (Rizzon, 2005).
Levels of such minerals will largely depend on the wine-growing area - soil, climate, variety, rootstock, fertilization procedures - and on phytosanitary handling (Rizzon, 2005).
Wine contains from 2 to 4 g L–1 of salts of mineral acids,
along with some organic acids, and they may have a key role on a potential salty taste of a wine, with chlorides being a major contributor to saltiness (Walker et al., 2003; Maltman, 2013).
Therefore, moderate to large concentrations of chlorides and sodium might give the wine a salty flavor which may turn way potential consumers. When the levels of these elements exceed certain limits, marketing and selling the wine may not be allowed in some countries (Grape and Wine Research and Development Corporation, 2011). Moreover, in the case of high concentrations in the soil, such ions may jeopardize production of clusters by the vines, as they hinder water absorption by the plants (Dliver et al., 2013).
The Brazilian Law, through Drdinance ND. 229, Dctober 25th, 1988, issued by Ministério da Agricultura, Pecuária e
Abastecimento [Ministry of Agriculture, Livestock and Supply] (MAPA), establishes the maximum concentration of chlorides in wine at 0.20 g L–1, expressed in sodium chloride (Brasil,
1988). However, such limits vary from country to country; for example, in Australia the maximum level of chloride allowed is 607 mg L–1, (1000 mg L–1 (1 g L–1), expressed as sodium chloride
(Walker et al., 2010b).
As the purpose of our study was to determine the influence of terroir and grape variety in the concentrations of chlorides in different red wines, results from samples from different countries were compared.
2 Materials and methods
This work was developed at Laboratório de Bebidas de Origem Vegetal do Espírito Santo (Labeves), which is integrated to Instituto de Tecnologia da Universidade Federal do Espírito Santo. Labeves is certified by MAPA (Ministério da Agricultura, Pecuária e Abastecimento) [Ministry of Agriculture, Livestock and Supply] to carry out physical and chemical analysis for wines. Labeves has been providing this service since 2006. It uses the methods described in the Manual of Methods and Analysis of Beverages and Vinegars, as prescribed by Drdinance ND. 76, dated November 26th, 1986 (Brasil, 1986). Analysis of chloride, as described by
the manual, is conducted by the potentiometric method, where ions are used directly in the sample by potentiometry, using an Ag/AgCl electrode.
Throughout years, Labeves has performed analysis in thousands of wines from different origins, and the data gathered allow researchers to compare results of wines from different countries, produced from different grape varieties. Analysis reports issued by Labeves are filed separately per year, which enabled us to survey the data they obtained from 2006 until 2013. The findings are organized in such a way to as create a database in which wines were classified per grape variety and
country of origin. With the large data available in the Labaves’ filed reports, we decided to focus on the analysis of chlorides.
For this work, we used the convenience sampling method, which is based in the selection of elements from the sample available to the researcher. We analyzed samples of red wines from the following countries: South Africa, Australia, Argentina, Chile, United States and France (Table 1). Because the quantity of wines coming from Chile and Argentina exceeded the wines from the other countries, samples of these two counties were limited to 50 wines, which were randomly selected from the database. Dur analysis focused on Cabernet Sauvignon, Malbec, Merlot, Pinot Noir and Syrah grape varieties (Table 2).
In order to find out whether data could be compared through parametric tests such as ANDVA (comparison of more than 2 groups), we performed an exploratory analysis of data in order to determine whether they presented a normal distribution and whether there were no atypical figures (outliers), which could directly influence the mean. For that, descriptive statistics were applied (so that behavior of the data could be known); Box Plot type graphics were used to analyze the distribution of results and detect any asymmetry or outliers, while the Shapiro-Wilk test was use to assess normality of data. Since a large standard deviation of mean chloride concentration was found for both country of origin and the grape variety, along with outliers and data asymmetry, and the data was not normally distributed, we decided to carry out non parametric tests, i.e, Kruskal-Wallis (comparison of more than two groups). This test detects whether there is significant statistical difference amongst different countries and grape varieties. In order to clearly identify where such difference lay, it was necessary to resort to a test which would allow multiple comparisons, and the Dunn Test was chosen.
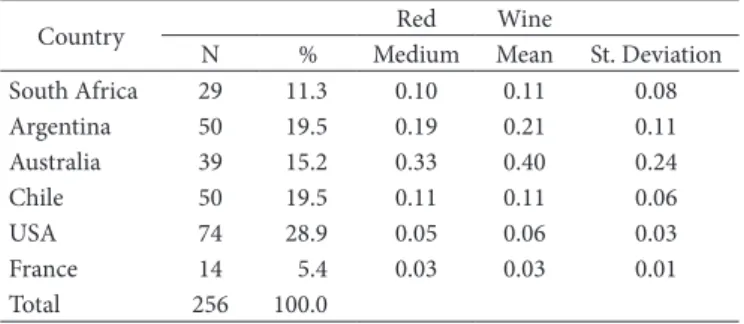
Table 1. Absolute numbers and percentages from sample according to country and descriptive statistics.
Country Red Wine
N % Medium Mean St. Deviation
South Africa 29 11.3 0.10 0.11 0.08
Argentina 50 19.5 0.19 0.21 0.11
Australia 39 15.2 0.33 0.40 0.24
Chile 50 19.5 0.11 0.11 0.06
USA 74 28.9 0.05 0.06 0.03
France 14 5.4 0.03 0.03 0.01
Total 256 100.0
Table 2. Absolute numbers and percentages from sample according to grape variety and descriptive statistics.
Grape variety Red Wine
N % Medium Mean St. Deviation Cabernet
Sauvignon
75 29.5 0.07 0.10 0.09
Malbec 31 12.2 0.12 0.14 0.09
Merlot 37 14.5 0.11 0.14 0.11
PinotNoir 36 14.2 0.07 0.07 0.04
Syrah 75 29.5 0.18 0.26 0.23
statistical difference was found, whereas the Dunn test indicated that only wines from South Africa and Chile were not different.
According to our findings, Australia wines have the highest levels of chlorides, followed by Argentinean wines, a country that bears the second position for the concentration levels of such ion. Differences in the physicochemical characteristics of wines may be due to several factors. All of them are related to soil and climate conditions, as well as to oenological practices used during maturation of the grapes and vinification process (Rizzon & Miele, 2011).
Absorption of chloride and sodium ions by the vine roots and consequent concentration levels of such elements in the wines depend, essentially, on geographical, geological and climate conditions, and on the handling the vineyard cultures. In general these levels of ions are low, but concentrations of such elements increase in wines made from vineyards located closer to the sea. In those areas, in general, subsoil is brackish or irrigation of arid terrains is done with salty water (Leske et al., 1997; International Drganisation of Vine and Wine, 2013).
Comparisons among Australian wines and the ones coming from the United States of America and Europe have shown that the wines from Australia contain much more salts, especially chlorides, than wines from other origins (Leske et al., 1997). High levels of salts in those wines may be due to limited sources of water, general high levels of evaporation and existing salts dissolved into irrigation water. All these result in increased salinity of the soil and, consequently, increased levels of salts in the wines (Tregeagle et al., 2006; Walker et al., 2010b).
Leske et al. (1997) have analyzed chloride concentration in samples from several parts of Australia and observed that a large proportion of grape juice (1.5% out of total 1214 juice samples), most of them from the Padthway region, where irrigation is classified as highly salty, contained chlorides in levels above or similar to the ones permitted by Australian Food Standard Code P4 (Australian Food Standards Code, 1997). Another factor which may account for increased chloride concentration in the juice, as pointed by Leske et al. (1997), is that few wineries in Australia use rootstocks to minimize absorption of chloride through the roots, whereas most European wineries use them. This would explain lower levels of chlorides in European wines, as some rootstocks might hinder absorption of that ion.
3 Results and discussion
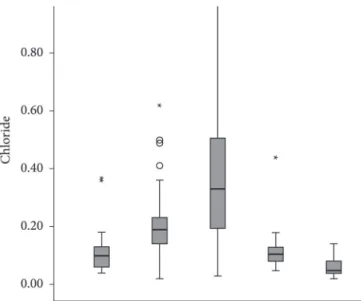
After organizing the database, we performed the statistical analysis of the results. Through descriptive statistics, we observed a significant standard deviation of the mean in chloride levels, both in regard to country classification and grape variety (Tables 1 and 2). In the Box-Plot type graphics, asymmetry of data and outliers were observed in both graphics (Figure 1 and 2). The Shapiro-Wilk test revealed that the data were not normally distributed.
A large standard deviation of the mean chloride concentration was found for both country of origin and the grape variety, along with outliers and data asymmetry; also, the data was not normally distributed. Non-parametric tests were then undertaken (Kruskal-Wallis, for comparison of more than two groups) along with Dunn’s multiple comparison test.
In comparing levels of chlorides in wines from different countries (Table 3), using the Kruskal-Wallis test, a significant
Figure 1. Chloride distribution according to countries of origin.
Figure 2. Chloride distribution according to grape variety.
Table 3. Results of the Kruskal-Wallis and Dunn test for chlorides in wines from different ocountries.
Countries Mean Positions
South Africa 119.07c
Argentina 186.92b
Australia 217.05a
Chile 129.40c
USA 65.78d
France 21.00e
p-value (kruskal-wallis) 0.000
4 Conclusions
1- Chloride concentration in the wine is influenced by terroir and its highest levels are found in wines coming from countries where irrigation is carried out using salty water or in areas with brackish terrains.
2- Australia and Argentina are the countries whose wines present the highest levels of chlorides.
3- Grape variety influences concentration of chlorides in the wines. Syrah is most likely to absorb chlorides.
References
Adams, G., Austin, C., Baudains, R., Besonen, J., Buckley, K., Brook, S., Fallowfield, G., Gilby, C., Jones, R., Keevil, S., Lawther, J., Lazarakis, K., Lloyd, A., MacDonogh, G., Mayson, R., Pslij, M., Peskett, S., Port, J., Radford, J., Voss, R., Werner, G., White, P., & Willians, D. (2009). Guia Ilustrado Zahar: vinhos do mundo todo (4. ed.). Rio de Janeiro: Zahar. 688 p.
Ali, K., Maltese, F., Choi, Y. H., & Verpoorte, R. (2010). Metabolic constituents of grapevine and grape-derived products. Phytochemistry Reviews, 9(3), 357-378. http://dx.doi.org/10.1007/s11101-009-9158-0. PMid:20835385
Alves, A. A. (2009). Estudo e validação de um método de quantificação de elementos em vinho (Dissertação de mestrado em Química Analítica e Controle de Qualidade). Universidade de Aveiro, Aveiro. Andrade, M. F., Souza, D. J. P., Silva, B. P., & Paim, A. P. S. (2008).
Análise multivariada de parâmetros físico-químicos em amostras de vinhos tintos comercializados na região metropolitana do Recife. Quimica Nova, 31(2), 296-300. http://dx.doi.org/10.1590/S0100-40422008000200020.
Andrés-de-Prado, R., Yuste-Rojas, M., Sort, X., Andrés-Lacueva, C., Torres, M., & Lamuela-Raventós, R. M. (2007). Effect of soil type on wines produced from Vitis vinifera L. cv. Grenache in commercial vineyards. Journal of Agricultural and Food Chemistry, 55(3), 779-786. http://dx.doi.org/10.1021/jf062446q. PMid:17263474 Australian Food Standards Code. (1997). Standard P4: wine, sparkling
wine and fortified wine. Canberra: Australian Government Publishing Service.
Brasil. (1986). Dispõe sobre métodos analíticos de bebidas e vinagres (Portaria nº 76 de 26 de novembro de 1986). Diário Dficial [da] República Federativa do Brasil. Retrieved from http://www.jusbrasil. com.br/diarios/DDU/1986/12/03.
Brasil. (1988). Complementação de padrões de identidade e qualidade dos vinhos (Portaria nº 229, de 25 de outubro de 1988). Diário Dficial [da] República Federativa do Brasil. Retrieved from http://www. jusbrasil.com.br/diarios/DDU/.
Grape and Wine Research and Development Corporation – GWRDC. Salty skin: reds most at risk. R&D At Work, 2. Retrieved from http:// research.agwa.net.au/news-and-events/rdwork/page/2/.
Guerra, C. C., Silva, G. A., Tonietto, J., & Mello, L. M. R. (2003). Uva para processamento pós-colheita (Frutas do Brasil, No. 36). Brasília:
Embrapa Informação Tecnológica. 67 p.
International Drganisation of Vine and Wine – DIV. (2013). Compendium of International Methods of Analysis of Wine and Musts: the level of sodium and chloride íons in wines. Resolution Oeno 6/91 (Method
OIV-MA-D1-03, Vol. 2, pp. 1). Paris. Retrieved from www.oiv.int/
oiv/info/enplubicationoiv#compendium
Lee, S. J., Lee, J. E., Kim, H. W., Kim, S. S., & Koh, K. H. (2006). Development of Korean red wines using Vitis labrusca varieties:
Like Austria, Argentinean soil presents natural high levels of sodium and chloride (Leske et al., 1997). Vineyards, especially the ones of the Malbec variety, are located in the low rainfall West region of the country, sheltered by the Andes. Vineyard areas in the Northern and Eastern sides of Mendoza are plain and located between 600 / 700 meters above sea level. Its poor and sandy soil is irrigated by the high-salinity Mendoza river, which gives the wines produced there a subtle acidity (Adams et al., 2009).
The specifications of some European countries as well as Brazil are often based on experience with European wines, and do not take into account the composition of wines from countries such as Argentina and Australia, that may have a high natural concentration of sodium and chloride.
The Brazilian law establishes the maximum concentration of chlorides in wine at 0.20 g L-1, expressed in sodium chloride.
Some Australian and Argentine wines present concentration of chlorides above this value. In Australia, the maximum level allowed is 1 g L–1, expressed as sodium chloride.
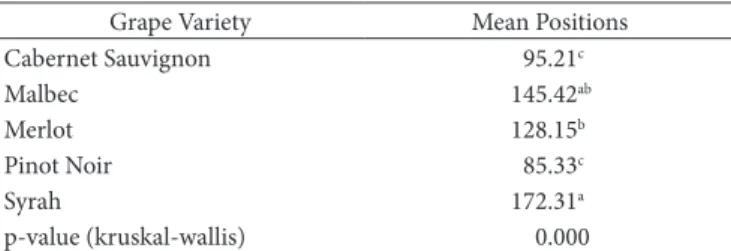
Table 4 shows the results of the Kruskal-Wallis tests, with the Syrah and Malbec grapes presenting higher levels of chlorides (mean positions 172.31 e 145.42, respectively). Dn the other hand, the Pinot Noir variety presented the lowest concentration of the component.
Vitis vinifera varieties are considered to be moderately resistant to salinity (Mass & Hoffman, 1997) and are only partially capable of eliminating chlorides absorbed from the soil. Nevertheless, some rootstocks are capable of limiting absorption of chlorides (Leske et al., 1997; Walker et al., 2004, 2010a). Walker et al. (2010a) analyzed chloride concentration in the juice and petiole of Syrah grafting, which were grafted onto their own roots and onto a range of rootstocks (Ransey - Vitis champinii, 1103 Paulsen - V.berlandieri x V. rupestris, 140 Ruggeri - V.berlandieri x V. rupestris, K51-40 – Vitis champinii x
Vitis riparia ‘Gloire’, Schwarzmann – Vitis riparia x Vitis rupestris, Millardet et de Grasset – Vitis riparia x Vitis rupestris, Rupestris St. George – Vitis rupestris, 1202 Courdec – Vitis vinifera x Vitis rupestris), that were planted in vineyards located elsewhere in Australia. He realized that, regardless the site where vineyards were planted, Syrah grapes grafted onto their own roots and onto rootstocks as 1202 Courdec (V. vinifera x V. rupestris) e K 51-40 (V. champinii x V. riparia ´Gloire´) presented higher levels of chlorides in their juices and petioles, which shows that Syrah is more likely to absorb chlorides from the soil.
Table 4. Results of the Kruskal-Wallis and Dunn test for chlorides in wines of different grape varieties.
Grape Variety Mean Positions
Cabernet Sauvignon 95.21c
Malbec 145.42ab
Merlot 128.15b
Pinot Noir 85.33c
Syrah 172.31a
p-value (kruskal-wallis) 0.000
vinífera conduzida sob dupla poda sequencial. Revista Brasileira de Engenharia Agrícola e Ambiental, 15(12), 1251-1256. http://dx.doi. org/10.1590/S1415-43662011001200006.
Souza, G. G., Meneghin, L. D., Coelho, S. P., Maia, J. F., & Silva, A. G. (2006). A uva roxa, Vitis vinífera L. (Vitaceae): seus sucos e vinhos na prevenção de doenças vasculares. Natureza On-line, 4(2), 80-86. Tregeagle, J. M., Tisdall, J. M., Blackmore, D. H., & Walker, R. R. (2006). A diminished capacity for chloride exclusion by grapevine rootstocks following long-term saline irrigation in an inland versus a coastal region of Australia. Australian Journal of Grape and Wine Research, 12(3), 178-191. http://dx.doi.org/10.1111/j.1755-0238.2006.tb00058.x. Walker, R. R., Blackmore, D. H., Clingeleffer, P. R., Godden, P., Francis, L., Valente, P., & Robinson, E. (2003). Salinity effects on vines and wines. Bulletin de l’Organisation International de la Vigne et du Vin, 76(865-866), 201-227.
Walker, R. R., Blackmore, D. H., Clingeleffer, P. R., & Correll, R. L. (2004). Rootstock effects on salt tolerance of irrigated field grown grapevines (Vitis vinifera L.cv. Sultana) 2. Ion concentration in leaves and juice. Australian Journal of Grape and Wine Research, 10(2), 90-99. http://dx.doi.org/10.1111/j.1755-0238.2004.tb00011.x. Walker, R. R., Blackmore, D. H., & Clingeleffer, P. R. (2010a). Impact
of rootstock on yield and ion concentrations in petioles, juice and wine of Shiraz and Chardonnay in different viticultural environments with different irrigation water salinity. Australian Journal of Grape and Wine Research, 16(1), 243-257. http://dx.doi.org/10.1111/j.1755-0238.2009.00081.x.
Walker, R. R., Blackmore, D. H., & Gong, H. (2010b). Drganic and inorganic anions in shiraz and chardonnay grape berries and wine as affected by rootstock under saline conditions. Australian Journal of Grape and Wine Research, 16(1), 227-236. http://dx.doi. org/10.1111/j.1755-0238.2009.00070.x.
Zsófi, Z., Gál, L., Szilágyi, Z., Szűcs, E., Marschall, M., Nagy, Z., & Bálo, B. (2009). Use of stomatal conductance and pre-dawn water potencial to classify terroir for the grape variety Kékfrankos. Australian Journal of Grape and Wine Research, 15(1), 36-47. http://dx.doi. org/10.1111/j.1755-0238.2008.00036.x.
instrumental and sensory characterization. Food Chemistry, 94(3), 385-393. http://dx.doi.org/10.1016/j.foodchem.2004.11.035. Leeuwen, C. V., Friant, P., Choné, X., Tregoat, D., Koundouras, S., &
Dubourdieu, D. (2004). Influence of climate soil, and cultivar on terroir. American Journal of Enology and Viticulture, 55, 207-217. Leske, P. A., Sas, A. N., Couter, A. D., Stockley, C. S., & Lee, T. H. (1997).
The composition of Australiam grape juice: chloride, sodium and sulfate ions. Australian Journal of Grape and Wine Research, 3(1), 26-30. http://dx.doi.org/10.1111/j.1755-0238.1997.tb00113.x. Mackenzie, D. E., & Christy, A. G. (2005). The role of soil chemistry in
wine grape quality and sustainable soil management in vineyards. Water Science and Technology, 51(1), 27-37. PMid:15771096. Maltman, A. (2013). Minerality in wine: a geological perspective.
Journal of Wine Research, 24(3), 169-181. http://dx.doi.org/10.108 0/09571264.2013.793176.
Mass, E. V., & Hoffman, G. J. (1997). Salt crop tolerance: current assessment. Journal of the Irrigation and Drainage Division, 6, 115-134. Dliver, D. P., Bramley, R. G. V., Riches, D., Porter, I., & Edwards, J. (2013).
Review: soil physical and chemical properties as indicators of soil quality in Australian viticulture. Australian Journal of Grape and Wine Research, 19(2), 129-139. http://dx.doi.org/10.1111/ajgw.12016. Révillion, J. P. P., Flôres, S. H., Wilk, E. D., Badejo, M. S., Mercali, G. D., Gandolfi, L. M., Alles, M. J. L., Mariot, R. F., Campos, S. U., Alberti, S. S., & Romero, A. M. (2007). Qualidade sensorial de vinhos tintos finos do Rio Grande do Sul comparados aos importados da Argentina e Chile. Ciência e Tecnologia de Alimentos, 27(1), 177-180. http:// dx.doi.org/10.1590/S0101-20612007000100031.
Rizzon, L. A. (2005). Teor de cátions dos vinhos da Serra Gaúcha. In J. M. Souza Filho & V. Manfrói (Drgs.). Vinho e Saúde: vinho como alimento natural (pp. 41-42). Simpósio Internacional Vinho e Saúde, Bento Gonçalves. Bento Gonçalves: Ibravin.
Rizzon, L. A., & Miele, A. (2011). Discrimination of brazilian red varietal wines according to theirs sensory descriptors. Ciência e Agrotecnologia, 35(6), 1172-1176. http://dx.doi.org/10.1590/S1413-70542011000600018.