Ori
g
in
a
l
Recebido para publicação em 15/9/2008 Aceito para publicação em 18/7/2009 (003750)
1Embrapa Uva e Vinho, CP 130, CEP 95700-000, Bento Gonçalves – RS, Brasil, E-mails: miele@cnpuv.embrapa.br; rizzon@cnpuv.embrapa.br; zanus@cnpuv.embrapa.br *A quem a correspondência deve ser enviada
Discrimination of Brazilian red wines according to the
viticultural region, varietal, and winery origin
Discriminação de vinhos tintos brasileiros de acordo com a região vitícola, varietal e vinícola
Alberto MIELE1*, Luiz Antenor RIZZON1, Mauro Celso ZANUS1
1 Introduction
The annual Brazilian grape production is over one million tons, half sold as table grapes and the other half as grapes for processing. Considering the latter segment, wine is an important product due to the added value it transfers to wineries and grape growers.
Nevertheless, the Brazilian wine industry has low competitiveness. Today, most of the fine wine consumed in Brazil is imported from Chile, Argentina, and European countries. To mitigate this effect, it is necessary to improve wine competitiveness, which could be reached with tipicity, quality, and price. Thus, some actions are being taken by wine producers and wine sellers.
There are few studies in Brazil regarding viticultural region, varietal wines, and wineries. In fact, the characterization of Cabernet Franc wines from five different areas of the Serra Gaúcha should be pointed out (MIELE et al., 1996; MIELE, 1999). In another study, discrimination between Brazilian, Argentinean, and Uruguayan wines was established (RIZZON; MIELE; ROSIER, 1997). However, there are many works carried out concerning physicochemical and/or sensory characterization of varietal wines (BEHRENS; SILVA, 2000; RIZZON; MIELE, 2000, 2001, 2002, 2003, 2004; MANFROI et al., 2006; MENEGUZZO et al., 2006; MIELE; RIZZON, 2006; RIZZON; Resumo
O trabalho avaliou a composição físico-química de 171 vinhos tintos brasileiros elaborados na safra de 2006, representados por 21 varietais. Os vinhos foram elaborados por 58 vinícolas localizadas em sete regiões vitícolas do País com latitudes variando de 9º a 31º Sul. A análise físico-química foi feita em 2006 e a discriminação entre as regiões vitícolas, os vinhos varietais e as vinícolas foi realizada através da análise de componentes principais (ACP). Os principais resultados mostram que ao se considerar as regiões vitícolas, os vinhos elaborados em São Joaquim caracterizaram-se por valores mais elevados de A420, A520, A620, intensidade de cor, compostos fenólicos totais, antocianinas e extrato seco, enquanto que os de Toledo apresentaram valores mais baixos dessas variáveis; os do Vale do São Francisco tiveram valores mais elevados de potássio, pH, densidade e acidez volátil; os da Serra do Nordeste A, maior acidez titulável; e os do Planalto Superior B, matiz mais elevado. No que se relaciona aos vinhos varietais, a ACP discriminou os vinhos feitos com as variedades Ancellotta, Teroldego, Egiodola, Refosco, Marselan, Cabernet Sauvignon, Pinotage, Pinot Noir, Malbec, Arinarnoa, Barbera e Alfrocheiro. Com relação às vinícolas, vinte e duas delas foram discriminadas por apresentarem parâmetros mais elevados de determinadas variáveis, i.e., três delas por terem maior intensidade de cor; três, por seu matiz; oito, pelo teor de álcool; seis, por potássio, extrato seco, densidade e pH; e duas, pela acidez titulável.
Palavras-chave: composição físico-química; origem geográfica; cultivar; empresa vinícola; ACP.
Abstract
This work evaluated the physicochemical composition of 171 red Brazilian wines from the 2006 vintage, which were represented by 21 varietals. These wines were produced by 58 Brazilian wineries in different regions of the country, with latitudes varying from 9º to 31º South. Physicochemical wine analysis was performed in the same year and discrimination in the viticultural regions, varietal wines, and wineries was performed by means of the principal component analysis (PCA). The main results show that wines from São Joaquim had higher values of A420, A520, A620, color intensity, total phenolic compounds, anthocyanins, and dry extracts, while those from Toledo had lower values of these variables; those from Vale do São Francisco had higher values of potassium, pH, density, and volatile acidity; from Serra do Nordeste A, they had higher titratable acidity; and from Planalto Superior B, higher hue. Regarding the varietal wines, PCA mainly discriminated the wines produced from the varieties Ancellotta, Teroldego, Egiodola, Refosco, Marselan, Cabernet Sauvignon, Pinotage, Pinot Noir, Malbec, Arinarnoa, Barbera, and Alfrocheiro. In relation to wineries, twenty two of them were discriminated by their higher values of some variables, i.e., three were characterized by color intensity; three by hue; eight by alcohol content; six by potassium, dry extract, density, and pH; and two by titratablel acidity.
Cabernet Sauvignon (CSA), Carmenère (CAR), Egiodola (EGI), Malbec (MAL), Marselan (MAR), Merlot (MER), Pinot Noir (PNO), Syrah (SYR), Tannat (TAN); Italy (4) - Ancellotta (ANC), Barbera (BAR), Refosco (REF), Teroldego (TER); Portugal (3) - Alfrocheiro (ALF), Periquita (PER), Touriga Nacional (TNA); South Africa (1) - Pinotage (PTE); Spain (1) - Tempranillo (TEM); and in United States (1) - Ruby Cabernet (RCA).
The physicochemical variables analyzed were: density (DEN), alcohol (ALC), titratable acidity (TAC), volatile acidity (VAC), pH (pH), dry extract (DEX), anthocyanins (ANT), total phenolic compounds (TPF), absorbancies at 420 nm (A420), 520 nm (A520), and 620 nm (A620), color intensity (CIN), hue (HUE), and potassium (K). The methodology used in these analyses was based on the work of Ribéreau-Gayon et al. (1976). Wineries were enumerated from 1 to 58, avoiding specifying their commercial name.
The sensory evaluation of the 171 wines was performed according to international procedures (PEYNAUD, 1980; AMERINE; ROESSLER, 1983; SSHA, 1998; MEILGAARD; CIVILLE; CARR, 1999; MIELE; MIOLO, 2003). The sensory analysis sessions were performed in August 2006 by 75 panelists with substantial enology background. Wine samples were blindly analyzed using ISO glasses, served monadically at the temperature of 17 °C. The evaluation sheet used was the one from the Organisation Internationale de la Vigne et du Vin (OIV) and the Association Internationale des Œnologues (AIŒ). The wine quality was rated in a scale ranging from 0 to 100.
The results were submitted to the principal component analysis (PCA) (HAIR Jr. et al., 1995), in which the viticultural region, varietal wine, and winery origin effects were discriminated.
3 Results and discussion
The PCA showed that there was an important discrimination among the 171 wines as a function of the viticultural region, the varietal wines, and the wineries where they were produced.
3.1 Viticultural region
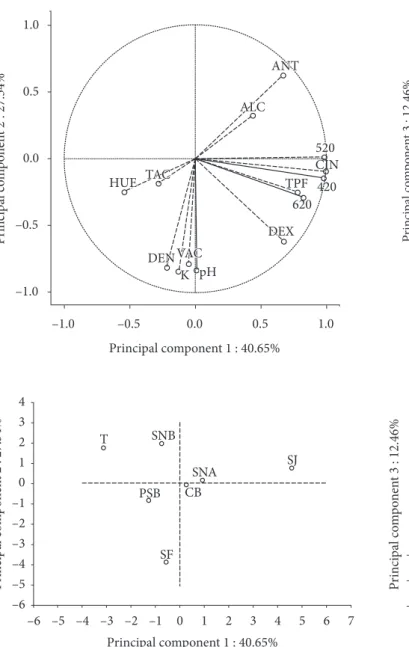
Figures 1 and 2 shows the discrimination among the viticultural regions. In fact, the three main principal components (PC) represented 80.65% of the total variation, where PC 1 was responsible for 40.65%; PC 2, 27.54%; and PC 3, 12.46%.
The variables best correlated for PC 1 were (correlation coefficients in brackets): color intensity (CIN) (r = 0.99), A520 (520) (r = 0.98), A420 (420) (r = 0.97), A620 (620) (r = 0.82), total phenolic compounds (TPF) (r = 0.77), dry extract (DEX) (r = 0.67), and anthocyanins (ANT) (r = 0.67); for PC 2, potassium (K) (r = –0.85), pH (pH) (r = –0.84), density (DEN) (r = –0.81), and volatile acidity (VAC) (r = –0.79); and for PC 3, titratable acidity (TAC) (r = –0.69) and hue (HUE) (r = 0.68).
Regarding the viticultural regions, PC 1 discriminated São Joaquim (SJ) and Toledo (T); PC 2, Vale do São Francisco (SF) and Serra do Nordeste B (SNB); and PC 3, Planalto Superior B MIELE, 2006; FALCÃO et al., 2007; TECCHIO; MIELE;
RIZZON, 2007; FALCÃO et al., 2008).
There have been many articles published concerning these aspects worldwide. Regarding the discrimination of viticultural regions, the studies carried out to establish the authenticity and regional origin of Slovenian wines should be mentioned (OGRINC et al., 2001); in Canada, red wines from three sub-appellations were sensory characterized (KONTKANEN et al., 2005); in France, red wines were discriminated according to three viticultural areas (PICQUE et al., 2005); and Riesling wines were discriminated from different countries (LIU et al., 2008). Concerning varietal wines, the work of NOBEL (1981) should be mentioned, which differentiated six white varietal wines in California using volatile compounds; in South Africa, the discrimination of five red varietals based on non-colored phenolic content (VILLIERS et al., 2005); differences among three clonal Aragonez red wines in Portugal were established (BOTELHO et al., 2007); the discrimination of four Madeira varietal wines (CAMARA; ALVES; MARQUES, 2007); the discrimination of the three main cultivars of the Bordeaux region (PEREIRA et al., 2007); and the differentiation of five red varieties cultivated in a warm climate region of Spain (VIVIANI; MORENO; PEINADO, 2007).
However, there is no information on discrimination for wineries. It is not easy to specify differences among them because they can use different winemaking technologies for different grape cultivars and also for the same cultivar, e.g., maceration time, kind of wine to be produced and enological products used during the process of vinification.
Therefore, this work addresses the discrimination of Brazilian red wines from the 2006 vintage, according to seven different viticultural regions of the country, 21 varietal wines, and 58 wineries, all in different regions of the country.
2 Materials and methods
The 171 red varietal wines were from seven different viticultural regions of the country, spanning from 9º to 31º South, representing 21 grape varieties, and produced by 58 wineries in 2006. The analyses were performed in the same year of vinification. Wine samples were directly collected in the wineries from inoxidable tanks or oak barrels. These wines took part of the National Wine Evaluation, an event annually promoted by the Brazilian Enology Association (ABE).
The viticultural regions considered in this work were: São Joaquim (SJ), in the State of Santa Catarina; Toledo (T), in the State of Paraná; Vale do São Francisco (SF), in the States of Pernambuco and Bahia; Serra do Nordeste A (SNA), Serra do Nordeste B (SNB), Planalto Superior B (PSB), and Campanha B (CB), in the State of Rio Grande do Sul. The last four regions mentioned were classified according to the studies conducted and published during the 1990s, which classify the state in agroecological regions (RIO GRANDE DO SUL, 1994; MALUF; WESTPFALEN, 1999).
the Vale do São Francisco (SF) had higher values of potassium (K), pH (pH), density (DEN), and volatile acidity (VAC). Figure 2 shows that wines from Serra do Nordeste A (SNA) were characterized by higher values of titratable acidity (TAC) and those from Planalto Superior B (PSB) by hue (HUE).
Wines made in São Joaquim (SJ), a somewhat colder and higher altitude viticultural region − about 1,200 m high −, had (PSB). Campanha B (CB) and Serra do Nordeste A (SNA) were
placed intermediary.
Figure 1 shows that wines from São Joaquim (SJ) were characterized by higher values of A420 (420), A520 (520), color intensity (CIN), A620 (620), total phenolic compounds (TPF), anthocyanins (ANT), and dry extract (DEX), while those from Toledo (T) by lower values of these variables. Wines made in
420 420 620 620
CIN CIN
1.0 0.5
1.0
0.5
0.0 0.0
–0.5
–0.5 –1.0
–1.0
P
rin
ci
pa
l co
m
po
n
en
t 2 : 27.54%
Principal component 1 : 40.65% ANT ANT
ALC ALC
HUE HUE TACTAC
DEN DEN
K K pHpH VAC VAC
DEX DEX
520 520
TPF TPF
P
rin
ci
pa
l co
m
po
n
en
t 2 : 27.54%
Principal component 1 : 40.65% CB
SF 4
3 2 1 0 –1 –2 –3 –4 –5 –6
4 5 6 7
3 2 1 0 –1 –2 –3 –4 –5 –6
T SNB
SNA SJ
PSB
Figure 1. Projection of variables and viticultural regions on the plane formed by PCs 1 × 2. TAC = Titratable acidity; VAC = Volatile acidity; ALC = Alcohol; pH = pH; DEN = Density; DEX = Dry extract; ANT = Anthocyanins; TPF = Total phenolic compounds; 420 = Absorbancy at 420 nm; 520 = Absorbancy at 520 nm; 620 = Absorbancy at 620 nm; CIN = Color intensity; HUE = Hue; K = Potassium; SJ = São Joaquim; T = Toledo; SF = Vale do São Francisco; SNA = Serra do Nordeste A; SNB = Serra do Nordeste B; PSB = Planalto Superior B; CB = Campanha B.
–1.0 –1.0
–0.5 –0.5
0.0 0.0
0.5 0.5
1.0 1.0
P
rin
ci
pa
l co
m
po
n
en
t 3 : 12.46%
DEN
TAC VAC K
pH HUE
ALC
DEX 620 420
520
TPF
ANT CIN
Principal component 1 : 40.65%
P
rin
ci
pa
l co
m
po
n
en
t 3 : 12.46%
Principal component 1 : 40.65% 5
4
3
2
1
0
–1
–2
–3
–6 –5 –4 –3 –2 –1 0 1 2 3 4 5 6 7
PSB
SNB
SNA
SJ
CB SF T
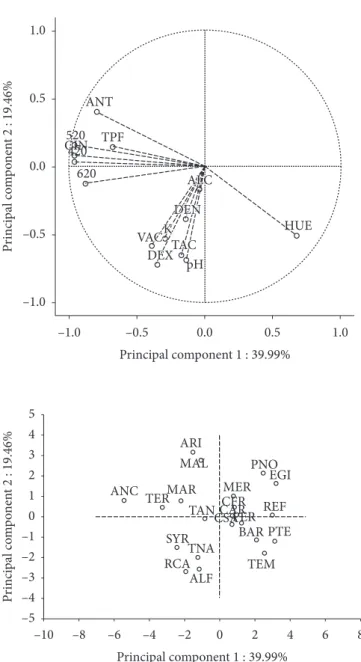
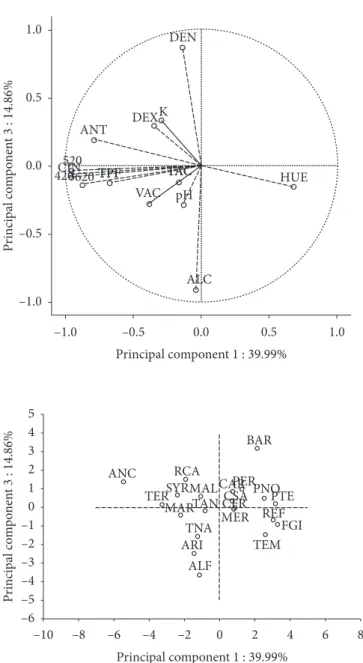
anthocyanins (ANT) (r = –0.80), total phenolic compounds (TPF) (r = –0.68), and hue (HUE) (r = 0.68); for PC 2, dry extract (DEX) (r = –0.72), pH (pH) (r = –0.68), and titratable acidity (TAC) (r = –0.66); and for PC 3, alcohol (ALC) (r = –0.91) and density (DEN) (r = 0.88).
higher values of variables related to wine color and body. On the other hand, those from Toledo (T), State of Paraná, and from Vale do São Francisco (SF), States of Pernambuco and Bahia − this one a semi-arid region presenting high temperatures − had lower values. Phenols and anthocyanins are influenced by many factors, where night and day temperatures during ripening are especially important (JACKSON; LOMBARD, 1993). It is important to mention, however, that the concentration of anthocyanins in the red grape skin and consequently in wines is not only due to the environment. Indeed, it depends on other factors, such as the soil conditions, the cultural practices used in the vineyard − such as the canopy and soil management − as well as the procedures during winemaking.
When the quality variable was included, expressed by the general score, PCA showed that wines from São Joaquim (SJ) had the higher scores while those from Toledo (T) had lower ones. The most important correlations (in brackets) in the general score and the variables were due to alcohol (ALC) (r = 0.81), A620 (620) (r = 0.77), and dry extract (DEX) (r = 0.77). However, it is important to mention that the number of samples from São Joaquim (SJ) was much smaller than those from Serra do Nordeste A, which is an important point to consider. Nevertheless, the results show that this region has climatic conditions to produce wines with intense color and body. On the other hand, wines produced in high-temperature regions, such as Toledo (T), had opposite characteristics.
There are few studies on the discrimination among the Brazilian viticultural regions. In fact, the literature points out the work discriminating Cabernet Franc wines from five areas of the Serra Gaúcha (MIELE et al., 1996; MIELE,1999). However, it is important to mention that in that study, the wines from those areas were produced with the same technology, while the 171 samples evaluated in the present work were made considering the technology of each winery. The same can be said about the studies performed in other regions of the world. Thus, Rizzon, Miele and Rosier (1997) discriminated wines from Argentina, Brazil, and Uruguay according to their mineral composition; in Slovenia, Ogrinc et al. (2001), applying a combination of isotope ratio and site-specific natural isotopic fractionation distinguished wines from the coastal and continent regions; in Canada, Kontkanen et al. (2005) established the differences of Bordeaux-style red wine from three sub-appellations of the Niagara Peninsula; Liu et al. (2006), working with VIS and NIR spectroscopy, were able to differentiate Tempranillo wines from Spain and Australia; and Liu et al. (2008) discriminated White Riesling wines from Australia, New Zealand, France, and Germany.
3.2 Varietal wine
Figures 3 and 4 shows the discrimination among varietal wines. In fact, the three more important PCs represented 74.31% of the total variation, where PC 1 was responsible for 39.99%; PC 2, 19.46%; and PC 3, 14.86%.
The best correlated variables for PC 1 were (correlation coefficients in brackets): color intensity (CIN) (r = –0.97), A520 (520) (r = –0.97), A420 (420) (r = –0.96), A620 (620) (r = –0.89),
–1.0 –1.0
–0.5 –0.5
0.0 0.0
0.5 0.5
1.0 1.0
P
rin
ci
pa
l co
m
po
n
en
t 2 : 19.46%
pH
HUE 620
420 520 TPF
ANT
CIN
Principal component 1 : 39.99% ALC
ALC
DEN DEN
TAC TAC VAC VACKK
DEX DEX
P
rin
ci
pa
l co
m
po
n
en
t 2 : 19.46%
Principal component 1 : 39.99% 5
4 3 2 1 0 –1 –2 –3
–10 –8 –5
–4 –4
–6 –2 0 2 4 6 8
RCA TEM
CSA ANC
TER TAN MAR
MAL ARI
EGI PNO MER CFR CARPER REF
BAR PTE SYR
TNA
ALF
The varietal wines Ancellotta (ANC), Teroldego (TER), and Marselan (MAR) had higher parameters of the variables responsible for the wine color and body, such as A520 (520), A420 (420), color intensity (CIN), A620 (620), anthocyanins (ANT), and total phenolic compounds (TPF), while those made from Egiodola (EGI), Refosco (REF), Pinot Noir (PNO), and Pinotage (PTE) had less color and body. Alfrocheiro (ALF) wine had a higher alcohol (ALC) content and Barbera (BAR) had a higher density (DEN), in other words, less alcohol (Figures 3 and 4). This was certainly due to the genetic characteristics of the grape cultivars, however it could also be due to the local soil and climatic conditions where they were cultivated, the cultural practices used in the vineyards, and the winemaking procedures. Regarding the alcohol content and density, it is difficult to comment the results because there is no information on chaptalization, which could have a great impact on the wine composition.
When a wine quality variable was added, PCA showed that the varietal wine Teroldego (TER) had higher scores, followed by Arinarnoa (ARI) and Tannat (TAN), while Barbera (BAR), Refosco (REF), and Pinotage (PTE) wines had lower ones. The most important correlation coefficients (in brackets) that discriminated these varietals were due to the variables A620 (r = 0.75), A420 (r = 0.72), color intensity (CIN) (r = 0.72), A520 (r = 0.69), and anthocyanins (ANT) (r = 0.47). These results show a very important effect of phenolic compounds on the varietal wine score, which are responsible for the wine color and body.
Chemical and statistical analyses are commonly used to discriminate varietal wines all over the world. The works of Camara, Alves and Marques (2007) should be cited, which distinguished Madeira wines made from Boal, Malvazia, Sercial, and Verdelho working on the free fraction of monoterpenols and norisoprenoids; and in France, Pereira et al. (2007), working with metabolic profile based on proton nuclear magnetic resonance spectra, differentiated Cabernet Franc, Cabernet Sauvignon, and Merlot wines; Setkova, Risticevic and Pawliszyn (2007), using chromatographic-time-of-flight mass spectrometric method, differentiated ice wines from Canada and the Czech Republic. In addition to varietal wines, it is possible to discriminate wines made from clones from only one grape variety. Indeed, Botelho et al. (2007), in Portugal, discriminated three clones of Aragonez red wines using the gas chromatography-olfactometry method.
3.3 Winery
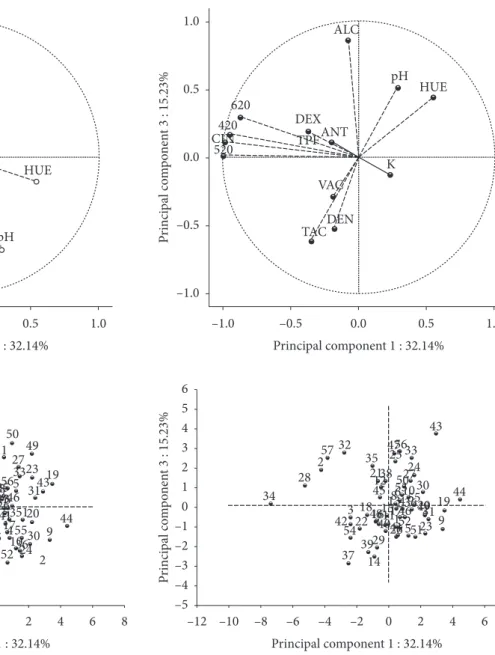
Figures 5 and 6 show the discrimination conducted among the wineries. In fact, the three more important PCs represented 66.93% of the total variation, with PC 1 responsible for 32.14%; PC 2, 19.56%; and PC 3, 15.23%.
The best correlated variables for PC 1 were (correlation coefficients in brackets): A520 (520) (r = –0.98), color intensity (CIN) (r = –0.98), A420 (420) (r = –0.95), and A620 (620) (r = –0.87); for PC 2, potassium (K) (–0.84), density (DEN) (r = –0.74), dry extract (DEX) (r = –0,73), and pH (pH) PC 1 discriminated varietal wines made from the varieties
Ancellotta (ANC), Teroldego (TER), Egiodola (EGI), Refosco (REF), Marselan (MAR), Cabernet Sauvignon (CSA), Pinotage (PTE), and Pinot Noir (PNO); PC 2, from Malbec (MAL) and Arinarnoa (ARI); and PC 3, from Barbera (BAR) and Alfrocheiro (ALF).
–1.0 –1.0
–0.5 –0.5
0.0 0.0
0.5 0.5
1.0 1.0
P
rin
ci
pa
l co
m
po
n
en
t 3 : 14.86%
DEN
VAC K
pH
HUE
ALC DEX
620 420
520 ANT
CIN
Principal component 1 : 39.99% TPF
TPF TACTAC
P
rin
ci
pa
l co
m
po
n
en
t 3 : 14.86%
Principal component 1 : 39.99% 5
4 3 2 1 0 –1 –2 –3
–6 –6
–10 –5
–4 –4
–8 –2 0 2 4 6 8
ALF
FGI CFR
MER CSA CARPER
BAR
PNO PTE REF
TEM TNA
ANC
TERSYR RCA
MAL MARTAN
ARI
potassium (K), density (DEN), dry extract (DEX), and pH (pH), while those from wineries 50 and 1 had lower values (Figure 5). PC 3 shows that wines from wineries 14 and 21 had higher values of titratable acidity (TAC) while those from wineries 35, 37, 47, and 56 had lower ones (Figure 6).
When the general score was added, wineries 2, 28, 32, 34, and 42 had higher scores. This was mainly due to the variables A420 (420) (r = 0.39), A520 (520) (r = 0.35), A620 (620) (r = 0.43), and color intensity (CIN) (r = 0.39) which characterized the (r = –0.66); and for PC 3, alcohol (ALC) (r = 0.86) and titratable
acidity (TAC) (r = –0.61) (Figures 5 and 6).
PC 1 discriminated wineries 34, 28, 2, and 57, which produced wines that were characterized by higher values of the variables related to total phenolic compounds, such as A420 (420), and red pigments, expressed by A520 (520) and A620 (620). On the other hand, wines from wineries 49, 19, 31, 44, and 9 presented lower values of these variables. PC 2 shows that wineries 58, 22, 39, 10, and 36 had wines with higher values of
Figure 6. Projection of variables and wineries on the plane formed by PCs 1 × 3. TAC = Titratable acidity; VAC = Volatile acidity; ALC = Alcohol; pH = pH; DEN = Density; DEX = Dry extract; ANT = Anthocyanins; TPF = Total phenolic compounds; 420 = Absorbancy at 420 nm; 520 = Absorbancy at 520 nm; 620 = Absorbancy at 620 nm; CIN = Color intensity; HUE = Hue; K = Potassium; 1 to 58 = wineries (not specified).
Figure 5. Projection of variables and wineries on the plane formed by PCs 1 × 2. TAC = Titratable acidity; VAC = Volatile acidity; ALC = Alcohol; pH = pH; DEN = Density; DEX = Dry extract; ANT = Anthocyanins; TPF = Total phenolic compounds; 420 = Absorbancy at 420 nm; 520 = Absorbancy at 520 nm; 620 = Absorbancy at 620 nm; CIN = Color intensity; HUE = Hue; K = Potassium; 1 to 58 = wineries (not specified). –1.0 –1.0 –0.5 –0.5 0.0 0.0 0.5 0.5 1.0 1.0 P rin ci pa l co m po n en
t 2 : 19.56%
DEN TAC VAC pH K HUE ALC DEX 620 420 520 TPFANT CIN
Principal component 1 : 32.14%
P rin ci pa l co m po n en
t 2 : 19.56%
Principal component 1 : 32.14% 5 6 4 3 2 1 0 –1 –2 –3 –6 –12 –5 –4 –4
–10 –8 –2 0 2 4 6 8
45 44
6 26 1346 47258
33 5 56 23 27 50 49 1 19 43 31 9 30 10 2 2 28 42 37 34 3 18 12 12 14 7 3548162940 54
32 11
38 21 57
223958 15
52 2436 55 4 17 41535120 –1.0 –1.0 –0.5 –0.5 0.0 0.0 0.5 0.5 1.0 1.0 P rin ci pa l co m po n en
t 3 : 15.23%
DEN TAC VAC pH K HUE ALC DEX 620 420 520 TPF ANT CIN
Principal component 1 : 32.14%
P rin ci pa l co m po n en
t 3 : 15.23%
Principal component 1 : 32.14% 5 6 4 3 2 1 0 –1 –2 –3 –6 –12 –5 –4 –4
–10 –8 –2 0 2 4 6 8
48 28 40 53 26 41
34 13864
31 4920 11 2556 47 43 33 10 50272430
FALCÃO, L. D. et al. Aroma impact components of Brazilian Cabernet Sauvignon wines using detection frequency analysis (GC-olfactometry). Food Chemistry, v. 107, n. 1, p. 497-505, 2008. HAIR Jr., J. F. et al. Multivariate data analysis: with readings. 4 ed.
Upper Saddle River: Prentice Hall, 1995.
JACKSON, D. I.; LOMBARD, P. B. Environmental and management practices affecting grape composition and wine quality: a review.
American Journal of Enology and Viticulture, v. 44, n. 4, p. 409-430, 1993.
KONTKANEN, D. et al. Canadian terroir: sensory characterization of Bordeaux-style red wine varieties in the Niagara Peninsula. Food Research International, v. 38, n. 4, p. 417-425, 2005.
LIU, L. et al. Geographic classification of Spanish and Australian Tempranillo red wines by visible and near-infrared spectroscopy combined with multivariate analysis. Journal of Agricultural and Food Chemistry, v. 54, n. 18, p. 6754-6759, 2006.
LIU, L. et al. Preliminary study on the application of visible-near infrared spectroscopy and chemometrics to classify Riesling wines from different countries. Food Chemistry, v. 106, n. 2, p. 781-786, 2008.
MALUF, J. R. T.; WESTPFALEN, S. L. Regiões agroecológicas do estado do Rio Grande do Sul. Passo Fundo: Embrapa Trigo, 1999. 4 p. (Pesquisa em Andamento Online, 9). Disponível em: <http:// www.cnpt.embrapa.br/biblio/p_pa09.htm>.
MANFROI, L. et al. Composição físico-química do vinho Cabernet Franc proveniente de videiras conduzidas no sistema lira aberta.
Ciência e Tecnologia de Alimentos, v. 26, n. 2, p. 290-296, 2006. MEILGAARD, M.; CIVILLE, G. V.; CARR, B. T. Sensory evaluation
techniques. 3ed. Boca Raton: CRC, 1999.
MENEGUZZO, J. et al. Efeito de Botrytis cinerea na composição do vinho Gewürztraminer. Ciência e Tecnologia de Alimentos, v. 26, n. 3, p. 527-532, 2006.
MIELE, A. Efeito do terroir na composição da uva e do vinho Cabernet Franc da Serra Gaúcha. In: SEMINÁRIO FRANCO-BRASILEIRO DE VITICULTURA, ENOLOGIA E GASTRONOMIA, 1., 1998, Bento Gonçalves. Anais... Bento Gonçalves: Embrapa Uva e Vinho, 1999. p. 27-30.
MIELE, A.; MIOLO, A. O sabor do vinho. Bento Gonçalves: Embrapa Uva e Vinho, 2003.
MIELE, A.; RIZZON, L. A. Efeito de elevadas produtividades do vinhedo nas características físico-químicas e sensoriais do vinho Merlot. Ciência Rural, v. 36, n. 1, p. 271-278, 2006.
MIELE, A. et al. Caracterização do mosto e do vinho Cabernet Franc proveniente de diferentes regiões vitícolas da Serra Gaúcha. In: CONGRESSO BRASILEIRO DE VITICULTURA E ENOLOGIA, 8., 1996, Bento Gonçalves. Anais... Bento Gonçalves:Embrapa Uva e Vinho, 1996. p. 4.
NOBEL, A. C. Impiego dell’analisi del componente principali dei composti volatili del vino nella camera d’aria per la classificazione varietale. Vini d’Italia, v. 23, n. 135, p. 325-340, 1981.
OGRINC, N. et al. Determination of authenticity, regional origin, and vintage of Slovenian wines using a combination of IRMS and SNIF-NMR analyses. Journal of Agricultural and Food Chemistry, v. 49, n. 3, p. 1432-1440, 2001.
PEREIRA, G. E. et al. H-NMR metabolic profiling of wines from three cultivars, three soil types and two contrasting vintages. Journal International des Sciences de la Vigne et du Vin, v. 41, n. 2, p. 103-109, 2007.
PEYNAUD, E. Le goût du vin. Paris: Dunod, 1980. wines produced by these wineries and were responsible for the
wine color and body. However, other variables accounted for this quality, such as alcohol (ALC) (r = 0.38) and dry extract (EXS) (r = 0.34). These results imply that, in general, wineries had similar technologies regarding winemaking. Some of them, however, showed important discrimination in wine composition.
It should be emphasized that this work represents the results of wines made in 2006, from grapes of different regions of the country, each one with their particular soil and climate conditions; grapes produced from vineyards cultivated under many different technologies; and from wineries using different winemaking procedures. In addition, it focused on important but limited number of variables. If others were considered − such as volatile substances, amino acids, minerals −, PCA could reveal other differences related to the discrimination among the viticultural regions, varietal wines, and wineries. Actually, these differences could be even greater. It is also important to consider that discrimination among the a) viticultural regions were established regardless the varietal wines and wineries; b) varietal wines, regardless the viticultural regions and wineries; and c) wineries, regardless the viticultural region and varietal wines.
4 Conclusions
The principal component analysis (PCA) discriminates wines from the 2006 vintage produced in five − of a total of seven − Brazilian viticultural regions, i.e., São Joaquim, Toledo, Vale do São Francisco, Serra do Nordeste B, and Planalto Superior B, however Serra do Nordeste A and Camapanha B are not discriminated. Regarding the varietal wines, PCA discriminates Ancellotta, Teroldego, Egiodola, Refosco, Marselan, Cabernet Sauvignon, Pinotage, Pinot Noir, Malbec, Arinarnoa, Barbera, and Alfrocheiro. Considering the wineries, the majority does not show a discrimination among them, which could indicate the existence of similar technology used in winemaking. Despite of this, twenty two are discriminated as a function of the variables taken into consideration, mainly those related to phenolic compounds and anthocyanins.
References
AMERINE, L. A.; ROESSLER, E. B. Wines:their sensory evaluation. San Francisco: Freeman, 1983.
BEHRENS, J. H.; SILVA, M. A. A. P. Perfil sensorial de vinhos brancos brasileiros através da análise descritiva quantitativa. Ciência e Tecnologia de Alimentos, v. 20, n. 1, p. 60-67, 2000.
BOTELHO, G. et al. Evaluation of two quantitative gas chromatography-olfactometry methods for clonal red wines differentiation. Flavour and Fragrance Journal, v. 22, n. 5, p. 414-420, 2007.
CAMARA, J.; ALVES, M. A.; MARQUES, J. C. Classification of Boal, Malvazia, Sercial and Verdelho wines based on terpenoid patterns.
Food Chemistry, v. 101, n. 2, p. 475-484, 2007.
RIZZON, L. A.; MIELE, A.; ROSIER, J. P. Discrimination of wines from the Mercosul countries according to their mineral composition.
Journal International des Sciences de la Vigne et du Vin, v. 31, n. 1, p. 43-47, 1997.
SETKOVA, L.; RISTICEVIC, S.; PAWLISZYN, J. Rapid head-space solid-phase microextraction-gas chromatographic-time-of-flight mass spectrometric method for quantitative profiling of ice wine volatile fraction: II. Classification of Canadian and Czech ice wines using statistical evaluation of data. Journal of Chromatography, v. 1147, n. 2, p. 224-240, 2007.
SOCIÉTÉ SCIENTIFIQUE D’HYGIÈNE ALIMENTAIRE – SSHA.
Évaluation sensorielle:manuel méthodologique. 2 ed. Paris: Tec & Doc, 1998 (Collection Sciences & Techniques Agroalimentaires). TECCHIO, F. M.; MIELE, A.; RIZZON, L. A. Composição
físico-química do vinho Bordô de Flores da Cunha, RS, elaborado com uvas maturadas em condições de baixa precipitação. Ciência e Tecnologia de Alimentos, v. 37, n. 5, p. 1480-1483, 2007. VILLIERS, A. et al. Classification of South African red and white wines
according to grape variety based on the non-coloured phenolic content. European Food Research and Technology, v. 221, n. 3-4, p. 520-528, 2005.
VIVIANI, A.; MORENO, J.; PEINADO, R. A. Differentiation of young red wines obtained in a warm climate region. International Journal of Food Science and Technology, v. 42, n. 5, p. 523-527, 2007. PICQUE, D. et al. Caractérisation des vins par spectroscopie infrarouge :
classification selon l’année de production et l’origine géographique.
Sciences des Aliments, v. 25, n. 3, p. 207-220, 2005.
RIBÉREAU-GAYON, J. et al. Sciences et techniques du vin. Paris: Dunod, 1976. (v. 1).
RIO GRANDE DO SUL. Secretaria da Agricultura e Abastecimento.
Macrozoneamento agroecológico e econômico do Estado do Rio Grande do Sul. Porto Alegre: CEPA, 1994. (2 v.)
RIZZON, L. A.; MIELE, A. Avaliação da cv. Cabernet Franc para elaboração de vinho tinto. Ciência e Tecnologia de Alimentos, v. 21, n. 2, p. 249-245, 2001.
RIZZON, L. A.; MIELE, A. Avaliação da cv. Cabernet Sauvignon para elaboração de vinho fino. Ciência e Tecnologia de Alimentos, v. 22, n. 2, p. 192-198, 2002.
RIZZON, L. A.; MIELE, A. Avaliação da cv. Isabel para elaboração de vinho tinto. Ciência e Tecnologia de Alimentos, v. 20, n. 1, p. 115-121, 2000.
RIZZON, L. A.; MIELE, A. Avaliação da cv. Merlot para elaboração de vinho fino. Ciência e Tecnologia de Alimentos, v. 23, supl., p. 156-161, 2003.
RIZZON, L. A.; MIELE, A. Avaliação da cv. Tannat para elaboração de vinho fino. Ciência e Tecnologia de Alimentos, v. 24, n. 2, p. 223-229, 2004.