_________________________
1 Extracted from the Master’s Thesis of the first author.
2 Agricultural Eng., M .S., Department of Biosystems Engineering, ESALQ/USP/Piracicaba – SP, Phone: +55 11 984361959, [email protected]
3 Agricultural Eng., Associate Prof., Department of Biosystems Engineering, ESALQ/USP/Piracicaba – SP, [email protected] 4 Agriculture Student, Department of Biosystems Engineering, ESALQ/USP/Piracicaba – SP, [email protected] 5 Statistician, Universidade Estadual Paulista Júlio de Mesquita Filho, UNESP/Tupã – SP, [email protected]
DETERMINATION OF PIGLETS’ RECTAL TEMPERATURE AND RESPIRATORY
RATE THROUGH SKIN SURFACE TEMPERATURE UNDER CLIMATIC CHAMBER CONDITIONS1
Doi:http://dx.doi.org/10.1590/1809-4430-Eng.Agric.v35n6p 979-989/2015
GUSTAVO M. MOSTAÇO2, KÉSIA O. DA S. MIRANDA3, ISABELLA C. F. DA S. CONDOTTA4, DOUGLAS D’ALESSANDRO SALGADO5
ABSTRACT: In animal farming, an automatic and precise control of environmental conditions needs information from variables derived from the animals themselves, i.e. they act as biosensors. Rectal temperature (RT) and respiratory rate (RR) are good indicators of thermoregulation in pigs. Since there is a growing concern on animal welfare, the search for alternatives to measure RT has become even more necessary. This research aimed to identify the most adequate body surface areas, on nursery-phase pigs, to take temperature measurements that best represent the correlation of RT and RR. The main experiment was carried out in a climate chamber with five 30-day-old littermate female Landrace x Large White piglets. Temperature conditions inside chamber were varied from 14 °C up to 35.5 °C. The measurements were taken each 30 minutes, over six different skin regions,
using a temperature data logger Thermochron iButton® - DS1921G (Tb) and an infrared
thermometer (Ti). As shown by the results, the tympanic region is the best one for RT and RR monitoring using an infrared thermometer (TiF). In contrast, when using temperature sensors, the ear (TbE) is preferred to be used for RT predictions and the loin region (TbC) for RR.
KEYWORDS: thermal control; animal welfare; temperature sensors; physiological modelling; precision livestock farming; environmental control for swine
DETERMINAÇÃO DA TEMPERATURA RETAL E FREQUÊNCIA RESPIRATÓRIA DE SUÍNOS EM FASE DE CRECHE POR MEIO DA TEMPERATURA DA SUPERFÍCIE
CORPORAL SOB CONDIÇÕES DE CÂMARA CLIMÁTICA
RESUMO: O controle automático e preciso do ambiente para animais de produção carece de informações e variáveis originadas dos próprios animais, tendo-os como biossensores. A temperatura retal (TR) e a frequência respiratória (FR) são bons indicadores da termorregulação de suínos. Porém, com a crescente preocupação em relação ao bem-estar animal, torna-se necessária a busca por alternativas à mensuração da TR. Com a presente pesquisa, objetivou-se identificar a região mais adequada para a aferição da temperatura da superfície corporal dos suínos, em fase de creche, e que apresentasse a melhor correlação com a TR e a FR. O experimento principal foi conduzido em câmara climática, com cinco leitões da raça Landrace x Large White, com 30 dias de idade, provenientes de uma mesma ninhada e do mesmo sexo (fêmea). As temperaturas ambientes utilizadas variaram de 14 °C a 35,5 °C. Realizaram-se medidas de temperatura repetidas em intervalos de 30 minutos, em seis diferentes regiões corporais, utilizando-se de dois métodos: via
data logger de temperatura Thermochron iButton® - DS1921G (Tb) e via termômetro de
infravermelho (Ti). Por meio dos resultados, foi possível observar que a região timpânica mostrou- -se como a melhor opção para acompanhamento tanto da TR quanto da FR via termômetro de infravermelho (TiF), enquanto que ao utilizar sensores de temperatura da superfície corporal, a melhor opção foi a orelha (TbE) para predição de TR, e a região do lombo (TbC) para predição de FR.
INTRODUCTION
Thermal environment is a key point in animal husbandry and, in several cases, becomes the main reason of a poor herd development. Therefore, new researches have been proposed to measure how much this factor affects animal performance.
As an aggravating factor, the heat loss in swine by perspiration are minimal, since their sweating glands are keratinized, which reduces transpiration rates and little contributes to thermoregulation (ROBINSON, 2008). Thus, thermal environment stands out as an important player in terms of animal welfare.
Precision Livestock Farming uses technological tools like sensors and tracking systems to monitor and control facilities in a fast, efficient and safe way. The animals act as biosensors once most of the important signs are provided by themselves, and such data has to be measured directly and continuously (GREEN et al., 2008; BROWN-BRANDL et al., 2003).
Rectal temperature (RT) is taken as a measure of internal body temperature, and may be used as thermal comfort or stress index for animals, or even as a disease indicator (BROWN-BRANDL et al., 2003). Non-invasive and easy-application measurement techniques are required to associate livestock animal thermal state evaluation to welfare principles, both for scientific research and commercial production. In other way, there is a certain difficulty to obtain respiratory rate (RR) data on a large scale as well as in real time.
Among the approaches to measure animal temperature, skin surface is shown as a non-invasive method, and thus regarding animal welfare precepts. Infrared temperature sensors cause less animal discomfort, but in most of the cases, they cannot provide a continuous measurement. In contrast, contact sensors seem to be a better option for accurate and continuous monitoring of animal’s thermal state. However, this type of sensors undergo further challenges as adverse conditions, battery recharge time and long-term adhesion on animal skin, as well as the lack of studies on the validation of the iButton and its application on farm animals, which might hamper comparisons results from different studies.
Thereby, the objective with this research was to identify most suitable body regions to take skin surface temperature of piglets, and then seek for the best representation of RT and RR, by means of correlations and multiple linear regressions, which will further assist decision-making and environment control automation of animal-raising facilities.
MATERIAL AND METHODS Facilities and animal characteristics
The main experiment was performed under methodology approved by the Ethics Committee on Animal Use of the CEUA/ ESALQ.
Five 30-year-old littermate female piglets, Landrace x Large White breed, were randomized
in individual pens made of wood and chicken-wire netting, housed in a density of 0.80 m2.animal-1.
FIGURE 1. Animal housing inside the climate chamber.
The animals remained at comfort temperature of 24.5°C (MOSTAÇO, 2014; MANNO et al., 2005; KIEFER et al, 2009; HANNAS, 1999) during all the non-experimental period. They were fed with pig chow proper to growth stage and ad libitum water intake during the entire experiment
period (10 days). Animals were maintained three days after arrival under thermal comfort for adaptation to the new environment.
Statistical experime ntal design
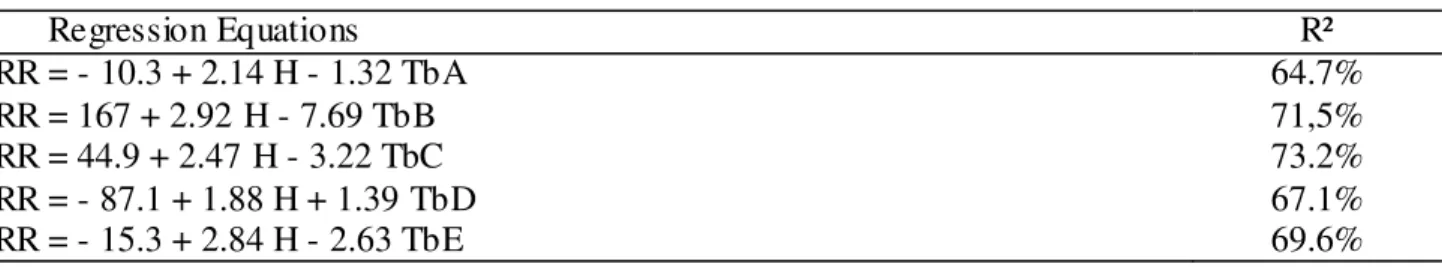
The completely randomized design was adopted with a single factor, environment enthalpy, with seven levels, and its distribution over time are shown in Table 1. Those values were set to attain cold and heat stressful conditions (MOSTAÇO, 2014; MANNO et al., 2005; KIEFER et al, 2009; HANNAS, 1999), and calculated according to equation (1) using temperatures of Table 1 and an air relative humidity of 85%, which was found inside the chamber for all temperatures. Moreover, we performed repeated measurements throughout the time, with five repetitions per variable and environment temperature.
TABLE 1. Distribution of enthalpy and temperature levels among the experiment stages.
Stages Duration (days) (kJ kgEnthalpy levels -1 of dry air) Temperature levels (°C)
1 – Comfort 3 59.24 24.5
2 – Heat stress 1 74.82 - 82.96 - 94.26 29.5 - 32.5 - 35.5
3 – Comfort 5 59.24 24,5
4 – Cold stress 1 51.12 - 39.56 - 31.26 21.5 - 17.5 - 14
Environment conditions and measure ment methodology
Initially, chamber remained for 15 minutes up to air temperature and relative humidity stabilization at the desired set point. Then, animals were kept one hour for acclimation (based on a pre-experimental phase). After this period, measurement cycles were started and repeated every 30 minutes. The evaluations were composed by direct count of RR, RT and surface temperature measurement. Starting by RR measurements once it would present affected values derived from animal excitement caused by handling and proximity.
Animals were left for a five-day period under thermal comfort situation between cold and heat stress periods to prevent bias among treatments.
(1) where,
h = enthalpy (kJ kg-1 of dry air); Ts = dry bulb temperature (°C); RH = air relative humidity (%);
ρB = barometric pressure (mm Hg)
Assessed Variables
The following variables were assessed: rectal temperature (RT), respiratory rate (RR), skin surface temperature via iButton contact sensor (Tb) and infrared thermometer (Ti), as well as environment enthalpy (h).
Surface external temperatures were taken by contact sensor and infrared thermometer at five different body surface regions (Figure 2), which were: (A) Head, (B) Shoulder, (C) Loin, (D) Ham and (E) Ear (inner part of the external ear cartilage), apart from (F) Tympanic region, monitored using an ear infrared thermometer.
FIGURE 2. Skin surface regions assessed in piglets: head (A), shoulder (B), loin (C), ham (D), ear (E), and tympanic (F).
The exanimated skin areas were shaved prior to measurements to avoid thermal resistance and inertia caused by animal hairs, once such impacts were not targeted in this study; however, they should be addressed for future experiments.
Equipment and installation
Two remote data loggers (Hobo® Model U10-003, Onset Computer Corporation, MA) were
used to record air temperature and relative humidity inside chambers. The equipment were installed at opposite sides of the chamber and air relative humidity was kept around 85%.
We used a digital clinical thermometer to take RT measurements, while RR measurements were obtained by direct observations of respiratory movements within 15 seconds.
Skin-surface temperature was measured using DS1921G Thermochron iButton® dataloggers
(DS1921G-F5 Maxim Integrated Products, Dallas Semiconductor Inc., Sunnyvale, California) fixed by TransporeT M tape (surgical tape). These measurements were also carried using an infrared
Fluke® thermometer model 566 with adjustable emissivity, adopting the value of 0.98 as
recommended by manufacturer for biological tissue measurements. Figure 3 shows sensors installed
FIGURE 3. Thermochron iButton sensors installed on the skin surface of the animals.
For measurements using an infrared thermometer, we positioned the equipment
perpendicularly and kept it 30 cm away from the animal’s skin. Figure 4a shows the measurement
procedure of skin temperature made on the loin region of an animal from Pen #5.
For tympanic region, a forehead and infrared thermometer (G-Tech T1000) was used during all the experiment. These records were taken together with the other infrared temperatures, following the aforementioned schedule. Figure 4b shows the measurement procedure of skin temperature made on the tympanic region.
(a) (b)
FIGURE 4. (a) Surface temperature measurement using an infrared thermometer FLUKE 566 and (b) tympanic temperature measurement with an infrared thermometer G-Tech.
Data analysis methodology
After gathering the temperature records, the data were downloaded into a computer for
subsequent format and analysis, using Microsoft Excel® and Minitab®16 software.
First, we performed exploratory and principal component analyses assisted by Minitab software (Version 16). In the analyses, we included the following variables: enthalpy (H), rectal temperature (RT), respiratory rate (RR), skin surface temperature via infrared thermometer (Tin)
and skin surface temperature via iButton (Tbn) (wherein: n={A, B, C, D, E}), as well as tympanic
temperature through infrared thermometer (TiF).
describe and understand structure correlations. This analysis aimed to reduce from 14 studied variables to two completely independent principal components and further explain their relationship.
Hereupon, we performed multiple regressions using the same software, setting determination coefficients (R2), which were calculated taking RT and RR as dependent variables, and Ti, Tb and H as independent ones.
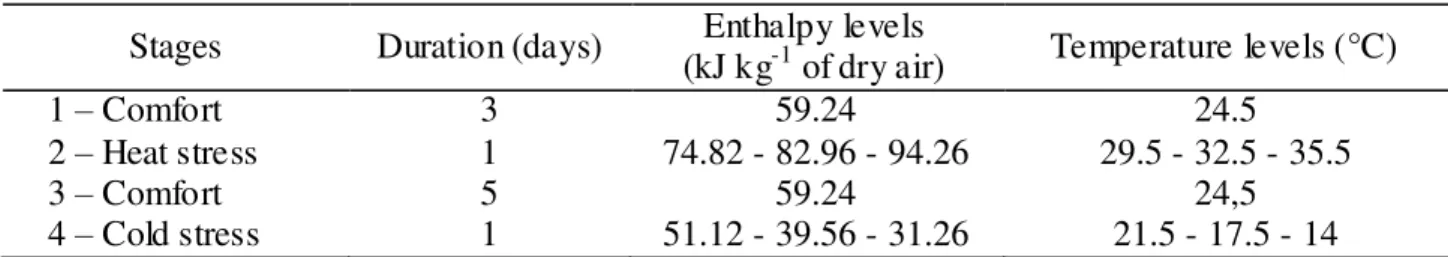
RESULTS AND DISCUSSION Principal component analysis
Principal component analysis results (Figure 5) show a higher correlation between skin temperature and air enthalpy, aside from a lower correlation between the same variables and RT. It was possible to note that these variables (skin surface temperature and air enthalpy) have small variation compared to the first principal component, i.e. the horizontal axis. Therefore, we can infer that this component is most influenced by the environment than by the animal. Yet the RT measurement has a higher inclination from the first component towards the second component, indicating that the latter would rather be related to the animal and its thermoregulatory mechanisms for internal temperature control.
FIGURE 5. Distribution of the first two principal components according to the 14 studied variables.
The respiratory rate position (RR) in contrast to the other variables was an important discovery made with the support of principal component analysis. The RR has an intermediate inclination compared with RT and the other variables (skin temperature and air enthalpy); thus, the use of correlations and models in which RR is treated as a dependent parameter is more appropriate rather than RT. Such fact comes from a larger percent variation of RR, even at temperatures slightly higher than thermal comfort limits, exceeding normal levels. It shows that, at this point, animals have already triggered thermoregulatory mechanisms for internal temperature maintenance.
Number of Components 1 2 3 4 5 6 7 8 9
Eigenvalue 11.437 1.000 0.292 0.260 0.211 0.165 0.146 0.122 0.080
Proportion 0.817 0.071 0.021 0.019 0.015 0.012 0.010 0.009 0.006
Cumulative 0.817 0.888 0.909 0.928 0.943 0.955 0.965 0.974 0.980
Number of Components 10 11 12 13 14
Eigenvalue 0.070 0.064 0.057 0.051 0.045
Proportion 0.005 0.005 0.004 0.004 0.003
Cumulative 0.984 0.989 0.993 0.997 1.000
Multiple regression analysis
Bearing in mind the original goals of this research, data were modeled using multiple regression. Thus, regression equations were calculated using RT as a dependent variable and as independent ones the surface temperature taken by infrared and iButton (Ti and Tb) as well as enthalpy (H). The latter was used since it brings a significant gain of information to the regressions, besides of easy acquisition in field conditions or under automated system for environmental control, by measuring air temperature and relative humidity.
Regressions and respective determination coefficients (R2) were independently achieved for each studied skin surface region and equipment. Table 3 presents the multiple regression equations for RT regarding temperature measured via infrared thermometer (Ti), in °C, and environmental air enthalpy (H), in kJ.kg of dry air-1.
TABLE 3. Multiple regression equations for RT in terms of Ti and H.
Regression Equations R²
RT = 38.6 + 0.0163 H - 0.0058 TiA 34.3%
RT = 38.9 + 0.0174 H - 0.0166 TiB 34.4%
RT = 38.5 + 0.0163 H - 0.0026 TiC 35.5%
RT = 38.0 + 0.0148 H + 0.0126 TiD 37.9%
RT = 38.6 + 0.0179 H - 0.0108 TiE 35.3%
RT = 41.6 + 0.0213 H - 0.0941 TiF 39.6%
The best fit was found for tympanic temperature via infrared thermometer (TiF) (39.6%), followed by ham (TiD), while the lowest coefficients were found in head and shoulder regions (TiA and TiB) (34.3 and 34.4%). This result might be because the animals use those regions to find high heat transfer surfaces, which might have influenced the obtained temperatures. Differently, the tympanic and ham regions showed to have less influence from animal behavior.
Table 4 shows the multiple regression equations and respective determination coefficients
(R2) for RT according to temperature variation measured via iButton (Tb), in °C, and environmental
air enthalpy.
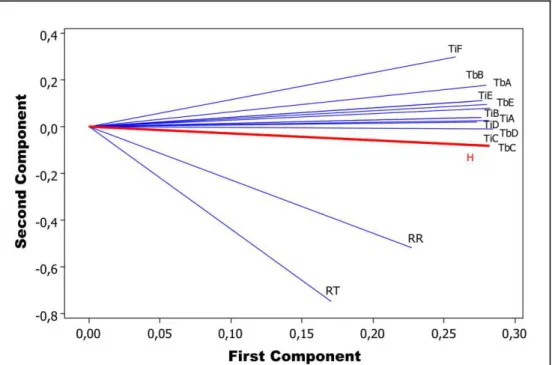
TABLE 4. Multiple regression equations for RT in terms of Tb and H.
Regression Equations R²
RT = 37.9 + 0.0121 H + 0.0199 TbA 29.8%
RT = 39.7 + 0.0207 H - 0.0452 TbB 35.2%
RT = 34.6 + 0.00434 H + 0.128 TbC 36.0%
RT = 36.9 + 0.0106 H + 0.0516 TbD 36.3%
For measurements using iButton, the best fit was observed on ear region (TbE) (38.5%), while the lowest coefficient was found on head (TbA) (29.8%). As well as on infrared method, these results come from the use of the head and limbs by animals to find areas most suitable for heat loss; however, the ear region has a smaller variation due to its protection against environmental effects.
Concerning measurement methods (infrared versus iButton), for RT prediction, different behaviors were observed in which the regression involving temperatures measured via iButton were better than those obtained via infrared thermometer in three of the five regions.
The best fits were obtained for tympanic temperature using infrared thermometer (TiF) and ear region through iButton (TbE), corroborating with results of ANDERSEN et al. (2008). This is probably because of a minor susceptibility of the tympanic region to environmental effects and also because iButton isolates the ear region from external effects.
Taking respiratory rate (RR) as dependent variable, as well as using surface temperature via infrared and iButton (Ti and Tb) and enthalpy (H) as independent ones, resulted in better fittings to the models and enabled comparison among all the obtained results.
Table 5 displays the multiple regression equations and respective determination coefficients (R2) for RR according to temperature measured via infrared thermometer and environmental air enthalpy.
TABLE 5. Multiple regression equations for RR in terms of Ti and H.
Regression Equations R²
RR = 27.9 + 2.46 H - 3.00 TiA 68.4%
RR = 146 + 2.73 H - 6.78 TiB 69.7%
RR = 145 + 2.58 H - 6.37 TiC 69.5%
RR = 53.6 + 2.46 H - 3.65 TiD 69.2%
RR = 0.2 + 2.46 H - 2.22 TiE 69.1%
RR = 297 + 2.62 H - 10.1 TiF 73.7%
The temperature measured in the tympanic region using infrared thermometer (TiF) (73.7%) had the best fit. Yet the head region (TIA) (68.4%) had the worst fit. This is the same behavior as
observed in RT regressions, though with higher R2 values.
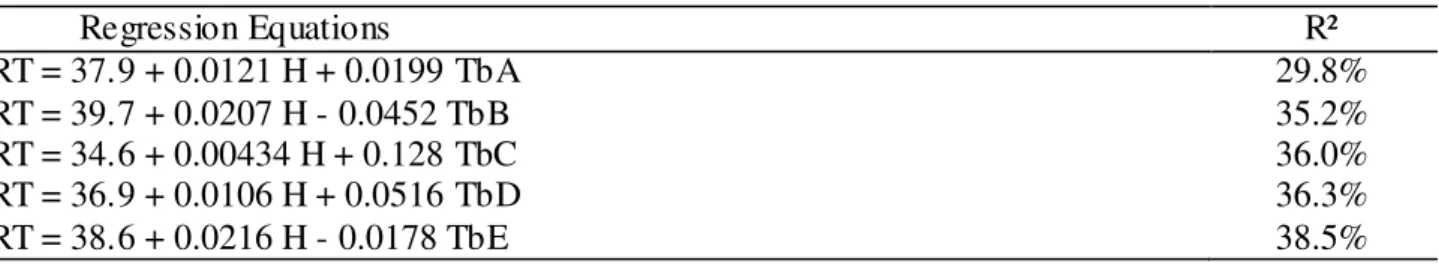
Table 6 shows the multiple regression equations for RR with their respective coefficients R2 in terms of temperature measured via iButton (Tb) and air enthalpy.
TABLE 6. Multiple regression equations for RR in terms of Tb and H.
Regression Equations R²
RR = - 10.3 + 2.14 H - 1.32 TbA 64.7%
RR = 167 + 2.92 H - 7.69 TbB 71,5%
RR = 44.9 + 2.47 H - 3.22 TbC 73.2%
RR = - 87.1 + 1.88 H + 1.39 TbD 67.1%
RR = - 15.3 + 2.84 H - 2.63 TbE 69.6%
than those for predicting RT, according to principal component analysis.
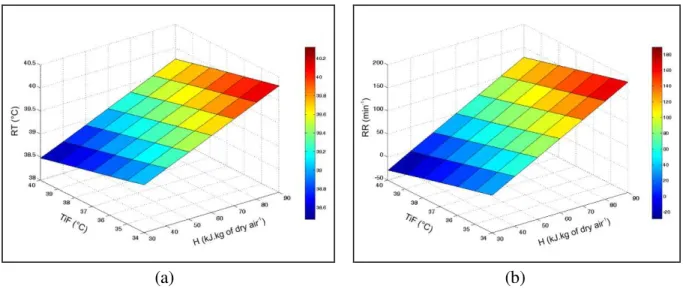
For a better visualization of the results gathered in this phase, Figure 7 displays graphs for RT and RR variations according to enthalpy, together with results from multiple regression equations for TiF, which presented better R2 fit in both cases. The response-surface graphs were also created with the same variables via MATLAB® R2013a software (Figure 8).
(a) (b)
FIGURE 7. Dispersion between (a) RT and H and (b) RR and H, with respective regressions for TiF.
(a) (b)
FIGURE 8. Response-surface graphs for (a) RT and (b) RR, both in terms of TiF and H.
Predicted values, using the multiple regression equation for TiF, as shown by the graphs of Figure 7, were situated always inside the real observed RT and RR range, showing the consistency and accuracy of predicted values. We can notice on Figure 7a that RT has a low variation throughout the different thermal situations (~3%), while RR showed variations in the order of 300% (Figure 7b).
It is noteworthy to identify a turning point in the curve for RR in terms of air enthalpy (Figure
7b), based on average and variance changes that occur starting from 59.24 kJ.kg of dry air-1. Such
point can be described as the entrance into a heat thermal discomfort condition, which triggers thermoregulatory mechanisms in the animal. This can be evidenced by the color change on the surface of RR response observed in Figure 8.
important factor to consider is sensors’ installation and maintenance feasibility in field conditions, or even infrared thermometer measuring, depending on the region, as the best options for
monitoring animal’s thermal conditions.
In this sense, the body region in piglets that best resembles rectal temperature and respiratory rate, using infrared thermometer is the tympanic region (TiF). In contrast, using skin surface sensors, the best option is the ear (TbE) for rectal temperature prediction, and the loin region (TbC) for respiratory rate.
The results obtained from the different analyses show a possible use of RR values as tool to relate skin surface temperature and RT, leading to models of chain functions. As future
development of this research, we should implement fuzzy logic algorithms for animal’s thermal
comfort determination, as some authors had already done for different growth stages and animal species (TOLON et al., 2010; NASCIMENTO et al., 2011; YANAGI JUNIOR et al., 2012; PANDORFI et al., 2007).
Based on experimentation and data analysis developed here to study the physiological relationships between internal and external temperatures of pigs, further researches can be carried with some adaptations regarding animal age, genetics and production systems. Furthermore, our research will enable the creation of database records that covers the entire lifecycle of livestock animals, which help automate the entire process. Besides of serving as basis for future researches on environmental control of facilities, development of contact sensors and measurement techniques, as well as maintaining a continuous monitoring of physiologic variables in pigs.
CONCLUSIONS
Given the results, we can conclude that:
a) It was possible to correlate skin surface temperature with rectal temperature and
respiratory rate aside from proposing linear multiple regression models to obtain them from both skin surface temperature and environmental air enthalpy;
b) The tympanic region (TiF) of piglets proved to be the best option for monitoring both
rectal temperature and respiratory rate via infrared thermometer measurement, since such area is less susceptible to environmental effects, has a most practical measurement and due to the possibility of installing a resident sensor; and
c) The ear region (TbE) is the best choice when using a skin-surface contact sensor to predict rectal temperature, which may be because iButton technique isolates the area from environmental effects. While the loin region (TbC) was the best option to predict respiratory rate because this region has less environmental influence, owning to restricted access, less contact with wet or high heat transfer surfaces and less influence
from animal’s movements.
ACKNOWLEDGEMENTS
The authors want to thank the São Paulo Research Foundation – FAPESP, Coordination for
the Improvement of Higher Education Personnel – CAPES and The National Council for Scientific
and Technological Development – CNPq for the financial support to this research.
REFERENCES
ANDERSEN, H.M.; JØRGENSEN, E.; DYBKJÆR, L.; JØRGENSEN, B. The ear skin temperature
as an indicator of the thermal comfort of pigs. Applied Animal Behaviour Science, Amsterdam, n.
ROSS, G.S. A new telemetry system for measuring core body temperature in livestock and poultry.
Applied Engineering in Agriculture, St. Joseph, v. 19, n. 5, p. 583-589, 2003.
GREEN, A.R.; GATES, R.S.; LAWRENCE, L.M.; WHEELER, E. F. Continuous recording
reliability analysis of three monitoring systems for horse monitoring temperature. Computers and
Electronics in Agriculture, Davis, v. 61, p. 88-95, 2008.
HANNAS, M.I. Aspectos fisiológicos e a produção de suínos em clima quente. In: SILVA,
I.J.(Ed.). Ambiência e qualidade na produção industrial de suínos. Piracicaba : FEALQ, 1999.
cap. 1, p. 1-33.
KIEFER, C.; MEIGNEN, B.C.G.; SANCHES, J.F.; CARRIJO, A.S. Resposta de suínos em
crescimento mantidos em diferentes temperaturas. Archivos de Zootecnia, v.58, n.221, p. 55-64.
2009.
MANNO, M.C.; OLIVEIRA, R.F.M. de; DONZELE, J.L.; FERREIRA, A.S.; OLIVEIRA, W.P. de; LIMA, K.R.S.; VAZ, R.G.M.V. Efeitos da temperatura ambiente sobre o desempenho de suínos dos
15 aos 30 kg. Revista Brasileira de Zootecnia, v.34, n.6, p.1963-1970, 2005.
MOSTAÇO, G.M. Determinação da te mperatura retal e frequência respiratória de suínos em
fase de creche por meio da te mperatura da superfície corporal e m câmara climática. 2014.
111p. Thesis (Master’s degree in Agricultural Systems Engineering) – “Luiz de Queiroz” School of
Agriculture, University of São Paulo, Piracicaba, 2014.
NASCIMENTO, G.R.; PEREIRA, D.F.; NÄÄS, I.A.; RODRIGUES, L.H.A. Índice fuzzy de
conforto térmico para frangos de corte. Engenharia Agrícola, Jaboticabal, v.31, n.2, p.219-229,
2011.
PANDORFI, H.; SILVA, I.J.O.; GUISELINI, C.; PIEDADE, S.M.S. Uso da lógica fuzzy na
caracterização do ambiente produtivo para matrizes gestantes. Engenharia Agrícola, Jaboticabal,
v.27, n.1, p.83-92, 2007.
ROBINSON, N.E. Termorregulação. In: CUNNINGHAM, J.G. (Ed.). Tratado de fisiologia
veterinária. Tradução de Aldacilene Souza da Silva et al. 4. ed. Rio de Janeiro: Elsevier, 2008. cap. 53, p. 647-658.
TOLON, Y.B.; BARACHO, M.S.; NÄÄS, I.A.; ROJAS, M.; MOURA, D.J. Ambiências térmica,
aérea e acústica para reprodutores suínos. Engenharia Agrícola, Jaboticabal, v.30, n.1, p.1-13,
2010.
YANAGI JÚNIOR, T.; SCHIASSI, L.; ABREU, L.H.P.; BARBOSA, J.A.; CAMPOS, A.T.
Procedimento fuzzy aplicado à avaliação da insalubridade em atividades agrícolas.Engenharia