Revista Brasileira de
Engenharia Agrícola e Ambiental
Campina Grande, PB, UAEA/UFCG – http://www.agriambi.com.br
v.20, n.7, p.630-636, 2016
Accumulation of macronutrients in different parts
of sunflower fertilized with cassava wastewater
Mara S. M. Dantas
1, Mario M. Rolim
1, Elvira M. R. Pedrosa
1,
Egídio Bezerra Neto
2, Gerônimo F. da Silva
1& Ênio F. de F. e Silva
1DOI: http://dx.doi.org/10.1590/1807-1929/agriambi.v20n7p630-636
A B S T R A C T
The utilization of organic wastes in agriculture is an alternative that can reduce the amounts of mineral fertilizers applied to the soil. The aim of this study was to evaluate the accumulation of macronutrients in sunflower cv. ‘Hélio 250’ fertilized with cassava wastewater. The experiment was conducted in randomized block design, with six treatments (0; 8.5; 17; 34; 68 and 136 m3 ha-1 of cassava wastewater) and four replications. The accumulation of nitrogen (N), phosphorus (P), potassium (K), calcium (Ca), magnesium (Mg) and sulfur (S) were evaluated in leaves, stem, capitulum and achenes. The cassava wastewater dose of 136 m3 ha-1 promoted the greatest accumulation of all evaluated nutrients. The pattern of macronutrients accumulation occurred in the following order: leaves - Ca > K > N > Mg > S > P; stem - K > Ca > Mg > N > P > S; capitulum - N > K > P > Mg > Ca > S; and achenes - N > P > K > Mg > S > Ca. The extraction of nutrients by whole sunflower plants occurred in the following order: N > K > Ca > Mg > P > S. Cassava wastewater provided appropriate concentrations of N, P, K, Ca, Mg and S; therefore, it has potential as an organic fertilizer for the studied sunflower cultivar.
Acúmulo de macronutrientes em distintas partes
de girassol adubado com manipueira
R E S U M O
A utilização de resíduos orgânicos em cultivos é uma alternativa capaz de reduzir quantidades de adubos minerais aplicados ao solo. Objetivou-se, com este trabalho, avaliar o acúmulo de macronutrientes na cultura do girassol cultivar Hélio 250 adubado com manipueira. O delineamento experimental foi em blocos ao acaso, com seis tratamentos (0; 8,5; 17; 34; 68 e 136 m3 ha-1 de manipueira) em quatro repetições. Foram avaliados os acúmulos de nitrogênio (N), fósforo (P), potássio (K), cálcio (Ca), magnésio (Mg) e enxofre (S) nas folhas, caules, capítulos e aquênios. A dose de 136 m3 ha-1 de manipueira foi a que proporcionou o maior acúmulo para todos os nutrientes avaliados. O acúmulo dos macronutrientes ocorre na seguinte ordem por órgão: folhas Ca > K > N > Mg > S > P; caule K > Ca > Mg > N > P > S; capítulos N > K > P > Mg > Ca > S; aquênios N > P > K > Mg > S > Ca. A ordem de acumulação dos nutrientes pelas plantas inteiras de girassol é: N > K > Ca > Mg > P > S. A manipueira, por ter fornecido concentrações suficientes de N, P, K, Ca, Mg e S, apresenta potencial, como fertilizante orgânico para a cultivar estudada do girassol.
Key words: Helianthus annuus
nutrition fertilization residue
Manihot esculenta
Palavras-chave: Helianthus annuus
nutrição adubação resíduo
Manihot esculenta
1 Universidade Federal Rural de Pernambuco/Departamento de Engenharia Agrícola. Recife, PE. E-mail: [email protected]; [email protected]
(Corresponding author); [email protected]; [email protected]; [email protected]
2 Universidade Federal Rural de Pernambuco/Departamento de Química. Recife, PE. E-mail: [email protected]
Introduction
Cassava wastewater, a residue generated in the processing of cassava to make flour, has chemical composition with great potential to be used as a fertilizer, for its high contents of N (3064.0 mg L-1), P (312.0 mg L-1), K (3200.0 mg L-1), Ca (241.9
mg L-1) and Mg (1588.2 mg L-1) (Dantas et al., 2015) and lower
contents of micronutrients. Thus, its utilization as organic fertilizer turns the residue into a low-cost profitable product, reducing environmental impacts and increasing crop yield (Cardoso et al., 2009).
Crop management using agro-industrial residues has proven to be a sustainable alternative from the social, environmental and economic perspective, since these residues have in their composition large amounts of nutrients, which, when incorporated to the soil, can increase agricultural yield through the improvement in soil fertility (Modesto et al., 2009).
Therefore, evaluations of chemical composition and accumulation of nutrients in the various plant organs provide important information for the understanding on the nutritional demands of the crops, since such information can be later used as a reference to calculate the dose of nutrients to be supplied to plants through fertilization (Laviola & Dias, 2008).
Among the studied alternatives for cassava wastewater, its use as a fertilizer becomes an economically viable option for farmers, generating increase in crop yield and economy with mineral fertilizers. Studies have demonstrated the beneficial effects of cassava wastewater when used in agriculture as a fertilizer on the development and yield of crops, as reported by Cardoso et al. (2009), Cabral et al. (2010), Santos et al. (2010), Araújo et al. (2012) and Duarte et al. (2012).
Given the above, this study aimed to evaluate the accumulation of macronutrients in sunflower, cv. ‘Hélio 250’, fertilized with cassava wastewater.
Material and Methods
The experiment was carried out from October 2012 to January 2013 in the municipality of Vitória de Santo Antão-PE, Brazil (8º 8’ 0” S; 35º 22’ 0” W). The climate in the region is C1S2 A’ a’, according to Köppen’s classification. The soil in the area is a dystrophic Red Yellow Latosol and its physical and chemical characteristics, in the layer of 0-0.4 m, are shown in Table 1.
The experimental design was randomized blocks, with six treatments represented by six doses of cassava wastewater (0, 8.5, 17, 34, 68 and 136 m3 ha-1) and four replicates. The applied
doses of cassava wastewater corresponded to 0, 25, 50, 100, 200 and 400 kg ha-1 of potassium (K), respectively.
The recommended dose to be applied in the soil was calculated based on the K content of the residue, since it is the element in highest concentration in its composition, following the recommendation of Ribeiro et al. (1999), considering the dose of 8.5 m3 ha-1 as the amount of K required by the crop
under the local conditions, which corresponds to 25 kg ha-1 of
K. The other doses were calculated based on the recommended dose, through its multiplication by two, four, eight and sixteen.
Each experimental unit consisted of four 6-m-long rows at spacing of 1.0 between rows and 0.20 m between plants, in a total of 120 plants per plot, which is equivalent to a density of 50,000 plants ha-1. The evaluated area of each plot (10.4 m2)
corresponded to 52 plants located in the two central rows. For this, two plants were disregarded at each end during the harvest.
The physico-chemical composition of the cassava wastewater was determined using the methodology of APHA (1995) and the results are shown in Table 2.
Soil preparation consisted of plowing, harrowing and furrowing in rows spaced by 1.0 m at the depth of 0.30 m. Irrigation was performed using a 16-mm flexible drip tape, with emitters spaced by 0.2 m and flow rate of 1.0 L h-1. Irrigation
depths were determined based on crop evapotranspiration (ETc), while reference evapotranspiration (ETo) was estimated through the Hargreaves-Samani method, using the crop coefficients (Kc) recommended for sunflower. During all the cycle, an irrigation depth of 357 mm was applied.
Cassava wastewater doses were applied at once in 0.08-m-deep furrows, 15 days before planting. The sunflower cultivar ‘Hélio 250’ was used in the experiment and sowing was performed directly at the field, by placing five seeds in each hole and leaving one plant per hole after thinning. Harvest was performed 90 days after sowing (DAS), when all sunflower capitula were facing down.
For the analysis of concentration of nutrients, two plants were sampled in each plot, 90 DAS. The plants were cut close to the soil surface and divided into leaves, stem, capitulum and achenes. After that, they were placed in paper bags and dried in a forced-air oven at 65 ºC. P, K, Ca, Mg and S were determined through nitric-perchloric aid digestion and N through sulfuric acid digestion (Bezerra Neto & Barreto, 2011). The accumulation of nutrients was determined through the multiplication of the concentration of the nutrient by the dry mass corresponding to each plant part.
The data were subjected to analysis of variance by F test (p ≤ 0.05). When significant effect was observed,
*Chemical oxygen demand COD*
mg L-1
EC
dS m-1 pH
N P K+ Ca2+ Mg2+ Na+ SO42- Cl
-mg L-1
66.62 7.27 6.60 3.064.0 312.0 3.200.0 241.9 1.588.2 390.0 2.205.0 795.0
Table 2.Characterization of physico-chemical parameters of cassava wastewater
*Electrical conductivity; *Organic carbon
Sand Silt Clay pH
(1:2.5 H2O)
EC*
dS m-1
P mg dm-3
K+ Ca2+ Mg2+ Na+ Al3+ H++Al3+ OC*
g kg-1
g kg-1 cmol
cdm-3
578 122 300 6.60 0.55 7.47 0.45 2.7 2.8 0.27 0.00 2.93 28
regression analyses were performed and significant (p ≤ 0.05) mathematical models were selected based on the highest coefficient of determination.
Results and Discussion
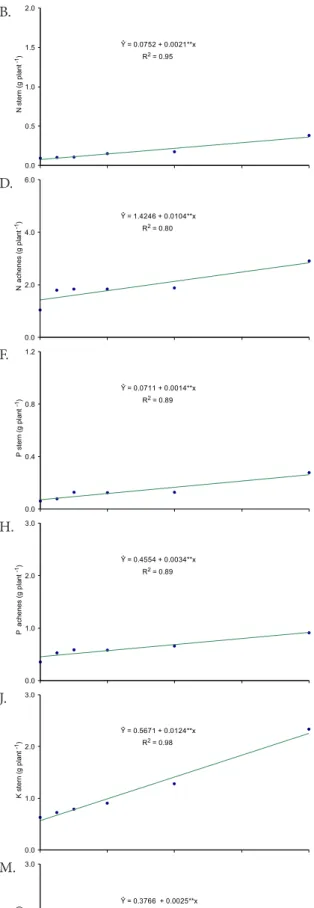
N accumulation in sunflower leaves, stem, capitulum and achenes increased linearly as a function of the applied doses of cassava wastewater (Figures 1A, B, C and D).
In the absence of cassava wastewater (dose of 0 m3 ha-1),
the leaves accumulated 0.248 g plant-1 and, at the highest dose
(136 m3 ha-1), the accumulation was equal to 1.349 g plant-1,
which is equivalent to an increment of 442% in N availability. Data are consistent with Fia et al. (2006), who evaluated the yield and concentration of nutrients of maize fertilized with increasing doses of sewage sludge and observed that N concentrations increased with the increment in the dose of the residue applied to the soil.
As to N accumulation in the sunflower stem, the maximum and minimum values estimated by the regression equations were 0.075 and 0.362 g plant-1, obtained at the cassava
wastewater doses of 0 and 136 m3 ha-1, respectively. In the
capitulum, N accumulation showed similar trend to that in the stem, accumulating 0.799 g plant-1 at the dose of 0 m3 ha-1 and
4.073 g plant-1 at the dose of 136 m3 ha-1, which corresponded
to an increment of 410%. In the achenes, N accumulation was 1.425 g plant-1 at the dose of 0 m3 ha-1 and 2.844 g plant-1
at the dose of 136 m3 ha-1, corresponding to an increment of
100%. Similar results were reported by Lobo et al. (2013), who observed linear increase in N concentration in sunflower achenes as the applied N doses increased.
In the whole plant, the highest N accumulations at each dose and the sum of leaves, stem, capitulum and achenes were 2.547, 2.926, 3.306, 4.066, 5.585 and 8.624 g plant-1, for the
doses of 0, 8.5, 17, 34, 68 and 136 m3 ha-1, respectively, which
corresponded to extractions of 127, 146, 165, 203, 279 and 431 kg ha-1 of N. In sunflower organs, N extraction sequence was the
following: capitulum > achenes > leaves > stem. Comparatively, N extraction values surpassed those found by Zobiole et al. (2010), who observed maximum N accumulation, considering the sum of leaves, petioles, stem, capitulum and achenes, of 3.751 g plant-1, at 85 days, corresponding to the extraction of
150 kg ha-1 of N. N contents determined in the leaves indicate
sufficient levels to plants, because they did not show symptoms of deficiency.
A similar response to that of N was observed for P accumulation in leaves, stem, capitulum and achenes of sunflower plants at the end of the crop cycle (Figures 1E, 1F, 1G and 1H). In the leaves, P accumulations of 0.051 and 0.237 g plant-1 were observed at the cassava wastewater doses
of 0 and 136 m3 ha-1. P accumulation in the stem showed the
same tendency, with 0.0711 and 0.264 g plant-1 for the doses
of 0 and 136 m3 ha-1, respectively. Likewise, P accumulation
in the capitulum was equal to 0.289 g plant-1 in the absence of
cassava wastewater (0 m3 ha-1) and to 1.4189 g plant-1 at the
highest dose (136 m3 ha-1), which represented an increase of
390.3%. The same tendency occurred for P accumulation in the achenes, equal to 0.455 g plant-1 at the dose of 0 m3 ha-1
and 0.958 g plant-1 at the dose of 136 m3 ha-1.
The total P accumulations considering the sum of leaves, stem, capitulum and achenes were 0.867, 0.990, 1.113, 1.359, 1.851 and 2.878 g plant-1 for the doses of 0, 8.5, 17, 34, 68 and
136 m3 ha-1, respectively, which were equivalent to extractions
of 49.5, 55.7, 67.9, 92.5 and 143.9 kg ha-1 of P. These results differ
from those reported by Zobiole et al. (2010), who observed maximum P accumulation of 0.605 g plant-1, considering
the sum of leaves, petioles, stem, capitulum and achenes, corresponding to an extraction of 24 kg ha-1 of P, which
remained below the results found in the present study. The order of P extraction by the organs was: capitulum > achenes > stem > leaves.
The K contents accumulated in the whole sunflower plant increased linearly at rates of 0.087, 0.0124, 0.01 and 0.0025 g plant-1, as a function of the increment in the applied doses of
cassava wastewater (Figures 1I, 1J, 1L and 1M). The highest K accumulation in the leaves was equal to 1.522 g plant-1 at
the dose of 136 m3 ha-1, while the lowest was 0.334 g plant-1,
at the dose of 0 m3 ha-1. As to the K accumulation in the stem,
the mean estimated values of 0.567 and 2.253 g plant-1 were
obtained at the cassava wastewater doses of 0 and 136 m3 ha-1,
respectively, which are equivalent to extractions of 28.4 and 112.6 kg ha-1 of K, representing an increment of 297%.
For K accumulation in the capitulum, the lowest value (1.189 g plant-1) was obtained in the absence of cassava
wastewater (0 m3 ha-1), while the application of the highest
dose (136 m3 ha-1) promoted the highest accumulation (2.548
g plant-1), representing an increment on the order of 89.4%,
with extractions of 59.4 and 127.4 kg ha-1 of K, respectively.
In the achenes, K accumulation followed the same tendency, with 0.377 g plant-1 at the lowest dose and 0.711 g plant-1 at
the highest dose, corresponding to extractions of 18.8 and 35.5 kg ha-1 of K.
In all plant organs, the total accumulations of 2.467, 2.752, 3.038, 3.609, 4.751 and 7.034 g plant-1, respectively, at the
cassava wastewater doses of 0, 8.5, 17, 34, 68 and 136 m3 ha-1,
corresponded to extractions of 123.3, 137.6, 151.9, 180.4, 237.5 and 351.7 kg ha-1. The order of K extraction for the organs was:
capitulum > stem > leaves > achenes. According to Castro et al. (2006), sunflower is very demanding in K, approximately 171 kg of K2O in the shoots (stem, petiole, leaf, capitulum and grains) for every ton of grains produced.
Castro & Oliveira (2005) observed that the total extractions of N, P and K in the shoots, for a production of 3,176 kg of achenes ha-1, were 130 kg ha-1 of N, 25 kg ha-1 of P and 400 kg
ha-1 of K. In the present study, the extractions of N, P and K,
considering the shoots for a production of 4.498 kg of achenes ha-1, at the highest dose of cassava wastewater (136 m3 ha-1),
were 431, 144 and 341 kg ha-1, respectively.
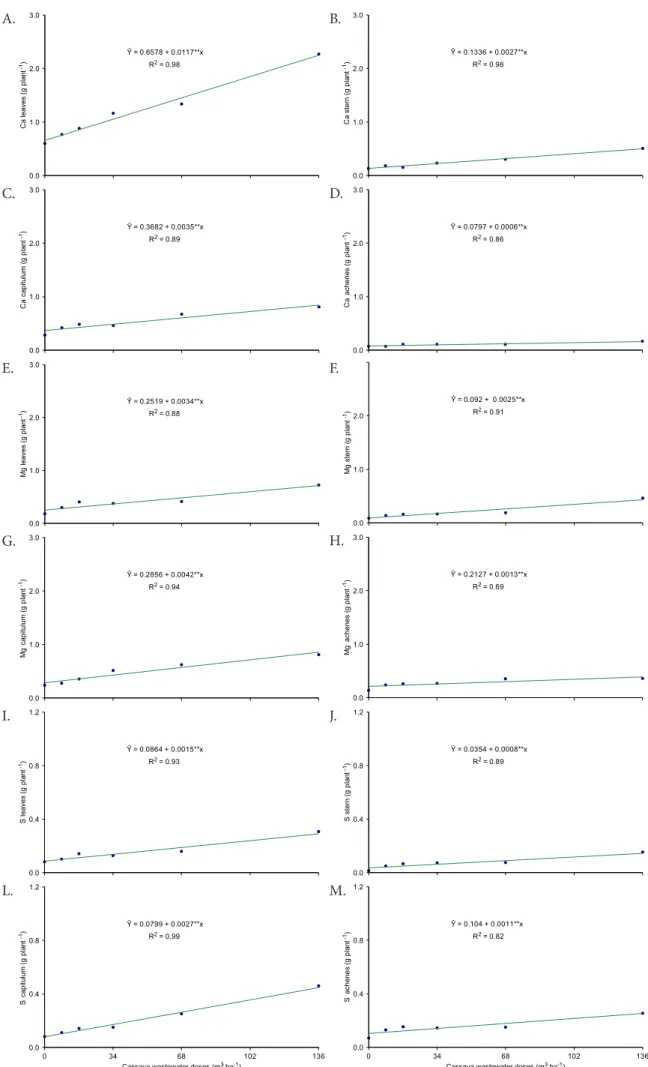
The increment in cassava wastewater doses promoted linear increase in Ca contents in leaves, stem, capitulum and achenes (Figure 2A, B, C and D). The contents accumulated in the leaves of plants without (0 m3 ha-1) and with the highest dose (136
m3 ha-1) of cassava wastewater increased from 0.658 to 2.244 g
plant-1, representing an increment of 241%. Ca accumulation
in the stem followed the same tendency, with 0.134 and 0.504 g plant-1 for the doses of 0 and 136 m3 ha-1 of cassava wastewater,
Figure 1. Accumulation of nitrogen (N), phosphorus (P) and potassium (K) in leaves, stem, capitulum and achenes of
sunflower fertilized with different cassava wastewater doses
* significant at 0.05 probability level (p < 0.05); ** significant at 0.01 probability level (p < 0.01); ns not significant
0.0 1.0 2.0 3.0
0 34 68 102 136
Ŷ = 0.3766 + 0.0025**x R = 0.822
K(
gp
lant
achenes
-1)
Cassava wastewater doses (m ha3 -1) 0.0
1.0 2.0 3.0
0 34 68 102 136
Ŷ = 1.1894 + 0.01**x R = 0.952
K(
gp
la
nt
capitulum
-1)
Cassava wastewater doses (m ha3 -1)
0.0 1.0 2.0 3.0
Ŷ = 0.5671 + 0.0124**x R = 0.982
K(
gp
lant
stern
-1)
0.0 1.0 2.0 3.0
Ŷ = 0.3337 + 0.0087**x R = 0.992
K(
gp
lant
leaves
-1)
0.0 1.0 2.0 3.0
Ŷ = 0.4554 + 0.0034**x R = 0.892
P(
gp
la
nt
achenes
-1)
0.0 1.0 2.0 3.0
Ŷ = 0.2894 + 0.0083**x R = 0.952
P(
gp
lant
capitulum
-1)
0.0 0.4 0.8 1.2
Ŷ = 0.0711 + 0.0014**x R = 0.892
P(
gp
la
nt
stern
-1)
0.0 0.4 0.8 1.2
Ŷ = 0.0513 + 0.0014**x R = 0.952
P(
gp
lant
leaves
-1)
0.0 2.0 4.0 6.0
Ŷ = 1.4246 + 0.0104**x R = 0.802
N(
gp
lant
achenes
-1)
0.0 2.0 4.0 6.0
Ŷ = 0.986 + 0.0241**x R = 0.932
N(
gp
lant
capitulum
-1)
0.0 0.5 1.0 1.5 2.0
Ŷ = 0.0752 + 0.0021**x R = 0.952
N(
gp
lant
stern
-1)
0.0 0.5 1.0 1.5 2.0
Ŷ = 0.2482 + 0.0081** x R = 0.972
N(
gp
lant
leaves
-1)
A.
C.
E.
G.
I.
L.
B.
D.
F.
H.
J.
Figure 2. Accumulation of calcium (Ca), magnesium (Mg) and sulfur (S) in leaves, stem, capitulum and achenes of
sunflower fertilized with different cassava wastewater doses 0.0 0.4 0.8 1.2
0 34 68 102 136
Ŷ = 0.104 + 0.0011**x R = 0.822
S(
gp
lant
achenes
-1)
Cassava wastewater doses (m ha3 -1) 0.0
0.4 0.8 1.2
0 34 68 102 136
Ŷ = 0.0799 + 0.0027**x R = 0.992
S(
gp
la
nt
capitulum
-1)
Cassava wastewater doses (m ha3 -1)
0.0 0.4 0.8 1.2
Ŷ = 0.0354 + 0.0008**x R = 0.892
S(
gp
lant
stern
-1)
0.0 0.4 0.8 1.2
Ŷ = 0.0864 + 0.0015**x R = 0.932
S(
gp
lant
leaves
-1)
0.0 1.0 2.0 3.0
Ŷ = 0.2127 + 0.0013**x R = 0.692
Mg
(g
pl
ant
achenes
-1)
0.0 1.0 2.0 3.0
Ŷ = 0.2856 + 0.0042**x R = 0.942
Mg
(g
pl
ant
capitulum
-1)
0.0 1.0 2.0
Ŷ = 0.092 + 0.0025**x R = 0.912
Mg
(g
pl
ant
stern
-1)
0.0 1.0 2.0 3.0
Ŷ = 0.2519 + 0.0034**x R = 0.882
Mg
(g
pl
ant
leaves
-1)
0.0 1.0 2.0 3.0
Ŷ = 0.0797 + 0.0006**x R = 0.862
Ca
(g
pl
an
t
achenes
-1)
0.0 1.0 2.0 3.0
Ŷ = 0.3682 + 0.0035**x R = 0.892
Ca
(g
pl
ant
capitulum
-1)
0.0 1.0 2.0 3.0
Ŷ = 0.1336 + 0.0027**x R = 0.982
Ca
(g
pl
ant
stern
-1)
0.0 1.0 2.0 3.0
Ŷ = 0.6578 + 0.0117**x R = 0.982
Ca
(g
pl
ant
leaves
-1)
A.
C.
E.
G.
I.
L.
B.
D.
F.
H.
J.
capitulum, Ca accumulation was equal to 0.368 g plant-1 at
the dose of 0 m3 ha-1 and 0.846 g plant-1 at the dose of 136
m3 ha-1, representing an increment of 130% from the lowest
to the highest dose.
As to the accumulation of Ca in the achenes, the behavior was similar to that in leaves, stem and capitulum, as a function of the applied doses of cassava wastewater, with 0.079 and 0.163 g plant-1 for the dose of 0 and 136 m3 ha-1 of the organic input
applied to the soil in liquid form. The total Ca accumulations in the whole plant were 1.239, 1.397, 1.554, 1.859, 2.497 and 3.757 g plant-1, respectively, for the doses of 0, 8.5, 17, 34, 68
and 136 m3 ha-1, and corresponded to extractions of 61.97,
69.84, 77.71, 92.94, 124.85 and 187.87 kg ha-1, according to the
following order of extraction per organ: leaves > capitulum > stem > achenes. Zobiole et al. (2010), at 82 days, observed Ca accumulation of 2.903 g plant-1, with extraction of 116 kg ha-1.
These results are similar to those found in the present study for the cassava wastewater doses of 68 and 136 m3 ha-1.
As observed for the other macronutrients, Mg accumulation in leaves, stem, capitulum and achenes increased linearly with the increment in the doses of cassava wastewater (Figure 2E, 2F, 2G and 2H). Mg contents in the leaves increased from 0.252 g plant-1, at the dose of 0 m3 ha-1,to 0.709 g plant-1, at the
highest dose (136 m3 ha-1). In the same treatments, Mg contents
increased from 0.092 to 0.393 g plant-1 in the stem, 0.286 to
0.855 g plant-1 in the capitulum and 0.213 to 0.392 g plant-1 in
the achenes. These values express increments of 178.5, 327.2, 209.4 and 84%, respectively, between plants treated without cassava wastewater and with the highest dose.
The total Mg accumulations were equal to 0.842, 0.939, 1.107, 1.228, 1.526 and 2.348 g plant-1, respectively for the
cassava wastewater doses of 0, 8.5, 17, 34, 68 and 136 m3 ha-1,
corresponding to extractions of 42.1, 46.9, 55.4, 61.4, 76.3 and 117.4 kg ha-1, in the following order of extraction per organ:
capitulum > leaves > stem = achenes. In sunflower, Zobiole et al. (2010) observed Mg accumulation of 1.047 g plant-1 at 82
days, which corresponded to an extraction of 42 kg ha-1, but
higher values of accumulation and extraction were observed for the cassava wastewater doses of 17, 34, 68 and 136 m3 ha-1.
For S accumulation, there was an increasing linear effect for the leaves, stem, capitulum and achenes (Figure 2I, 2J, 2L and 2M). S accumulation in the leaves was equal to 0.086 g plant-1
at the cassava wastewater dose of 0 m3 ha-1 and 0.293 g plant-1
at the dose of 136 m3 ha-1, which represents an increment of
240%. In the stem, there were accumulations of 0.354 g plant-1
at the dose of 0 m3 ha-1 and 0.149 g plant-1 at the dose of 136 m3
ha-1, which corresponded to an increment of 371% from the
lowest to the highest dose. In the capitulum, S accumulation was 0.799 g plant-1 at the dose of 0 m3 ha-1 and 0.450 g plant-1
at the dose of 136 m3 ha-1, representing an increase of 464% of
the highest dose in relation to the lowest one. In the achenes, S accumulation was 0.104 g plant-1 at the lowest dose and 0.178
g plant-1 at the highest one, with increment of 71%.
The total accumulations in the plant were 0.305, 0.358, 0.410, 0.515, 0.725 and 1.153 g plant-1, respectively, for the
cassava wastewater doses of 0, 8.5, 17, 34, 68 and 136 m3 ha-1,
representing an increment of 277% of the highest dose (136 m3
ha-1) in relation to the lowest one (0 m3 ha-1), with extractions
of 15.3, 17.9, 20.5, 25.7, 36.2 and 57.6 kg ha-1, respectively.
The extraction per organ occurred in the following sequence: capitulum > leaves > achenes > stem. According to Zobiole et al. (2010), the maximum S accumulation occurred at 82 days and was 0.605 g plant-1, with extraction of 24 kg ha-1. Higher values
were observed in the present study for the cassava wastewater doses of 68 and 136 m3 ha-1, with total S accumulations of 0.723
and 1.153 g plant-1, at 90 days after sowing, and extractions of
36.2 and 57.6 kg ha-1. Based on the accumulation of nutrients,
the order of extraction per element was: nitrogen > potassium > calcium > magnesium > phosphorus > sulfur.
Conclusions
1. The cassava wastewater dose of 136 m3 ha-1 promotes the
highest accumulation of all nutrients evaluated.
2. Cassava wastewater provides adequate contents of N, P, K, Ca, Mg and S, showing potential as an organic fertilizer for sunflower, cv. ‘Hélio 250’.
3. The accumulation of macronutrients in the different organs is in the following order: Leaves - Ca > K > N > Mg > S > P; Stem - K > Ca > Mg > N > P > S; Capitulum - N > K > P > Mg > Ca > S; and Achenes - N > P > K > Mg > S > Ca. The order of extraction of nutrients by sunflower plants is: N > K > Ca > Mg > P > S.
Literature Cited
APHA - American Public Health Association, AWWA - American Water Works Association, WPCF - Washington Press Club Foundation. Standard methods for the examination of water and wastewater. Washington: American Public Health Association, 17.ed. 1995. 2198p.
Araújo, N. C. de; Ferreira, T. C.; Oliveira, S. J. C.; Gonçalves, C. P.; de Araújo, F. de A. C. de. Avaliação do uso de efluente de casas de farinha como fertilizante foliar na cultura do milho (Zea mays L.). Revista Engenharia na Agricultura, v.20, p.340-349, 2012. http:// dx.doi.org/10.13083/1414-3984.v20n04a06
Bezerra Neto, E.; Barreto, L. P. Análises químicas e bioquímicas em plantas. Recife: UFRPE, 2011. 267p.
Cabral, J. R.; Freitas, P. S. L.; Bertonha, A.; Muniz, A. S. Effects of wastewater from cassava industry on soil chemistry and crop yield of lopsided oats (Avena strigosa Schreb). Brazilian Archives of Biology and Technology, v.53, p.19-26. 2010. http://dx.doi. org/10.1590/S1516-89132010000100003
Cardoso, E.; Cardoso, D.; Cristiano, M.; Silva, L. da; Back, A. J.; Bernadim, A. M.; Paula, M. M. da S. Use of Manihot esculenta, crantz processing residue as biofertilizer in corn crops. Research Journal of Agronomy, v.3, p.1-8, 2009.
Castro, C.; Oliveira, F. A. Nutrição e adubação do girassol. In: Girassol no Brasil. Londrina:, v.1, p.317-374, 2005.
Dantas, M. S. M.; Rolim, M. M.; Duarte, A. S.; Pedrosa, E. M. R.; Tabosa, J. N.; Dantas, D. C. Crescimento do girassol adubado com resíduo líquido do processamento de mandioca. Revista Brasileira de Engenharia Agrícola e Ambiental, v.19, p.350-357, 2015. http://dx.doi.org/10.1590/1807-1929/agriambi. v19n4p350-357
Duarte, A. S.; Silva, E. F. F.; Rolim, M. M.; Ferreira, R. F. A. L.; Malheiros, S. M. M.; Albuquerque, F. S. Uso de diferentes doses de manipueira na cultura da alface em substituição à adubação mineral. Revista Brasileira de Engenharia Agrícola e Ambiental, v.16, p.262-267, 2012. http://dx.doi.org/10.1590/S1415-43662012000300005
Fia, R.; Matos, A. T.; Aguirre, C. I. Produtividade e concentração de nutrientes e metais pesados em milho adubado com doses crescentes de lodo de esgoto caleado. Engenharia na Agricultura, v.14, p.39-50, 2006.
Laviola, B. G.; Dias, L. A. S. Teor e acúmulo de nutrientes em folhas e frutos de pinhão-manso. Revista Brasileira de Ciências do Solo, v.32, p.1969-1975, 2008. http://dx.doi.org/10.1590/S0100-06832008000500018
Lobo, T. F.; Grassi Filho, H.; Bull, L. T.; Kummer, A. C. B. Efeito do lodo de esgoto e do nitrogênio nos fatores produtivos do girassol. Revista Brasileira de Engenharia Agrícola e Ambiental, v.17, p.504-509, 2013. http://dx.doi.org/10.1590/S1415-43662013000500006 Modesto, P. T.; Scabora, M. H.; Colodro, G.; Maltoni, K. L.; Cassiolato,
A. M. R. Alterações em algumas propriedades de um Latossolo degradado com uso de lodo de esgoto e resíduos orgânicos. Revista Brasileira de Ciência do Solo, v.33, p.1489-1498, 2009. http:// dx.doi.org/10.1590/S0100-06832009000500039
Ribeiro, A. C.; Guimarães, P. T. G.; Alvarez V., V. H. Recomendações para o uso de corretivos e fertilizantes em Minas Gerais. 5a aproximação Viçosa: CFSEMG, 1999. 359p.
Santos, M. H. V.; Araújo, A C.; Santos, D. M. R.; Lima, N. S.; Lima, A. C. A.; Lima, C. L. C.; Santiago, A. D. Uso da manipueira como fonte de potássio na cultura da alface (Lactuca sativa L.) cultivada em casa de vegetação. Acta Scientiarum Agronomy, v.32, p.729-733, 2010. Zobiole, L. H. S.; Castro, C.; Oliveira, F. A.; Oliveira Júnior, A.; Moreira, A.