www.ccarevista.ufc.br ISSN 1806-6690
Growth and gas exchange in white pitaya under different
concentrations of potassium and calcium
1Crescimento e trocas gasosas de pitaia branca submetida a diferentes doses de
potássio e cálcio
João Paulo Cajazeira2*, Márcio Cleber de Medeiros Corrêa3, Edmilson Igor Bernardo Almeida4, Ronialison Fernandes Queiroz5 and Rosilene Oliveira Mesquita3
ABSTRACT - Agriculture in Brazil has improved at a fast pace in recent years, given the growing demand for quality and
the need for new products. In this respect, white pitaya [Hylocereus undatus (Haw.) Britton & Rose] has become a feasible
alternative for Northeast farmers. The limiting factors include a small amount of data on plant mineral nutrition and crop growth (phenology). Therefore, this study goal was to evaluate the effect of different concentrations of potassium (K) and calcium (Ca) on crop development and gas exchange in white pitaya grown in the coastal region of the state of Ceará, in Brazil. Sixteen treatments with three repetitions were organized in a completely randomized block design and a 4 ´ 4 factorial arrangement. Treatments consisted of various concentrations of K (0; 125; 250 and 375 mg dm-3) and Ca (0, 53, 106, and 159 mg dm-3). Biometric characteristics and gas exchange were determined after 270 and 240 days of treatment, respectively. For morphometric characteristics, the most significant nutrient combination was 250 mg dm-3 of K and 159 mg dm-3 of Ca. Net photosynthesis was higher at the dose of 125 mg dm-3 of K and 0 mg dm-3 of Ca. Our results indicate that, for the environmental conditions under which the test was conducted, an optimum nutrient combination for the analyzed variables was 250 mg dm-3 K and 159 mg dm-3 Ca.
Key words:Hylocereus undatus. Cactaceae. Nutrient interaction. Mineral nutrition.
RESUMO - É notório que a agricultura nacional vem se modificando em ritmo acelerado nos últimos anos. A exigência do mercado consumidor, somada à necessidade de novos produtos, é responsável por este fato. Diante disso, a cultura da pitaia branca (Hylocereus undatus (Haw.) Britton & Rose) tem se mostrado uma alternativa viável aos produtores agrícolas da região
Nordeste. Como fatores limitantes, destacam-se: as incipientes informações em relação à nutrição mineral da planta, aliada a dados referentes ao crescimento da cultura (fenologia). Assim, desenvolveu-se este trabalho visando avaliar a influência do potássio e cálcio no desenvolvimento desta cultura, bem como nas relações de trocas gasosas, na região litorânea no estado do Ceará. O delineamento estatístico foi em blocos casualizados, em arranjo fatorial 4 x 4, com 16 tratamentos e três repetições. Os tratamentos foram constituídos por doses de potássio, (0; 125; 250 e 375 mg K dm-3) e doses de cálcio, (0; 53; 106 e 159 mg Ca dm-3). As avaliações foram realizadas aos 270 dias para as determinações biométricas e 240 dias para as avaliações de trocas gasosas. Para os caracteres morfológicos, a interação nutricional que se destacou foi 250; 159 mg dm-3 (K; Ca). A fotossíntese líquida foi maior nas doses 125 mg K dm-3 e 0 mg Ca dm-3. Para as condições ambientais em que o ensaio foi realizado, as doses 250 e 159 mg dm-3(K; Ca) foram as que se destacaram para as variáveis analisadas.
Palavras-chave:Hylocereus undatus. Cactaceae. Interação nutricional. Nutrição mineral.
DOI: 10.5935/1806-6690.20180013 *Autor para correspondência
Recebido para publicação em 01/11/2016; aprovado em 06/04/2017
1Parte da Tese de Doutorado do primeiro autor apresentada ao Programa de Pós-Graduação em Fitotecnia da Universidade Federal do Ceará,
Campus do Pici, Fortaleza-CE
2Departamento de Fitotecnia, Universidade Federal do Ceará/UFC, Campus do Pici, Av. Mister Hull, 2977, Bloco 805, Fortaleza-CE, Brasil,
3Departamento de Fitotecnia, Centro de Ciências Agrárias, Universidade Federal do Ceará/UFC, Campus do Pici, Av. Mister Hull, 2977, Bloco 805,
Fortaleza-CE, Brasil, [email protected], [email protected]
4Centro de Ciências Agrárias e Ambientais, Universidade Federal do Maranhão/UFMA, Campus de Chapadinha, Chapadinha-MA, Brasil,
5Departamento de Fitotecnia, Centro de Ciências Agrárias, Universidade Federal do Ceará/UFC, Campus do Pici, Av. Mister Hull, 2977, Bloco 805,
INTRODUCTION
Nutrient interactions may occur before nutrient assimilation by the plant, at the soil-plant interface. These interactions affect nutrient absorption, transport, and metabolism, cause nutritional disorders, decreasing crop productivity (PRADO; VIDAL, 2008). In this respect, Fontes (2014) emphasized the importance of an adequate nutrient management at the soil-plant-environment-genotype interface to ensure an efficient use of nutrients by plants.
Potassium (K) is involved in carbohydrate translocation, and stomatal opening and closing; therefore, this nutrient assumes an important role in gas exchange for many plant species. Kano, Cardoso and Villas Bôas (2010) highlighted the importance of K for plant development and observed its participation in the activation of enzymes involved in respiration and photosynthesis (HEIDARI; JAMSHID, 2010). Moreover, K promotes an increase in cell wall thickness, which hence confers greater rigidity to plant tissues (ANDRIOLOet al., 2010).
Plants absorb calcium (Ca) through mass flow, being accumulated in leaves but with transport limited by phloem; thereby, it is not transferred from older leaves to younger leaves. In tropical soils, this nutrient is used to enhance phosphorus (P) bioavailability (FERREIRAet al., 2013).
According to Nunes et al. (2014), Hylocereus undatus, known as white pitaya, is the most widely
distributed of Cactaceae species throughout Brazil. These authors also emphasized its economic importance owning to a growing demand from European and American markets. Therefore, further research is needed to assess the nutritional potential of this plant species.
White pitaya has a wide range of applications including human feeding and animal feed production. Besides, the fruit has a higher concentration of water, proteins, and vitamin C per 100 g pulp if compared to other species such asH. polyrhizus,H. megalanthus, and H. setaceus (ABREUet al., 2012; BRUNINI; CARDOSO,
2011; CHOO; YONG, 2011; LIMAet al., 2013).
Thus, the main goal of this study was to evaluate the effect of different concentrations of K and Ca on initial growth and gas exchange coefficients (ecophysiology) of white pitaya plants grown in Fortaleza - Ceará state, Brazil.
MATERIAL AND METHODS
The study was conducted from April 2014 to January 2015 in an open area at the Horticulture Sector
of the Phytotechnology Department, Federal University of Ceará (Universidade Federal do Ceará-UFC), in Fortaleza - Ceará state, Brazil. The local climate is an Aw type,
which stands for tropical rainy according to Köppen’s classification (ALVARESet al., 2014).
Tested plants were originated from a 3-year-old plant stock kept at the Horticulture Sector of the UFC. The plant was propagated by cutting using the criteria previously described by Pontes Filho et al. (2014).
Healthy cuttings with an average length of 25 cm were selected for the production of seedlings. The cuttings were planted at a depth of 3 cm in 3-dm3 polyethylene bags and maintained in a protected environment for 120 days until rooting.
After this period, the plants were transferred to 11-dm3 polypropylene pots (filling capacity: 10 dm3) filled with sand and organic fertilizer (1:1). This substrate showed the following characteristics: pH (H2O), 5.5; organic matter (g dm-3), 16.86; Mehlich-P (mg dm-3), 30.0; K+ (cmol
c dm-3), 0.1; Ca++ + Mg++ (cmolc dm-3), 3.3; Na+ (cmol
c dm-3), 0.17; exchangeable Al (cmolc dm-3), 0.25; H + Al (cmol
c dm-3), 2.31; S, 3.6 (cmolc dm-3); T, 5.9 (cmol
c dm-3); V (%), 61; m (%), 4.2; C (g dm-3), 9.78; N (g dm-3), 1.1.
After 45 days, the pots were transferred to the field and put on shelves set 15 cm above the ground, to avoid roots direct contact with the soil and facilitate the visualization of possible leachates.
The experimental design was a completely randomized block, in a 4 x 4 factorial scheme, with 16 treatments and 3 repetitions, totaling 48 plots. Each plot included one pot with one plant. The treatments consisted of a combination of one concentration of K (0, 125, 250, or 375 mg dm-3) and one concentration of Ca (0, 53, 106, or 159 mg dm-3), as detailed in a preliminary study (ALMEIDAet al., 2014).
The sources of K and Ca were potassium chloride and calcium oxide, respectively. The concentrations were adjusted to the substrate volume (10 dm3).
In the experiments, a basic fertilizer was applied to all pots using standard fertilization based on N (375 mg dm-3), phosphorus (P) (160 mg dm-3), and micronutrients [25.40 mg of fritted trace elements (FTE) dm-3]. The ammonium sources were ammonium sulfate (AS), simple superphosphate [Ca (H2PO4)2H2O + CaSO4.2H2O-SSP] and FTE BR 12, respectively. A total of 18.75 g of AS, 20.35 g of SSP, and 0.25 g of FTE BR 12 were used per vase, and these nutrients were used in a single treatment, except nitrogen, which was used in three treatments, as described below.
performed in a single plot, and calcium was added according to each treatment. Forty-five days after the application of the first portion of basic fertilizer containing N, K was applied according to each treatment. The other two portions of N and K were applied in the same way after 30 and 60 days of the first application, totaling three applications.
Biometric analysis of vegetative growth attributes was conducted after 270 days of treatment. The measured variables included the total number of cladodes (TNC) and the number of lateral cladodes originated from the primary cladode, and the result was presented as cladode units. Another evaluated variable was the sum of the length of the cladodes (SLC). Except for the primary cladode, this variable was measured using a millimeter scale and the total value was presented in centimeters. After that, the cladode diameter (CD) was evaluated using a digital caliper by measuring the cladode ends, and the results were expressed in millimeters. The cladode thickness (CT) was measured using a digital caliper considering the distance between two adjacent sulci of a cladode and was expressed in millimeters. Data on shoot wet weight (SWW) were obtained after 270 days of treatment. The samples were collected destructively. After the measurement of SWW, the samples were dried in a forced air circulation oven (65 ºC) for 72 h and the SDW was calculated. The results were expressed in grams.
Gas exchange was measured after 240 days of treatment. For this purpose, a portable infrared gas analyzer (IRGA) was used to determine the concentration of CO2 and water vapor in an open-flow gas exchange system. The analyzed variables were the intercellular CO2 concentration of (Ci), transpiration rate (E), stomatal conductance (gs), net CO2 assimilation (A), and the ratio of intercellular to ambient CO2 concentration (Ci/Ca). These parameters were determined in a cladode area of 35 cm2 using a general equation for gas exchange. Instantaneous water use efficiency (A/E), intrinsic water use efficiency (A/gs), and carboxylation efficiency (A/Ci) were determined by calculating the ratio between A and E, gs, and Ci, respectively. The measurements were made between 1:00 am and 3:00 am because of the metabolic profile of the plant.
Initially, the variables were analyzed using Fisher’s descriptive statistics, including the application of the Shapiro-Wilk (S-W) normality test at a significance level of 5% to assess the frequency distribution of the variables. For validation of normality, the mean, median, asymmetry values, and the w value of the statistical test were determined (CAJAZEIRA; ASSIS JÚNIOR, 2011).
After rejecting the null hypothesis, the data were subjected to analysis of variance using the F test with a level of significance of 5% to evaluate the main effect of the variables and their interactions. Regression adjustment was performed using two models: a linear model (Y = a + bx) and a quadratic model (Y = a + bx + cx2).
The interaction between the nutrients was plotted using response surface models and data interpolation, wherein the X-axis represented the dose of K, the Y-axis corresponded to the concentration of Ca, and the W axis represented the response surface of the variable.
RESULTS AND DISCUSSION
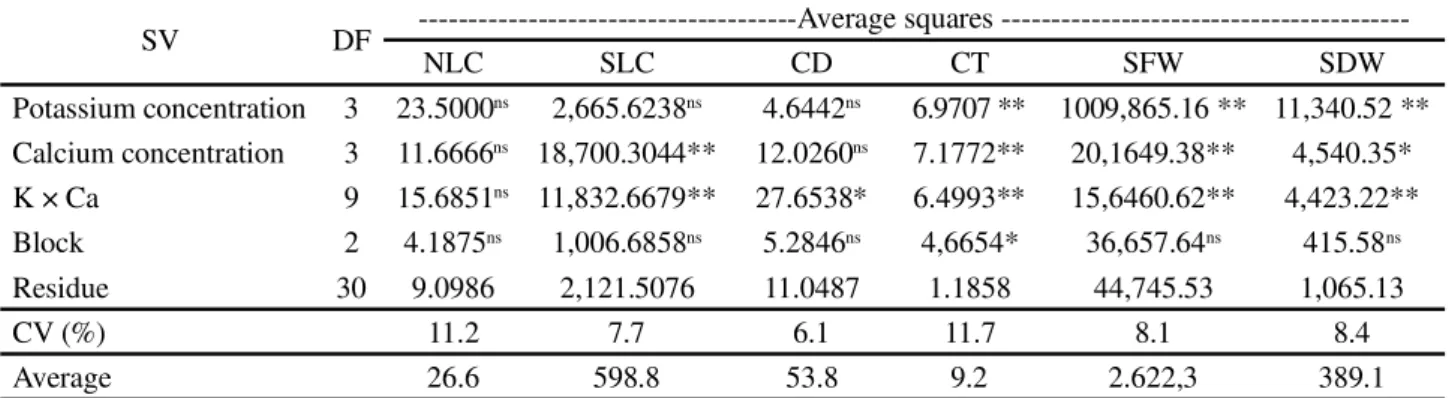
Table 1 shows the results of biometric analysis using ANOVA. The presence of K affected CT, SWW, and SDW at a level of significance of 1%. The presence of Ca affected SLC, TC, and SWW at a level of significance of 1% and SDW at a level of significance of 5%.
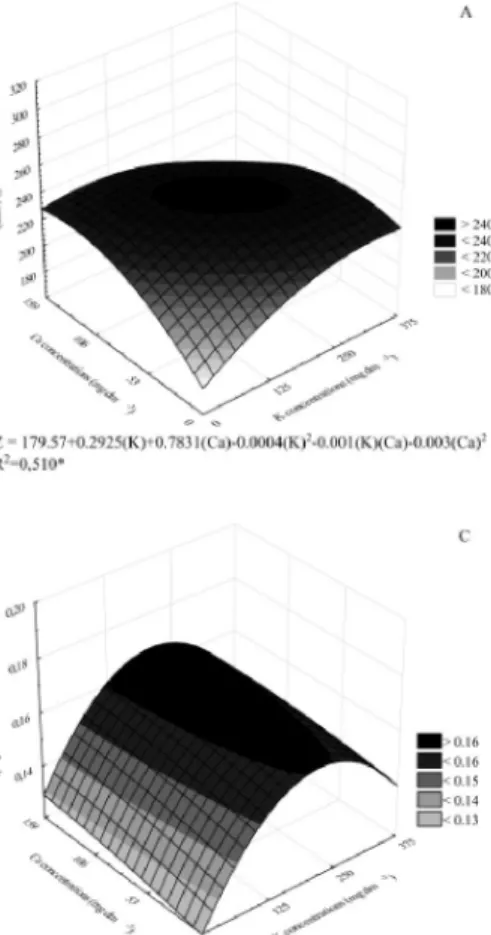
The lowest SLC values were observed at the concentration of 0-125 mg dm-3 of K together with 0–53 mg dm-3 of Ca. SLC values were increased at higher doses of both K and Ca. The highest average SLC was observed at approximately 250 and 159 mg dm-3 of K and Ca, respectively (Figure 1A).
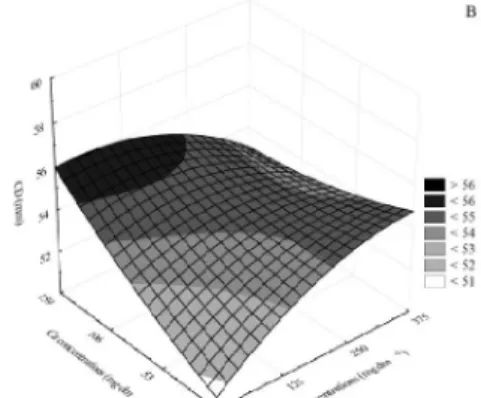
SLC was increased up to the second highest concentration of K and Ca but was unchanged at higher doses. These results agree with those of Almeida et al. (2014), wherein SLC was stabilized at 225–300 mg dm-3 of K. For CD, there was a synergistic effect among the evaluated nutrient concentrations (p<0.05) (Table 1, Figure 1B). Similar to what was observed for SLC (Figure 1A), the CD was increased with increasing doses of K and Ca until a maximum value was obtained at the two lower concentrations of K and the highest concentration of Ca, and at the two lower doses of Ca and the highest dose of K. Another similarity with SCC was the effect of fertilization with K in the absence of Ca or in the presence of a small concentration of Ca.
At Ca concentrations close to zero, as K concentrations were increased, the CD was increased until a maximum value was reached at approximately 375 mg dm-3 of K (Figure 1B). CD was unchanged at higher K doses. A similar result was reported by Donato
et al. (2014), who observed stabilization in the CD
higher levels of Ca. However, there was a difference relative to SLC in that CD was decreased at the highest doses of Ca and K. Limaet al. (2013) studied the same
plant species and found that the mean DC was 58 mm in plants grown for 4 years. In our study, the mean DC was 53.86 mm.
There was a progressive linear increase in CT using K and Ca (Figure 1C). After combining these elements, the mean CT was increased as the doses were increased. Therefore, the response of white pitaya to the tested doses is evident, indicating that the lower CT values were obtained at the lowest concentrations of the two nutrients.
The three morphometric variables statistically significant (SLC, CD, and CT) were increased as the concentration of these nutrients was raised; thereby, the response surfaces were very similar. For Costa, Gianluppi, and Moraes (2012), the relationship of morphometric variables is reflected as precise responses to the crop conditions, i.e., how plants respond to the environment and fertilizers.
Silva et al. (2012) studied the cactus Opuntia ficus-indica Mill and highlighted the importance of
measuring morphometric characteristics as a criterion for plant selection. Neder et al. (2013) reported that the
measurement of these characteristics is essential for the selection of cactus species that adapt to the conditions of the Brazilian Northeast.
The analysis of biomass data collected above the plant neck indicated that there was a linear increase in the fresh weight of the cladodes at different K and Ca concentrations, and the maximum value was observed at approximately 250 mg dm-3 of K, independent of the amount of Ca. The values ranged from 1,808.3 to
2,992.0 g (variation of 1,183.7 g). The increment in SFW with the increase in the tested doses is shown in Figure 1D. The Ca concentrations did not reach equilibrium, given its linear growing behavior and since the highest dose did not stabilize.
The highest SFW values were obtained with the combination of 250–375 mg dm-3 of K and 106-159 mg dm-3 of Ca.
SDW and SFW increments were similar, increasing as K and Ca levels were raised. As for SFW, the highest SDW was observed at 250 mg dm-3 K, but decreasing at higher K concentrations. In the presence of Ca and absence of K, there was a constant increase in SDW until the dose of 159 mg dm-3, and this variable did not stabilize at the highest dose (Figure 1E).
The highest SDW was achieved at 125-250 mg dm-3 of K and 159 mg dm-3 of Ca. The highest value was 452.2 g and the lowest value was 307.7 g.
Cavalcante et al. (2011) studied Hylocereus undatus grown with organic fertilizers (Ca = 4.4 cmolc
dm-3; K = 12,109 mg dm-3) at the doses of 0, 5, 10, 20, and 30 L per pit and observed that the highest SDW values were obtained at 20 L per pit, and a similar result was observed in the present study.
With regard to gas exchange after 240 days of treatment, there were significant interactions between the nutrients for all analyzed variables (p<0.01). Therefore, response surface models were chosen for the interpretation of the results.
There was synergism between the two nutrients for Ci (Table 2). K did not affect E after 240 days of treatment and Ca did not affect gs for the same plant culture in the same study period.
SV DF ---Average squares
---NLC SLC CD CT SFW SDW
Potassium concentration 3 23.5000ns 2,665.6238ns 4.6442ns 6.9707 ** 1009,865.16 ** 11,340.52 ** Calcium concentration 3 11.6666ns 18,700.3044** 12.0260ns 7.1772** 20,1649.38** 4,540.35* K × Ca 9 15.6851ns 11,832.6679** 27.6538* 6.4993** 15,6460.62** 4,423.22** Block 2 4.1875ns 1,006.6858ns 5.2846ns 4,6654* 36,657.64ns 415.58ns
Residue 30 9.0986 2,121.5076 11.0487 1.1858 44,745.53 1,065.13
CV (%) 11.2 7.7 6.1 11.7 8.1 8.4
Average 26.6 598.8 53.8 9.2 2.622,3 389.1
Table 1 - Analysis of variance of the effect of the concentration of potassium and calcium on the following morphometric parameters: number of lateral cladodes (NLC), sum of the length of cladodes (SLC), cladode diameter (CD), cladode thickness (CT), shoot fresh weight (SFW), and shoot dry weight (SDW) for white pitaya after 270 days of treatment
Both in the presence of K and absence of Ca, Ci values were increased until a dose of 250 mg dm-3 of K; however, no changes were observed at higher concentrations. In the presence of Ca and absence of K, the highest Ci values were obtained at 106 mg dm-3 of Ca and the values remained stable at higher doses. These results indicate that none of the evaluated concentrations was a limiting factor for the elevation of Ci (Figure 2A).
The highest E values were achieved with the combination of 375 mg dm-3 of K and 159 mg dm-3 of Ca (Figure 2B). Therefore, it can be inferred that there was higher O2/CO2 exchange at these doses, affecting A.
Ca alone had no effect on gs; in turn, in the combination of K and Ca, gs values were increased up to a dose of 250 mg dm-3 of K (Figure 2C).
A was affected by these nutrients (Table 2 and Figure 2D). The highest doses of K and Ca yielded the highest A values, similar to the effect on E and gs and in contrast to the effect on Ci. Furthermore, the three lower concentrations of K (0, 125, and 250 mg dm-3) in the absence of Ca affected A, indicating that K is a limiting factor for A.
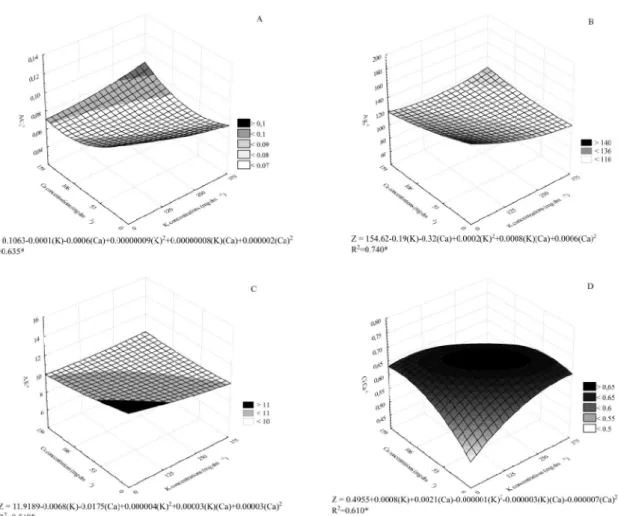
With regard to the interactions between gas exchange parameters, A Ci-1 was significantly decreased at the lower doses of K (0 to 125 mg dm-3) and Ca (0 to 53 mg dm-3), with a tendency of decrease with increasing doses (Figure 3A). This decrease was observed up to a dose of approximately 250 mg dm-3 of K and 159 mg dm-3 of Ca. However, at the K dose of 375 mg dm-3, the ratio was increased again by approximately 9%. The comparison of Figures 2A and 3A revealed that the increase of Ci caused a decrease in the photosynthetic activity because of a limitation in gs (Figure 2D).
The effect of nutrient interaction on A gs-1 is shown in Figure 3B. The effect on A gs-1 was similar to that on A Ci-1 (Figure 3A), with a peak in the interaction at the control concentrations. CO2 assimilation is correlated with the loss of water because the stomata are open. A similar result was observed in this study, whereby the combination of 0 mg dm-3 of K and 0 mg dm-3 of Ca yielded the lowest Ci values, and this same dose combination caused the stronger decrease in E and gs (Figures 2B and 2C).
A gs-1 was decreased compared to baseline. Melo
et al. (2010) observed that gas exchange was strongly
correlated with environmental conditions. Therefore, this
Table 2 - Analysis of variance of the effect of potassium and calcium concentrations on gas exchange parameters: intercellular CO2 concentration (Ci), transpiration rate (E), stomatal conductance (gs), net photosynthesis (A), Ci Ca-1 ratio, carboxylation efficiency (A C
i-1), intrinsic water use efficiency (A gs-1), and instantaneous water use efficiency (A E-1) for white pitaya after 240 days of treatment
SV DF --- Average squares
---Ci E gs A
Potassium concentration 3 1160.3888** 0.0224ns 0.0058** 6.1426*
Calcium concentration 3 2276.1111** 0.0731** 0.0012ns 5.7074*
K × Ca 9 7279.9814** 0.0851** 0.0043** 22.0584**
Block 2 665.5833** 0.1366** 0.0040* 2.4886ns
Residue 30 67.2055 0.0142 0.0012 1.8986
CV (%) 3.7 7.4 23.8 8.4
Average 222.68 1.61 0.14 15.33
SV DF --- Average squares
---Ci Ca-1 A C
i-1 A gs-1 A E-1
Potassium concentration 3 0.0090** 0.0001* 2034.5407ns 2.3274ns
Calcium concentration 3 0.0158** 0.0010** 424.3247ns 4.8801*
K × Ca 9 0.0574** 0.0017** 4079.9115** 15.4318**
Block 2 0.0040** 0.0001ns 2179.3267ns 11.1846**
Residue 30 0.0005 0.0000 845.1334 1.2218
CV (%) 3.7 9.5 23.8 10.7
Average 0.61 0.07 121.11 10.30
Figure 2 - Effect of the interaction between potassium and calcium (mg dm-3) on intercellular CO
2 concentration (Ci; ppm), transpiration rate (E; mmol m-2 s-1), stomatal conductance (g
s; mol H2O m-2 s-1), and net photosynthesis (A;mmol m-2 s-1) in white pitaya after 240 days of treatment
decrease might be associated with a rise in air temperature and a decrease in relative humidity. The effect on E-1 was similar to that on A gs-1 (Figure 3C).
In summary, Figure 3B and 3C are related to water use efficiency (WUE) and this efficiency may be related to the lower transpiration rate and higher photosynthetic rate (Figure 2B and Figure 2D, respectively).
Figure 3D shows the correlation between the Ci/ Ca ratio and Ci. The strengthening of this relationship led to CO2 accumulation in plant tissues because the level of assimilated carbon was similar to that of the reference carbon. The ratio was decreased as K and Ca doses were increased, starting at 125 and 53 mg dm-3 of K and Ca, respectively. At higher concentrations, the Ci/Ca ratio stabilized up to a dose of 250 mg dm-3 of K and 106 mg dm-3 of Ca, and this variable was strongly decreased at higher doses.
The objective was to determine the most effective doses of these two elements in isolation and combination. The most effective concentration of K and Ca was 125 and 159 mg dm-3, respectively. Of note is that the most effective K concentration was the lowest whereas the most effective Ca concentration was the highest, and this result is related to the mobility of calcium that, in contrast to K, has limited mobility in the soil.
The Pearson phenotypic correlations between gas exchange and morphometric characteristics of white pitaya after 270 days of treatment are shown in Table 3.
At 125 mg dm-3 of K, C
i was significantly correlated with all gas exchange variables, with a moderate correlation with gs, and a strong or very strong correlation with A Ci-1 and A. As CO
Characteristic Ci E gs A ACi-1 Ag
s-1 AE-1 TNC SLC CD CT SFW SDW
Ci 0.53 0.59* –0.74** –0.93** –0.79** –0.74** –0.35 0.21 0.25 0.03 –0.07 –0.18 E –0.30 0.46 –0.49 –0.55 –0.55 –0.83** –0.46 0.23 0.11 0.08 –0.26 –0.37 gs 0.08 0.08 –0.22 –0.51 –0.85** –0.40 –0.27 0.19 –0.05 0.05 0.15 0.02 A –0.13 0.03 0.27 0.91** 0.66* 0.88** 0.42 –0.26 –0.24 0.22 –0.09 –0.14 A Ci-1 –0.84** 0.25 0.09 0.63* 0.83** 0.86** 0.43 –0.23 –0.21 0.13 0.00 0.02
A gs-1 –0.13 –0.06 –0.87** 0.19 0.19 0.72** 0.47 –0.16 –0.26 0.04 0.06 0.08
A E-1 0.10 –0.70* 0.11 0.67* 0.27 0.19 0.52 –0.29 –0.26 0.04 0.06 0.08
TNC 0.13 –0.12 0.43 0.11 –0.06 –0.37 0.13 0.37 0.23 0.12 0.26 0.15
SLC –0.12 –0.37 0.13 –0.20 –0.04 –0.23 0.14 0.52 0.63* –0.02 0.50 0.33
CG 0.67* –0.28 0.39 –0.13 –0.56 –0.49 0.12 0.39 0.12 0.51 0.31 0.23
TC –0.13 0.14 0.21 –0.07 0.05 –0.31 –0.16 0.14 0.18 0.18 –0.02 –0.17
SFW 0.07 –0.06 0.32 0.02 –0.05 –0.20 0.06 –0.06 0.71** 0.03 0.67* 0.92** SDW 0.47 –0.17 0.20 –0.20 –0.48 –0.22 –0.01 –0.01 0.73** 0.35 0.66* 0.87**
Table 3 - Pearson phenotype correlation coefficients (rf) between the following morphometric variables: total number of cladodes (TNC), sum of the length of the cladode (SLC), cladode diameter (CD), cladode thickness (CT), shoot fresh weight (SFW), transpiration rate (E), stomatal conductance (gs), net photosynthesis (A), carboxylation efficiency (A Ci-1), intrinsic water use efficiency (A g
s-1), and instant water use efficiency (A E-1) at a dose of 125 mg dm-3 of K (upper diagonal) and 159 mg dm-3 of Ca (lower diagonal), after 240 days of treatment
For the selected dose of K relative to all Ca doses, A was directly proportional to A Ci-1, A g
s
-1, and A E-1, with a very strong, moderate, and strong correlation coefficient, respectively.
With respect to morphometric characteristics, SLC was positively correlated with CD. Similarly, SFW was positively correlated with SDW, which was expected.
For the Ca doses relative to the other doses of K, A presented a positive and moderate correlation with A Ci-1 and A E-1.
Both gs and E were negatively correlated with A. This result was reflected in the biometry of the plant, and the higher SLC was correlated with the increase in SFW and SDW. Similarly, CT was positively correlated with SFW and SDW. The correlation coefficient of these variables was strong.
CONCLUSIONS
1. The optimal combination of K and Ca concentrations for the evaluated biometric characteristics was 125 mg dm-3 and 159 mg dm-3, respectively;
2. The net carbon assimilation in white pitaya showed a better photosynthetic response at a dose of 125 mg dm-3 of K and 0 mg dm-3 of Ca.
REFERENCES
ABREU, W. C.et al.Características físico-químicas e atividade
antioxidante total de pitaias vermelha e branca. Revista do Instituto Adolfo Lutz, v. 71, n. 4, p. 656-61, 2012.
ALMEIDA, E. I. B.et al. Nitrogênio e potássio no crescimento
de mudas de pitaia [Hylocereus undatus (Haw) BRITTON & ROSE].Revista Brasileira de Fruticultura, v. 36, n. 4, p.
1018-1027, 2014.
ALVARES, C. A.et al.Köppen’s climate classification map for Brazil. Meteorologische Zeitschrift, v. 22, n. 6, p. 711-728,
2014.
ANDRIOLO, J. L. et al. Doses de potássio e cálcio no crescimento da planta, na produção e na qualidade de frutas do morangueiro em cultivo sem solo.Ciência Rural, v. 40, n. 2, p. 267-272, 2010.
BRUNINI, M. A.; CARDOSO, S. S. Qualidade de pitaias de polpa branca armazenadas em diferentes temperaturas.Revista Caatinga, v. 24, n. 3, p. 78-84, 2011.
CAJAZEIRA, J. P.; ASSIS JÚNIOR, R. N. Variabilidade espacial das frações primárias e agregados de um Argissolo no estado do Ceará.Revista Ciência Agronômica, v. 42, n. 2, p. 37-47, 2011.
CAVALCANTE, I. H. L.et al.Adubação orgânica e intensidade luminosa no crescimento e desenvolvimento inicial da pitaya em Bom Jesus-PI.Revista Brasileira de Fruticultura, v. 33, n. 3, p. 970-982, 2011.
CHOO, W. S.; YONG, W. K. Antioxidant properties of two species of Hylocereus fruits. Advances in Applied Science Research, v. 2, n. 3, p. 418-425, 2011.
COSTA, N. L.; GIANLUPPI, V.; MORAES, A. de. Produtividade de forragem e morfogênese de Trachypogon vestitus, durante o período seco, em área de cerrado, Roraima.
Revista Trópica - Ciências Agrárias e Biológicas, v. 6, n. 1, p. 93-103, 2012.
DONATO, P. E. R.et al.Morfometria e rendimento da palma
forrageira ‘Gigante’ sob diferentes espaçamentos e doses de adubação orgânica. Brazilian Journal of Agricultural Sciences, v. 9, n. 1, p. 151-158. 2014.
FERREIRA, A. L. L.et al.Influência da calagem na adsorção de
fósforo em diferentes solos do estado do Ceará.Agropecuária Científica no Semiárido, v. 9, n. 4, p. 1-5, 2013.
FONTES, P. C. R. Nutrição mineral de hortaliças: horizontes e desafios para um agrônomo.Horticultura Brasileira, v. 32, n. 3, p. 247-253, 2014.
HEIDARI, M.; JAMSHID, P. Interaction between salinity and potassium on grain yield, carbohydrate content and nutrient uptake in pearl millet.ARPN Journal of Agricultural and Biological Science, v. 5, n. 6, p. 39-46, 2010.
KANO, C.; CARDOSO, A. I. I.; VILLAS BÔAS, R. L. Influência de doses de potássio nos teores de macronutrientes em plantas e sementes de alface.Horticultura Brasileira, v. 28, n. 3, p. 287-291, 2010.
LIMA, C. A. et al.Características físicoquímicas, polifenóis e flavonoides amarelos em frutos de espécies de pitaias comerciais e nativas do cerrado.Revista Brasileira de Fruticultura, v. 35, n. 2, p. 565-570, 2013.
MELO, A. S. et al. Crescimento vegetativo, resistência
estomática, eficiência fotossintética e rendimento do fruto da melancieira em diferentes níveis de água. Acta Scientiarum. Agronomy, v. 32, n. 1, p. 73-79, 2010.
NEDER, D. G. et al. Correlations and path analysis of morphological and yield traits of cactus pear accessions.Crop Breeding and Applied Biotechnology, v. 13, n. 1, p. 203-207, 2013.
NUNES, E. N. et al. Pitaia (Hylocereus sp.): uma revisão
para o Brasil.Gaia Scientia, v. 8, n. 1, p. 90-98. 2014. PONTES FILHO, F. S. T. et al. Comprimento de estacas e
concentrações de ácido indolbutírico (AIB) na propagação vegetativa de pitaia.Revista Ciência Agronômica, v. 45, n. 4, p. 46-51, 2014.
PRADO, R. M.; VIDAL, A. A. Efeito da omissão de macronutrientes em solução nutritiva sobre o crescimento e nutrição do milheto. Pesquisa Agropecuária Tropical, v. 38,
SILVA, J. A.et al.Composição mineral em cladódios de palma forrageira sob diferentes espaçamentos e adubações química.
Revista Brasileira de Ciências Agrárias, v. 7, p. 866-875, 2012.