RELATIONSHIPS BETWEEN SOIL CLASS AND
NUTRITIONAL STATUS OF COFFEE
PLANTATIONS
(1)Paulo Guilherme Salvador Wadt(2)
SUMMARY
Farm planning requires an assessment of the soil class. Research suggest that the Diagnosis and Recommendation Integrated System (DRIS) has the capacity to evaluate the nutritional status of coffee plantations, regardless of environmental conditions. Additionally, the use of DRIS could reduce the costs for farm planning. This study evaluated the relationship between the soil class and nutritional status of coffee plants (Coffea canephora Pierre) using the Critical Level (CL) and DRIS methods, based on two multivariate statistical methods (discriminant and multidimensional scaling analyses). During three consecutive years, yield and foliar concentration of nutrients (N, P, K, Ca, Mg, S, B, Zn, Mn, Fe and Cu) were obtained from coffee plantations cultivated in Espírito Santo state. Discriminant analysis showed that the soil class was an important factor determining the nutritional status of the coffee plants. The grouping separation by the CL method was not as effective as the DRIS one. The bidimensional analysis of Euclidean distances did not show the same relationship between plant nutritional status and soil class. Multidimensional scaling analysis by the CL method indicated that 93.3 % of the crops grouped into one cluster, whereas the DRIS method split the fields more evenly into three clusters. The DRIS method thus proved to be more consistent than the CL method for grouping coffee plantations by soil class.
Index terms: DRIS, critical level, plant nutrition, nutritional diagnosis, soil classification, oxisol, Coffea canephora.
RESUMO: RELACIONAMENTO ENTRE CLASSES DE SOLO E O ESTADO NUTRICIONAL DE LAVOURAS CAFEEIRAS
O planejamento agrícola requer a avaliação das classes de solos. Pesquisas têm demonstrado que o Sistema Integrado de Diagnose e Recomendação (DRIS) é capaz de avaliar o estado nutricional de lavouras de café, independentemente das condições
(1) Recebido para publicação em abril de 2003 e aprovado em março de 2005.
ambientais. Assim, o uso do DRIS no planejamento agrícola poderia reduzir custos. Este estudo avaliou a relação entre a classe de solo e o estado nutricional das plantas de café conilon (Coffea canephora Pierre), pelos métodos do Sistema Integrado de Diagnose e Recomendação (DRIS) e pelo Nível Crítico (CL), usando dois métodos de estatística multivariada (análise discriminante e análise de escalonamento multidimensional). Foram utilizados dados de plantios comerciais de café do estado do Espírito Santo, de três safras agrícolas consecutivas. Em cada ano, foram obtidos dados da produtividade e da concentração foliar de N, P, K, Ca, Mg, S, B, Zn, Mn, Fe and Cu das lavouras. A análise estatística discriminante mostrou que o tipo de solo foi determinante do estado nutricional das plantas de café. O agrupamento das lavouras pelo método do Nível Crítico foi inferior ao do método DRIS. A análise de escalonamento multidimensional das distâncias euclidianas não mostrou a mesma relação entre o estado nutricional da planta e a classe de solo. A análise de escalonamento multidimensional pelo método do Nível Crítico indicou que 93,3 % das lavouras foram agrupadas em um único grupamento, enquanto que, pelo método DRIS, as lavouras de café foram distribuídas em três grupamentos. O agrupamento das lavouras pelo método DRIS é mais consistente do que o agrupamento pelo método do Nível Crítico.
Termos de indexação: DRIS, nível crítico, nutrição de plantas, diagnose nutricional, classificação de solos, Latossolos, Coffea canephora.
INTRODUCTION
Farm planning requires an environmental assessment of the soil class since the group of characteristics determining a soil type will affect the growth conditions for plants in either qualitative or quantitative terms. If this premise is correct, environmental stratification should place plant groups with their proper nutritional characteristics for each environment.
“Conilon” coffee (Coffea canephora Pierre) has
been cultivated in two different environments in the North of the State of Espírito Santo (ES) based on geographic relief and soil type (Bragança & Alvarez V., 1990). Environment I (Barreiras) was characterized by soils derived from tertiary sediments. Yellow Latossol (LA) and Red Latossol (LV) were found in this area, with a topographic relief varying from flat to gentle sloping, comprising the counties of Linhares and Pinheiros. Environment II (Cristalino) was mainly derived from gneiss rocks, with a medium to high degree of metamorphism, originating from the archeozoic period. This parent material is rich in silica, of which the predominant minerals are quartz, alkaline feldspars and the biotite mica, leading to soils that are distinct from the soils of the first environment. In this second environment, Red-Yellow Latossol (LVA) and Red-Yellow Argissol (PVA) were predominant with a topographic relief that varies from steep sloping to mountainous. This area covers the counties of São Gabriel da Palha and Águia Branca (Bragança & Alvarez V., 1990).
The nutritional status of coffee plantations is traditionally determined by the Critical Level (CL) method. The Critical Level is defined as the
association between the element concentration in leaves and a higher intensity of certain physiological processes related to yield formation, such as photosynthesis (Malavolta et al., 1999).
Research suggests that the Diagnosis and Integrated Recommendation System (DRIS) is a superior plant analysis tool compared to the CL method (Beaufils, 1973). The reason is the independence presented by the nutritional diagnosis by DRIS of the concentration and dilution effects on plant growth (Sumner, 1977a). DRIS utilizes the ratios between pairs of nutrients, both macro and micro, and transforms the concentration values into indices that may vary between negative and positive. If the negative index demonstrates a high negative value, then the element will be more limiting. As the index becomes more positive (or less negative), the nutrient will become less limiting. This trend could continue until the nutrient reaches excessive levels and eventually becomes toxic. When the index value is zero, a nutritional balance has been reached and limitations are not expressed on either end of the spectrum. Consequently, the crop yield could be high (Malavolta et al, 1999).
different cultivars and phenological periods without establishing any relationship between the nutritional status, mineral acquisition, or phenological phase.
The objective of this study was to evaluate the relationships between soil class and nutritional status of the coffee plants (Coffea canephora Pierre)
using the Critical Level (CL) and Diagnosis and Recommendation Integrated System (DRIS) methods, based on two multivariate statistical methods (discriminant and multidimensional scaling analyses).
MATERIAL AND METHODS
The data set used in this study were compiled by Bragança & Alvarez V. (1990). It provides the N, P, K, Ca, Mg, S, B, Zn, Mn, Fe, and Cu concentration (g kg-1) of 157 foliar samples of coffee plants and
annual coffee productivity (60 kg bags per ha), collected on 58 coffee plantations from 1986/87 to 1988/89 in commercial coffee fields located northern Espírito Santo State, Brazil. The coffee’s nutritional status and local soil classes were determined by way of the leaf nutrient concentrations.
The coffee plantations consisted of 22 fields with Yellow Latossol (LA), two fields with Red Latossol (LV), 30 fields with Red-Yellow Latossol (LVA), and four fields with Red-Yellow Argissol (PVA). Environment I (Barreiras) comprises LA and LV soil classes and Environment II (Cristalino) contains LVA and PVA. The soil classification of Espírito Santo State was based on the Brazilian Soil Taxonomy and Classification System (Embrapa, 1999), which assumes soil genesis in a higher order and considers morphological characteristics at another level for discrimination of soils regarding their potential for agricultural use.
The coffee plants’ nutritional status was evaluated by the critical level (CL) (Leite, 1992) and by DRIS methods (Wadt et al., 1999). Using the CL method, coffee plants were classified as deficient or sufficient for each nutrient. Plants were considered deficient if the nutrient concentration was lower than the reference value, and sufficient if the nutrient concentration was the equal to or higher than the reference value (Leite, 1992). The reference values, in g kg-1, were the following: 28.4 for N, 1.2
for P, 20.2 for K, 13.0 for Ca, 3.3 for Mg, 2.4 for S; and in mg kg-1: 108 for Fe, 48 for B, 11 for Zn, 50 for
Mn, and 12 for Cu.
Following the coffee plants were recoded to contrast variables for each nutrient: nutrient deficiency was recoded as 0 (null), and nutrient sufficiency was recoded as 1 (one). By this procedure, mean values for the recoded CL were obtained and the status for each of the 58 fields was estimated. This value was used for the multivariate statistical analyses.
DRIS norms were defined using the mean and variance values for bivariate relationships among the low, medium, and high productivity subpopulations, and also the F test of variance for the low/high productivity bivariate relationships (Wadt et al., 1999). Medium productivity subpopulations were represented by coffee fields with productivity values between the mean ± 1.0 standard deviation of productivity of the base population. High and low subpopulations consisted of coffee plantations with the highest (the mean + 1.0 standard deviation of productivity) or the lowest productivity (the mean -1.0 standard deviation of productivity).
The F test was used for selecting bivariate relationships with the potential of discriminating “deficient” from “non-deficient” plants (Beaufils, 1973; Wadt et al., 1999). Bivariate relations with the highest F value between the direct and the inverse form were selected for the calculation of DRIS indices, based on an equation proposed by Jones (Jones, 1981). The bivariate relationships with F values higher than 10 % of significance were eliminated from the DRIS index calculations.
The DRIS indices were interpreted by the Nutrient Application Potential Response (NAPR) method (Wadt, 1996; Wadt et al., 1998), and were classified into five categories (Table 1). This classification was based on the probability of the best nutrient response in cases where the DRIS indices were the lowest and negative, as well as having a higher nutritional imbalance than other nutrients. In NAPR, calculated mean balance nutritional index comprised of the arithmetic mean of absolute values of DRIS indices. Computer calculations were done by a DRIS software (Wadt 1996).
The five categories of nutritional classification by the DRIS/NAPR method were the following: (1) limiting for deficiency with high probability, (2) limiting for deficiency with low probability, (3) balanced, (4) limiting for excess with low probability and (5) limiting for excess with high probability (Table 1) (Wadt et al., 1996). For each nutrient, coffee plants were recoded regarding the contrast variables. In this procedure, mean values for recoded NAPR were obtained, and the status for every nutrient in each of the 58 coffee plantations was estimated. These values were later utilized in multivariate statistical analyses.
The relationships between soil class and nutritional status of the coffee plants can be determined by statistical multivariate tools, such as multidimensional scaling analysis and discriminant analysis (Manly, 1994). Data for the nutritional status of Coffea canephora plants (interpreted by
and Cu, recoded as variables determined by the CL or DRIS/NAPR methods. In this statistical analysis, independent variables were selected based on Mahalanobis’ distance method, which maximizes this distance for the two closest groups. Afterwards, all independent variables were used simultaneously to discriminate among the five categories of the grouped variable, using the pooled “Within Groups Covariance Matrix” (SPSS, 1990). The results were displayed in a scatterplot showing cases that use the first two discriminant canonical functions as well as a summary that illustrated the tabulation of the observed versus predicted grouping. The measured/ real grouping was determined by the soil class from each field.
The second multivariate analysis was based on multidimensional scaling analysis, and the cases were represented in a bidimensional space based on Euclidean distances. Locations for the cases were estimated from matrices of distances between pairs of variables. The variables were N, P, K, Ca, Mg, S, Zn, B, Mn, Fe, and Cu, using recoded values determined by CL or DRIS/NAPR methods. In this statistical analysis, data were transformed using dissimilarity measures by the method of Euclidean distances. The values were then standardized before computing proximities, using the “Standard Deviation of 1” procedure (SPSS, 1990). A scatterplot displayed the results in bidimensional space and tables 1 to 4 present the scaling solutions that were calculated for each number in the range.
RESULTS AND DISCUSSION
The discriminant function analysis may separate two or more groups of individuals (such as
plantations cultivated in different soil classes), considering the measurements for these individuals in several variables (recoded values determined by CL or DRIS/NAPR methods). The data for a discriminant function analysis do not need to be standardized to have zero means and unit variances prior to the start of the analysis, as is usual with other multivariate analyses. This is because the outcome of a discriminant function analysis is not significantly affected by the scaling of individual variables. One approach to discrimination is based on Mahalanobis distances, where the mean vectors for the samples can be regarded as estimates of the true mean vectors for the groups. The Mahalanobis distances can be allocated to the group that it is closest to, despite this may or may not be the group that the individual actually came from. The percentage of correct allocations is a clear indication of how well groups can be separated using the available variables (Manly, 1994).
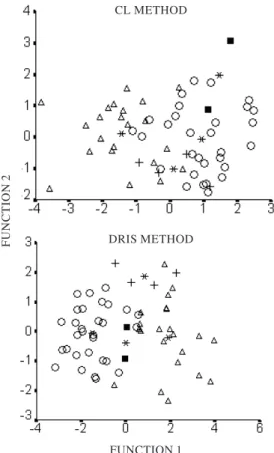
The application of discriminant analysis showed that the soil class was the main determinant of nutritional characteristics of the coffee plantations. Successful groupings based on the nutritional status were predicted by CL or DRIS method (Figure 1). However, groupings predicted by the CL method were weaker than those predicted by the DRIS/ NAPR method.
For the DRIS method, 81.3 % of the plantations were correctly classified, while for the CL method, 72.4 % of the plantations were in the correct class. Differences between the two methods were traced to the groupings of nutritional status for plants grown in the LVA and the PVA, based on the DRIS method (Table 2). The DRIS method grouped between 80 and 100 % of the plantations growing in LVA and PVA correctly, respectively, while the CL Table 1. Nutritional status and interpretation criterion for the DRIS indices by the Nutrient Application Potential Response method and the recoded value for multivariate analyses (INut = DRIS index for the nutrient and, mNBI = mean nutritional balance index)
(1) A positive response implies that nutrient addition increased plant growth rate and a negative response implies that the nutrient addition decreased plant growth rate (Wadt, 1996).
Nutritional status
Fertilizer potential response(1)
Interpretation criterion for DRIS indices
Recoded Value
High insufficiency Positive, highly probable INut < 0 and
|INut| > mNBI and
|INut| DRIS index is lower.
1
Insufficiency Positive, less probable INut < 0 and
|INut| > mNBI.
2
Balanced Null |INut| ≤ mNBI. 3
Excess Negative, less probable INut > 0 and
|INut| > mNBI.
4
High excess Negative, highly probable INut > 0 and
|INut| > mNBI and
|INut| DRIS index is higher.
method only grouped between 67–75 % of plantations growing in the same soil class correctly. For the other soil classes, both methods grouped the plantations in the same percentage. Regarding the environments, (Barreiras and Cristalino), the DRIS method correctly grouped 83.3 % of the plantations in Environment I (Barreiras) and 88.2 % of the plantations in Environment II (Cristalino). The CL method grouped 79.2 % of the plantations in Environment I and 76.5 % of the plantations in Environment II correctly. These results show that the DRIS method has a greater capacity to group coffee plantations regarding the soil class or the geological environment. For coffee plantations, Arboleta et al. (1988) and Wadt et al. (1999) concluded that the DRIS method allows a better interpretation of the leaf mineral content in coffee than the critical level method.
The total variation of 91.9 and 95.0 % was explained by the two first discriminant canonical functions of the CL and the DRIS methods, respectively. These results indicate that discriminate analysis is a useful tool for categorizing environmental conditions for Coffea canephora growth.
Multidimensional scaling constructs a “map” showing the relationships between a number of individuals, given only a table of distances between them. In other words, it may be possible to construct this “map” from a table of distances generated by the recoded values determined by CL or DRIS/NAPR methods of individual plantations. The “map” can be in two dimensions, if the individuals lie on a plane. Multidimensional scaling is especially useful as situations often arise where relationships between objects are not known (for example, soil class) but
Table 2. Classification table of the discriminate analysis using Mahalanobi´s distance for coffee crops based on nutritional status determined by the Critical Level method (CL) or by DRIS method (DRIS)
Predicted grouping(1)
Actual grouping CL DRIS
Soil(2) Plants Sum LA LV LVA PVA LA LV LVA PVA
LA no 22 17 1 0 4 17 0 1 4
% 77 5 0 18 77 0 5 18
LV no 2 0 2 0 0 0 2 0 0
% 0 100 0 0 0 100 0 0
LVA no 30 3 4 20 3 1 3 24 2
% 10 13 67 10 3 10 80 7
PVA no 4 1 0 0 3 0 0 0 4
% 25 0 0 75 0 0 0 100
(1) 72.4% or 83.3% of the coffee crops were correctly classified in the actual soil class by CL and DRIS methods, respectively. (2) LA: Yellow Latossol, LV: Red Latossol, LVA: Red-Yellow Latossol, PVA: Red-Yellow Argissol.
Figure 1. Scatterplot of Mahalanobis distances between coffee crops based on nutritional status by Critical Level method (CL method) and Diagnosis and Recommendation Integrated System method (DRIS method). (group centroids, ; PVA: Red-Yellow Argissol, +; LVA: Red-Yellow Latossol, O; LV: Red Latossol ; LA: Yellow Latossol, ).
FUNCTION 1
FUNCTION 2 DRIS METHOD
where a distance matrix can be estimated from the recoded values determined by CL or DRIS/NAPR methods (Manly, 1994).
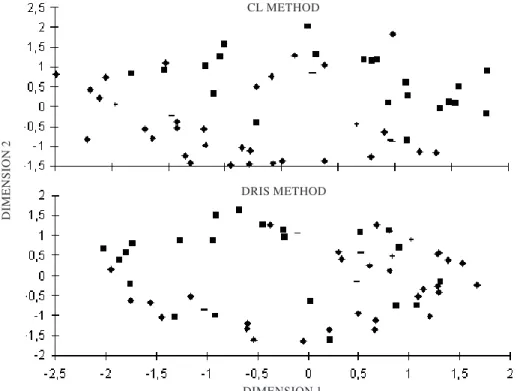
Bidimensional analysis of Euclidean distances (multidimensional scaling) did not show the same relationship between the nutritional status of coffee plantations and the soil class (Figure 2). Clusters predicted by CL and DRIS/NAPR method in multidimensional scaling analysis were weaker than those predicted by the discriminant analysis. Comparing the two diagnostic methods (CL and
Scaling solutions
CL DRIS
Soil(1) Environment
1 2 3 4 1 2 3 4
LA I - Barreiras 22 0 0 0 0 9 8 5
LV I - Barreiras 2 0 0 0 0 2 0 0
LVA II - Cristalino 26 1 1 2 3 20 6 1
PVA II - Cristalino 4 0 0 0 0 3 1 0
Sum 54 1 1 2 3 34 15 6
% 93.3 1.7 1.7 3.4 5.2 58.6 25.8 10.3
Table 3. Scaling solutions for the nutritional status of coffee crops by the multidimensional scaling analysis, based on Euclidean distances, determined by the Critical Level method (CL) or by the DRIS method (DRIS)
(1) LA: Yellow Latossol, LV: Red Latossol, LVA: Red-Yellow Latossol, PVA: Red-Yellow Argissol.
DRIS method), multidimensional scaling analysis by the CL method indicated 93.3 % of the plantations grouped in one cluster. However, when the DRIS method was used, the plantations were distributed in more clusters: cluster 1 and cluster 2 contained plantations of the LVA; cluster 4 had mainly plantations of the LA; and cluster 3 was intermediate, represented by the plantations on LA and LVA (Table 3).
Under field conditions, fertilizer management in these soils can minimize or intensify the differences
Figure 2. Scatterplot of bidimensional space analysis of Euclidean distances between coffee plantations based on the nutritional status evaluated by Critical Level method (CL method) or DRIS method. (LA: Yellow Latossol, ; LV: Red Latossol, +; LVA: Red-Yellow Latossol, ♦♦♦♦♦, PVA: Red-Yellow Argissol, -).
DIMENSION 1
DIMENSION 2
among soil classes that naturally affect plant nutrients, thus masking the soil class effects. During coffee establishment there was a positive linear relationship between yield and application of NPK fertilizer (Pavan et al., 1986). Fertilizer use is the probable reason why the LA was distributed in more than one cluster (Figure 2). Barreiras soils (LA and LV) consist of older sedimentary parent materials that date to the Tertiary, with a high weathering degree. Because of their lower buffer capacity, these soils are more susceptible to variations in fertility through fertilizer addition (Novais et al., 1998). Cristalino soils (Environment II) presented a more homogeneous nutritional status because the soils are derived from metamorphic rocks with higher fertility buffer capacity. They were therefore mainly grouped into one cluster (cluster 2) (Table 3).
Consequently, multidimentional scaling analysis was not a satisfactory method to group coffee plantations based on soil class or environmental conditions as determined by the CL or DRIS methods. This is probably because other variables not included in the analysis such as the applied fertilizers (Arboleta et al., 1988) and the management intensity variables (Nick, 1998) need to be considered.
The pedologic characteristics used in soil classification were determined by the nutritional status variation in coffee plantations, based on discriminant analysis and the DRIS method. This supposition justifies the environmental assessment of coffee plantations for the determination of the agricultural potential.
It is important to note that only one general DRIS norm was capable of recognizing the different nutritional status of coffee plantations in relation to each environment. However, it is likely that this data could be masked with the use of specific DRIS norms for each environment.
Beaulfils (1973) and Sumner (19787b) suggested that the DRIS method can be used irrespective of plant variety, age of plant sampled, position of leaf on the plant or soil conditions. To be universally applicable, a set of DRIS norms must be derived from a sample that represents the total population taken into consideration, such that the sample represents the entire range of site conditions and management practices. Rathfon & Burger (1991) working with Fraser fir Christmas trees and Jones (1981) working with sugarcane, developed DRIS norms representing the range of site and management conditions of the populations studied. The DRIS norms provided good predictive capacity of the plant nutrition in these test environments. However, Escano et al. (1981) and Wortmann (1992) suggested that the local calibration of the DRIS norms increases diagnostic accuracy.
The results of the present study corroborate the conclusions of previous authors (Beaufils, 1973;
Sumner, 1977b; Jones, 1981 Rathfon and Burger, 1991) regarding the universality of DRIS norms, in opposition to the conclusions of Escano et al. (1981) and of Wortmann et al. (1992), who stated that DRIS norms were dependent of environment conditions.
CONCLUSIONS
1. The nutritional status of coffee plantations in the State of Espírito Santo reflects the soil and pedologic characteristics.
2. When the soil class or environmental conditions were considered, the DRIS method presents a higher capacity to group coffee plantations than the Critical Level (CL) method.
ACKNOWLEDGEMENTS
To Eurípedes Malavolta, Raimound S. Pacovsky and Cara A. Rockwell for their dedication to the revision of the original paper.
LITERATURE CITED
ARBOLEDA, C.; ARCILA, J. & MARTINEZ, R. Sistema integrado de recomendación y diagnosis: una alternativa para la interpretación de resultados de analisis foliar en café. Agron. Colombiana, 5:17-30, 1988.
BEAUFILS, E.R. Diagnosis and Recommendation Integrated System (DRIS). Pietermaritzburg: University of Natal, 1973. 132p. (Soil Sci. Bulletin, 1)
BRAGANÇA, S.M. & ALVAREZ V., V.H. Avaliação do estado nutricional de café conilon (Coffea canephora) do norte do estado do Espírito Santo, através do Sistema Integrado de Diagnose e Recomendação (DRIS). Vitória, Empresa Capixaba de Pesquisa Agropecuária, 1990. 12p. (Pesquisa em Andamento, 57)
EMPRESA BRASILEIRA DE PESQUISA AGROPECUÁRIA -EMBRAPA. Centro Nacional de Pesquisa de Solos (Rio de Janeiro, RJ). Sistema Brasileiro de Classificação de Solos. Brasília, Embrapa Produção de Informação; Rio de Janeiro, Embrapa-SPI/Embrapa-CNPS, 1999. 412p.
ESCANO, C.R.; JONES, C.A. & UEHARA, G. Nutrient diagnosis in corn grown on Hydric Dystrandepts: II. Comparison of two systems of tissue diagnosis. Soil Sci. Soc. Am. J., 45:1140-1144, 1981.
JONES, C.A. Proposed modifications of the Diagnosis and Recommendation Integrated System (DRIS) for interpreting plant analyses. Comm. Soil Sci. Plant Anal., 12:785-794, 1981.
MANLY, B.F.J. Multivariate statistical methods. A primer. London, Chapman & Hall, 1994. 215p.
MALAVOLTA, E.; OLIVEIRA, S.A. & WADT, P.G.S. Foliar diagnosis: the status of the art. In: SIQUEIRA, J.O.; MOREIRA, F.M.S.; LOPES, A.S.; GUILHERME, L.R.G.; FAQUIN, V.; FURTINI NETO, A.E. & CARVALHO, J.G., eds. Inter-relação fertilidade, biologia do solo e nutrição de plantas. Viçosa, Sociedade Brasileira de Ciência do Solo. Lavras, Universidade Federal de Lavras/Departamento de Ciência do Solo, 1999. p.205-244.
NICK, J.A. DRIS para cafeeiros podados. Piracicaba, Escola Superior de Agricultura “Luiz de Queiroz”, 1998, 86p. (Tese de Mestrado)
NOVAIS, R.F.; SMITH, T.J. & BARROS, N.F. A natureza não tem palito de fósforo! Queima rápida ou mineralização lenta (nem sempre tão lenta) de resíduos florestais? Bol. Inf. SBCS, 23:22-29, 1998.
PAVAN, M.A.; CHAVES, J.C.D. & MESQUITA FILHO, L. Manejo da adubação para formação de lavouras cafeeiras. Pesq. Agropec. Bras., 21:33-42, 1986.
RATHFON, R.A. & BURGER, J.A. Diagnosis and Recommendation Integrated System (DRIS) nutrient norms for Fraser Fir Christmas Trees. For. Sci., 37:998-1010, 1991b.
STATISTICAL PROFESSIONAL SOCIAL SCIENCE SOFTWARE – SPSS. Chicago, SPSS Inc. Headquarters, 1990.13 floppy disks.
SUMNER, M.E. Use of the DRIS system in foliar diagnosis of crops at high yield levels. Comm. Soil Sci. Plant Anal., 8:251-268, 1977a.
SUMNER, M.E. Preliminary N, P, and K foliar diagnostic norms for soybeans. Agron. J., 69:226-230, 1977b.
WADT, P.G.S. Os métodos da Chance Matemática e do Sistema Integrado de Diagnose e Recomendação (DRIS) na avaliação nutricional de plantios de eucalipto. Viçosa, Universidade Federal de Viçosa, 1996, 123p. (Tese de Doutorado) WADT, P.G.S.; NOVAIS, R.F.; ALVAREZ V., V.H. & BARROS,
N.F. Teores de cálcio trocável no solo e status de cálcio em árvores adultas de eucalipto. In: CONGRESSO LATINO-AMERICANO DE CIÊNCIA DO SOLO, 13., Águas de Lindóia, 1996. Anais. Águas de Lindóia, Sociedade Brasileira de Ciência do Solo/Sociedade Latino Americana de Ciência do Solo, 1996. CD-ROOM.
WADT, P.G.S.; NOVAIS, R.F.; ALVAREZ V., V.H.; FONSECA, S.; BARROS, N.F. & DIAS, L.E. Três métodos de cálculo do DRIS para avaliar o potencial de resposta à adubação de árvores de eucalipto. R. Bras. Ci. Solo, 22:661-666, 1998. WADT, P.G.S.; NOVAIS, R.F.; ALVAREZ V., V.H. & BRAGANÇA, S.M. Alternativas de aplicação do DRIS à cultura de café conilon (Coffea canephora Pierre). Sci. Agric., 56:83-92, 1999.