http://dx.doi.org/10.1590/1516-635x1701109-116
Technical Note
Author(s)
Dadalt JCI Butzen FMII Ribeiro AMLII Renz SVII Kessler A de MII Penz Júnior AMII
I Departamento de Nutrição e Produção Animal – VNP/FMVZ/USP, Universidade de São Paulo, Av. Duque de Caxias Norte, 225, Campus Pirassununga, Pirassununga, SP, 13635900, Brasil.
II Departamento de Zootecnia, Universidade Federal do Rio Grande do Sul, Av. Bento Gonçalves, 7712, Porto Alegre, RS, 91540-000, Brasil.
Mail Address
Corresponding author e-mail address Dadalt JC
Departamento de Nutrição e Produção Animal – VNP/FMVZ/USP, Universidade de São Paulo, Av. Duque de Caxias Norte, 225, Campus Pirassununga, Pirassununga, SP, 13635900, Brasil. Phone: 19-983661367.
E-mail: [email protected]
Keywords
Feed efficiency, nutritional strategies, profitability.
Submitted: October/2014 Approved: August/2014
ABSTRACT
Two experiments were simultaneously carried out to compare feed formulation models: a linear model for minimum cost with a nonlinear model for maximum profitability for one-to 42-d-old broilers. One-d-old male or female Cobb 500 broilers (n=2368) were allocated to one of the two trials according to sex. The experiments were performed simultaneously in an experimental poultry farm. Two housing densities
were used: high density (HDH), with 14 birds/m2, and low density (LDH),
with 10 birds/m2. The following treatments were evaluated: linear feed
formulation and LDH (LF10); nonlinear formulation and LDH (NF10); linear formulation and HDH (LF14); and nonlinear formulation and HDH (NF14). A completely randomized design with four treatments of eight replicates each was applied. Performance and cost per kg of poultry were evaluated. Both formulation systems promoted similar broiler performance. However, the high-density feed using linear formulation reduced body weight in 42-d-old males, but not when nonlinear formulation was used. The NF10 treatment yielded the worst feed conversion ratio (p<0.05) and the lowest cost/kg broiler (p<0.05) for both sexes. The results demonstrate that the nutritional program that yields the best performance is not always the most economical one.
INTRODUCTION
Broiler feeds were for a long time formulated based on linear models that, although prioritize minimum feed costs, do not take into account some important factors such as bird density, market weight, physical space, and feed energy and protein levels (Afrouziyeh et al, 2011). On the other hand, an increasing number of researchers understands that, in order to work under the concept of precision feeding, nonlinear models, which take into account the factors mentioned above, need to
be employed (Penz Jr. et al., 2009).
Nonlinear formulation models help breeders to determine the best time to change diets, both from economic and environmental perspectives, identifying optimal marketing strategy and determining
nutrient levels that maximize animal performance (Van Milgen et
al., 2008). As these models use a mechanistic approach, they have a
higher degree of complexity to describe live performance, enabling more precise responses and preventing the inconvenience of linearly representing the responses that follow the law of diminishing returns
(Oviedo-Rondón, 2007). According to Afrouziyeh et al. (2010), the
economic interpretation of animal feeding has largely been ignored in the context of nutrition and feed formulation programs.
applicability of each model need to be evaluated to provide the greatest cost-benefit to poultry breeders (Oviedo-Rondón, 2002).
This study aimed at comparing the results of two nutrition programs for broilers: one based on minimum-cost linear formulation (LF), and the other based on maximum-profitability nonlinear formulation (NF).
MATERIAL AND METHODS
One-day-old male and female commercial Cobb500broilers were distributed by sex (n=1,184per sex) in two experiments simultaneously carried out in an experimental broiler house. The facility was divided into two rooms, one per sex, with 40 pens/room. Each
pen, housing 40 birds, made up one experimental unit, and was equipped a feeder and nipple drinker. A completely randomized design off our treatments with eight replicates each. Birds were reared until 42 days of age.
Animal care and use protocol was reviewed and approved by the Ethics Committee on Animal Research of the Federal University of Rio Grande do Sul, in compliance with animal welfare requirements.
Diets were formulated using two systems: a linear minimum cost system, according to the nutritional
recommendations proposed by Rostagno et al.
(2000) and the NRC (1994) (Model Company Feed
Management Systems, called Brill Formulation®), and
an online ar maximum profitability system (Model
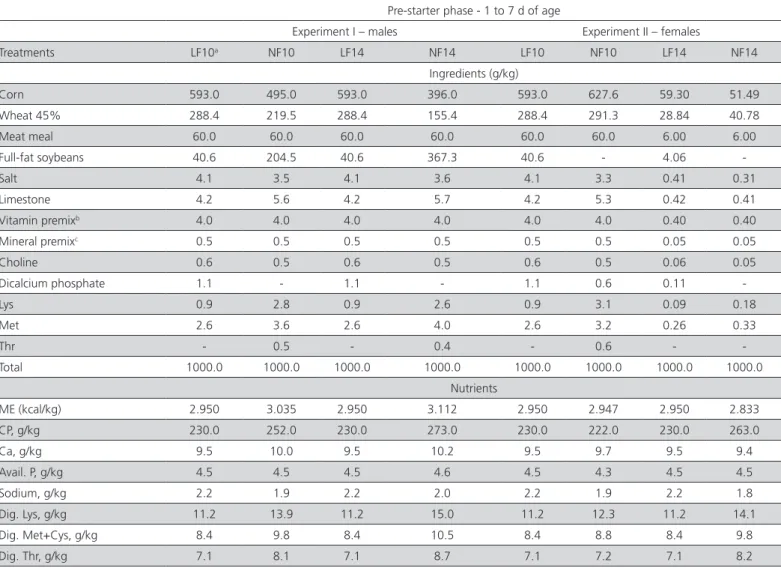
Table 1 – Ingredient composition, calculated energy value, and nutrient content of pre-starter diets formulated according to linear (LF) or nonlinear (NF) systems fed to male and female broilers.
Pre-starter phase - 1 to 7 d of age
Experiment I – males Experiment II – females
Treatments LF10a NF10 LF14 NF14 LF10 NF10 LF14 NF14
Ingredients (g/kg)
Corn 593.0 495.0 593.0 396.0 593.0 627.6 59.30 51.49
Wheat 45% 288.4 219.5 288.4 155.4 288.4 291.3 28.84 40.78
Meat meal 60.0 60.0 60.0 60.0 60.0 60.0 6.00 6.00
Full-fat soybeans 40.6 204.5 40.6 367.3 40.6 - 4.06
-Salt 4.1 3.5 4.1 3.6 4.1 3.3 0.41 0.31
Limestone 4.2 5.6 4.2 5.7 4.2 5.3 0.42 0.41
Vitamin premixb 4.0 4.0 4.0 4.0 4.0 4.0 0.40 0.40
Mineral premixc 0.5 0.5 0.5 0.5 0.5 0.5 0.05 0.05
Choline 0.6 0.5 0.6 0.5 0.6 0.5 0.06 0.05
Dicalcium phosphate 1.1 - 1.1 - 1.1 0.6 0.11
-Lys 0.9 2.8 0.9 2.6 0.9 3.1 0.09 0.18
Met 2.6 3.6 2.6 4.0 2.6 3.2 0.26 0.33
Thr - 0.5 - 0.4 - 0.6 -
-Total 1000.0 1000.0 1000.0 1000.0 1000.0 1000.0 1000.0 1000.0
Nutrients
ME (kcal/kg) 2.950 3.035 2.950 3.112 2.950 2.947 2.950 2.833
CP, g/kg 230.0 252.0 230.0 273.0 230.0 222.0 230.0 263.0
Ca, g/kg 9.5 10.0 9.5 10.2 9.5 9.7 9.5 9.4
Avail. P, g/kg 4.5 4.5 4.5 4.6 4.5 4.3 4.5 4.5
Sodium, g/kg 2.2 1.9 2.2 2.0 2.2 1.9 2.2 1.8
Dig. Lys, g/kg 11.2 13.9 11.2 15.0 11.2 12.3 11.2 14.1
Dig. Met+Cys, g/kg 8.4 9.8 8.4 10.5 8.4 8.8 8.4 9.8
Dig. Thr, g/kg 7.1 8.1 7.1 8.7 7.1 7.2 7.1 8.2
a LF10, Linear formulation (10 birds/m2); NF10, Nonlinear formulation (10 birds/m2); LF14, Linear formulation (14 birds/m2); NF14, Nonlinear formulation (14 birds/m2).
b Supplied per kg of diet: vit. A, 8000 IU; vit. D3, 2000 IU; vit. E, 18 mg; vit. K3, 1.8 mg; vit. B1, 1.8 mg; vit. B2, 6 mg; vit. B6, 2.8 mg; vit. B12, 0.012 mg; pantothenic acid, 15 mg;
niacin, 40 mg; folic acid, 1 mg; biotin, 0.06 mg.
Company Wala Group, called Camera®), which
determines feeding strategies for broilers aiming at a pre-specified final weight at the lowest feed cost.
The nonlinear formulation program was calibrated using data from previous broiler experiments carried out at the same facility and under similar rearing conditions. Factors related to the environment, temperature, humidity, relative air velocity, genetic strain, sex, bird density, number of feeding phases, and broiler market weight and age were considered. The model was adjusted by adapting the acceleration of the growth rate coefficient of the birds (variation of the growth rate over time), and by evaluating the simulated results with previously obtained results for the same climatic, genetic, and chronological
variables. Based on these values, mean performance was estimated for both sexes at 42 d of age, using the expected performance of male, female, and straight-run flocks provided in the Cobb500 manual (Cobb, 2003).
Two population densities were used in each experiment: high density, with 14 birds/m2, and low density, with 10 birds/m2. The treatments, thereby, consisted of linear feed formulation and low density (LF10); nonlinear formulation and low density (NF10); linear formulation and high density (LF14); and nonlinear formulation and high density (NF14). The composition of the experimental diets is presented in Tables 1 to 4.
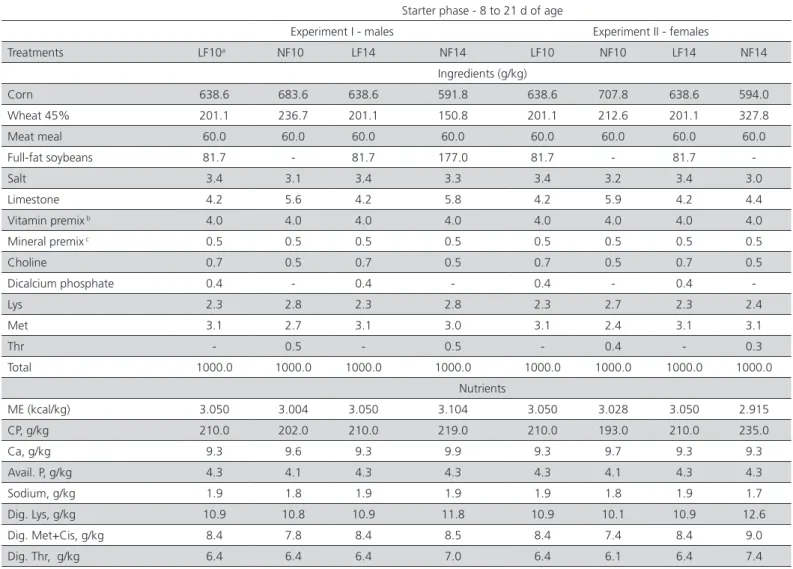
Table 2 – Ingredient composition, calculated energy value, and nutrient content of starter diets formulated according to linear (LF) or nonlinear (NF) systems fed to male and female broilers.
Starter phase - 8 to 21 d of age
Experiment I - males Experiment II - females
Treatments LF10a NF10 LF14 NF14 LF10 NF10 LF14 NF14
Ingredients (g/kg)
Corn 638.6 683.6 638.6 591.8 638.6 707.8 638.6 594.0
Wheat 45% 201.1 236.7 201.1 150.8 201.1 212.6 201.1 327.8
Meat meal 60.0 60.0 60.0 60.0 60.0 60.0 60.0 60.0
Full-fat soybeans 81.7 - 81.7 177.0 81.7 - 81.7
-Salt 3.4 3.1 3.4 3.3 3.4 3.2 3.4 3.0
Limestone 4.2 5.6 4.2 5.8 4.2 5.9 4.2 4.4
Vitamin premix b 4.0 4.0 4.0 4.0 4.0 4.0 4.0 4.0
Mineral premix c 0.5 0.5 0.5 0.5 0.5 0.5 0.5 0.5
Choline 0.7 0.5 0.7 0.5 0.7 0.5 0.7 0.5
Dicalcium phosphate 0.4 - 0.4 - 0.4 - 0.4
-Lys 2.3 2.8 2.3 2.8 2.3 2.7 2.3 2.4
Met 3.1 2.7 3.1 3.0 3.1 2.4 3.1 3.1
Thr - 0.5 - 0.5 - 0.4 - 0.3
Total 1000.0 1000.0 1000.0 1000.0 1000.0 1000.0 1000.0 1000.0
Nutrients
ME (kcal/kg) 3.050 3.004 3.050 3.104 3.050 3.028 3.050 2.915
CP, g/kg 210.0 202.0 210.0 219.0 210.0 193.0 210.0 235.0
Ca, g/kg 9.3 9.6 9.3 9.9 9.3 9.7 9.3 9.3
Avail. P, g/kg 4.3 4.1 4.3 4.3 4.3 4.1 4.3 4.3
Sodium, g/kg 1.9 1.8 1.9 1.9 1.9 1.8 1.9 1.7
Dig. Lys, g/kg 10.9 10.8 10.9 11.8 10.9 10.1 10.9 12.6
Dig. Met+Cis, g/kg 8.4 7.8 8.4 8.5 8.4 7.4 8.4 9.0
Dig. Thr, g/kg 6.4 6.4 6.4 7.0 6.4 6.1 6.4 7.4
a LF10, Linear formulation (10 birds/m2); NF10, Nonlinear formulation (10 birds/m2); LF14, Linear formulation (14 birds/m2); NF14, Nonlinear formulation (14 birds/m2).
b Supplied per kg of diet: vit. A, 7000 IU; vit. D3, 1500 IU; vit. E,15 mg; vit. K3, 1.6 mg; vit. B1, 1.6 mg; vit. B2, 5 mg; vit. B6, 2.6 mg; vit. B12, 0.010 mg; pantothenic acid,13 mg;
niacin, 35 mg; folic acid, 0.7 mg; biotin, 0.06 mg.
Feed intake and body weight were weekly measured and evaluated cumulatively for the periods of1 to 21d and1 to 42d of age. At the end of the experiment, two birds per experimental unit, with weight representative of the average weight of the experimental unit, were sacrificed. Average feed intake (FI), feed conversion ratio (FCR), body weight (BW), feed cost per kg of broiler (R$/kg), and carcass yield, without feathers, viscera or head, were calculated.
Data were analyzed using the GLM procedure of SAS statistical package (1998). AsNF10 and NF14 were different diets, treatments were not analyzed according to a factorial arrangement. Data were submitted to analysis of variance, and means were compared by the t-test.
RESULTS AND DISCUSSION
During the period of1 to 21 d of age, males fed the NF14 diet presented lower food intake than the other treatments (Table 5). However, as their average body weight was similar to the other groups, this treatment promoted the best FCR (p<0.05). The high protein (273 g/kg) and energy contents (3,112 kcal/kg) of the NF14 diet up to 7 d was noteworthy in this phase. On the other hand, diet NF10 resulted in the worst FCR and the lowest BW in this period, also with high protein (252 g/kg), but lower energy (3,035 kcal/kg) levels as NF14 during the same period. This diet had very narrow CP:ME ratio, and after this phase, had less
protein and energy than all the others. Reginatto et al.
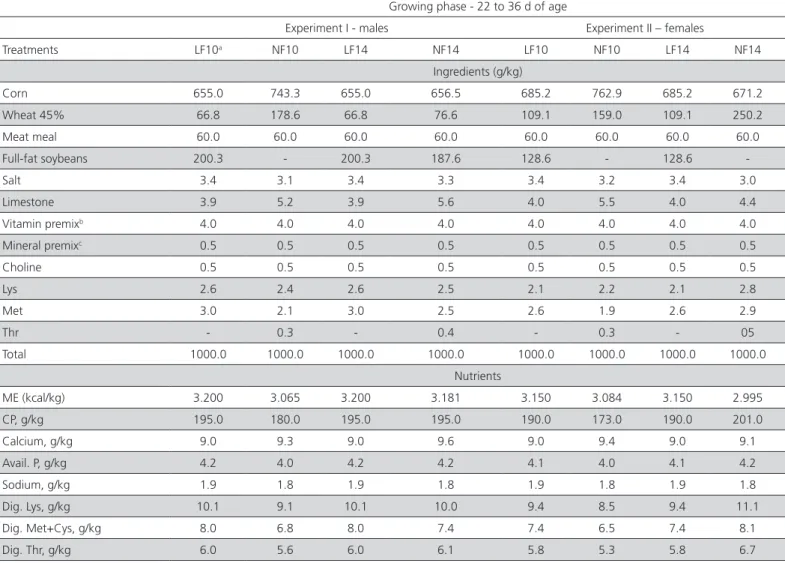
Table 3 – Ingredient composition, calculated energy value, and nutrient content of grower diets formulated according to linear (LF) or nonlinear (NF) systems fed to male and female broilers.
Growing phase - 22 to 36 d of age
Experiment I - males Experiment II – females
Treatments LF10a NF10 LF14 NF14 LF10 NF10 LF14 NF14
Ingredients (g/kg)
Corn 655.0 743.3 655.0 656.5 685.2 762.9 685.2 671.2
Wheat 45% 66.8 178.6 66.8 76.6 109.1 159.0 109.1 250.2
Meat meal 60.0 60.0 60.0 60.0 60.0 60.0 60.0 60.0
Full-fat soybeans 200.3 - 200.3 187.6 128.6 - 128.6
-Salt 3.4 3.1 3.4 3.3 3.4 3.2 3.4 3.0
Limestone 3.9 5.2 3.9 5.6 4.0 5.5 4.0 4.4
Vitamin premixb 4.0 4.0 4.0 4.0 4.0 4.0 4.0 4.0
Mineral premixc 0.5 0.5 0.5 0.5 0.5 0.5 0.5 0.5
Choline 0.5 0.5 0.5 0.5 0.5 0.5 0.5 0.5
Lys 2.6 2.4 2.6 2.5 2.1 2.2 2.1 2.8
Met 3.0 2.1 3.0 2.5 2.6 1.9 2.6 2.9
Thr - 0.3 - 0.4 - 0.3 - 05
Total 1000.0 1000.0 1000.0 1000.0 1000.0 1000.0 1000.0 1000.0
Nutrients
ME (kcal/kg) 3.200 3.065 3.200 3.181 3.150 3.084 3.150 2.995
CP, g/kg 195.0 180.0 195.0 195.0 190.0 173.0 190.0 201.0
Calcium, g/kg 9.0 9.3 9.0 9.6 9.0 9.4 9.0 9.1
Avail. P, g/kg 4.2 4.0 4.2 4.2 4.1 4.0 4.1 4.2
Sodium, g/kg 1.9 1.8 1.9 1.8 1.9 1.8 1.9 1.8
Dig. Lys, g/kg 10.1 9.1 10.1 10.0 9.4 8.5 9.4 11.1
Dig. Met+Cys, g/kg 8.0 6.8 8.0 7.4 7.4 6.5 7.4 8.1
Dig. Thr, g/kg 6.0 5.6 6.0 6.1 5.8 5.3 5.8 6.7
a LF10, Linear formulation (10 birds/m2); NF10, Nonlinear formulation (10 birds/m2); LF14, Linear formulation (14 birds/m2); NF14, Nonlinear formulation (14 birds/m2).
b Supplied per kg of diet: vit. A, 2500 IU; vit. D3, 700IU; vit. E, 7 mg; vit. K3, 0.7 mg; vit. B1, 1.6mg; vit. B2, 2.5 mg; vit. B6, 2.6mg; vit. B12, 0.006 mg; pantothenic acid, 9 mg; niacin,
26 mg, folic acid, 0.7 mg; biotin, 0.06 mg.
(2000) observed that low energy diets fed to broilers between1to 21 d of age impaired their performance. Considering the entire experimental period, theNF10
diet yielded the worst FCR (p<0.05). The observed changes in feed intake from1 to 21 d were due to the nutritional profile of diets, since the NF14 diet had
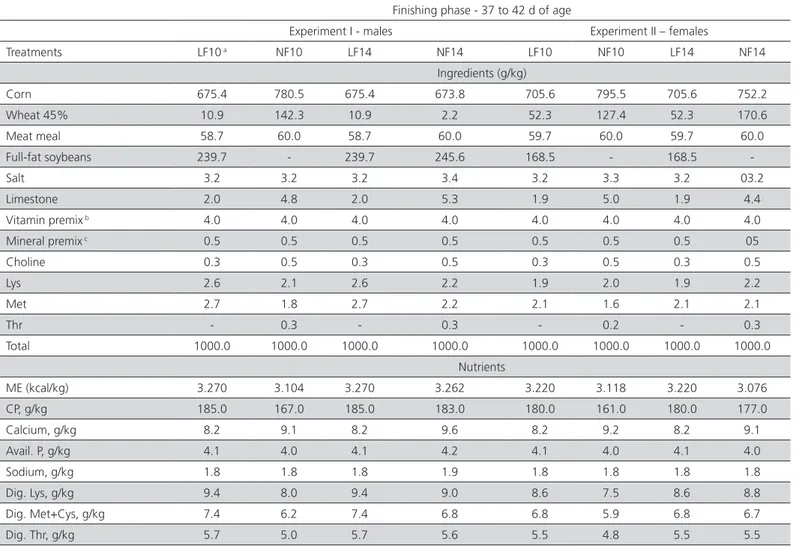
Table 4 – Ingredient composition, calculated energy value, and nutrient content of finisher diets formulated according to linear (LF) or nonlinear (NF) systems fed to male and female broilers.
Finishing phase - 37 to 42 d of age
Experiment I - males Experiment II – females
Treatments LF10 a NF10 LF14 NF14 LF10 NF10 LF14 NF14
Ingredients (g/kg)
Corn 675.4 780.5 675.4 673.8 705.6 795.5 705.6 752.2
Wheat 45% 10.9 142.3 10.9 2.2 52.3 127.4 52.3 170.6
Meat meal 58.7 60.0 58.7 60.0 59.7 60.0 59.7 60.0
Full-fat soybeans 239.7 - 239.7 245.6 168.5 - 168.5
-Salt 3.2 3.2 3.2 3.4 3.2 3.3 3.2 03.2
Limestone 2.0 4.8 2.0 5.3 1.9 5.0 1.9 4.4
Vitamin premix b 4.0 4.0 4.0 4.0 4.0 4.0 4.0 4.0
Mineral premix c 0.5 0.5 0.5 0.5 0.5 0.5 0.5 05
Choline 0.3 0.5 0.3 0.5 0.3 0.5 0.3 0.5
Lys 2.6 2.1 2.6 2.2 1.9 2.0 1.9 2.2
Met 2.7 1.8 2.7 2.2 2.1 1.6 2.1 2.1
Thr - 0.3 - 0.3 - 0.2 - 0.3
Total 1000.0 1000.0 1000.0 1000.0 1000.0 1000.0 1000.0 1000.0
Nutrients
ME (kcal/kg) 3.270 3.104 3.270 3.262 3.220 3.118 3.220 3.076
CP, g/kg 185.0 167.0 185.0 183.0 180.0 161.0 180.0 177.0
Calcium, g/kg 8.2 9.1 8.2 9.6 8.2 9.2 8.2 9.1
Avail. P, g/kg 4.1 4.0 4.1 4.2 4.1 4.0 4.1 4.0
Sodium, g/kg 1.8 1.8 1.8 1.9 1.8 1.8 1.8 1.8
Dig. Lys, g/kg 9.4 8.0 9.4 9.0 8.6 7.5 8.6 8.8
Dig. Met+Cys, g/kg 7.4 6.2 7.4 6.8 6.8 5.9 6.8 6.7
Dig. Thr, g/kg 5.7 5.0 5.7 5.6 5.5 4.8 5.5 5.5
a LF10, Linear formulation (10 birds/m2); NF10, Nonlinear formulation (10 birds/m2); LF14, Linear formulation (14 birds/m2); NF14, Nonlinear formulation (14 birds/m2).
b Supplied per kg of diet: vit. A, 2500 IU; vit. D3, 700 IU; vit. E, 7 mg; vit. K3, 0.7 mg; vit. B1,1.6 mg; vit. B2, 2.5 mg; vit. B6, 2.6mg; vit. B12, 0.006 mg; pantothenic acid, 9 mg;
niacin, 26 mg; folic acid, 0.7 mg; biotin, 0.06 mg.
c Supplied per kg of diet: selenium,0.2mg; iodine,0.15mg; iron,100mg; copper,16mg; zinc, 140 mg; manganese, 150 mg.
Table 5 – Average feed intake (AFC), feed conversion ratio (FCR), and body weight (BW) of male broilers housed at two different densities from 1 to 21 d and from 1to 42 d of age, and fed linear(LF) or nonlinear formulation (NF) diets
Period 1 to 21 d of age 1 to 42 d of age
Treatment AFI1 FCR BW1 AFI1 FCR BW1
LF104 1186a 1.280b 922a 4424a 1.696a 2590ª
LF14 1165a 1.276b 913a 4268b 1.706a 2502b
NF10 1178a 1.333c 881b 4475a 1.801b 2486b
NF14 1102b 1.223a 902ab 4278b 1.687a 2546ab
P2 0.0001 0.0001 0.0007 0.0001 0.0001 0.0006
CV3 (%) 2.1 1.3 1.8 1.7 1.0 1.9
a, b, c Means in the same column with different superscripts are significantly different byTukey’s test (p>0.05). 1 Values expressed in g/kg; 2 Statistical probability; 3 Coefficient of
the greatest nutrient density, decreasing feed intake. Between1 to 42 d, the lowest feed intake continued to be observed in the NF14 group, along with the LF14, due to the high nutrient density. The latter may have caused reduced feed intake due to the competition among birds, since the LF10 diet was exactly the same in terms of nutritional composition, but led to greater feed intake (p<0.05). According to Leeson (1996), high CPand energy dietary levels reduce feed intake in broilers, as occurred with the NF14 diet. On the other
hand, Kamran et al. (2008), observed that BW and
FCR linearly worsed and feed intake increased when dietary energy and protein were reduced. These results
are in agreement with those of Nguyen et al. (2012),
who showed that high energy and protein levels resulted in better FCR; and with results by Hernández
et al. (2012), who verified that low protein levels led
to worse FCR.
In the present experiment, the BW of male broilers fed LF and housed at high density was reduced,
consistently with the results of Tong et al. (2012). These
results suggest that maintaining nutritional density and increasing housing density prevent obtaining good performance. On the other hand, when diets with higher protein and energy levels were fed up to 21 d (NF14), high bird density did not reduce BW.
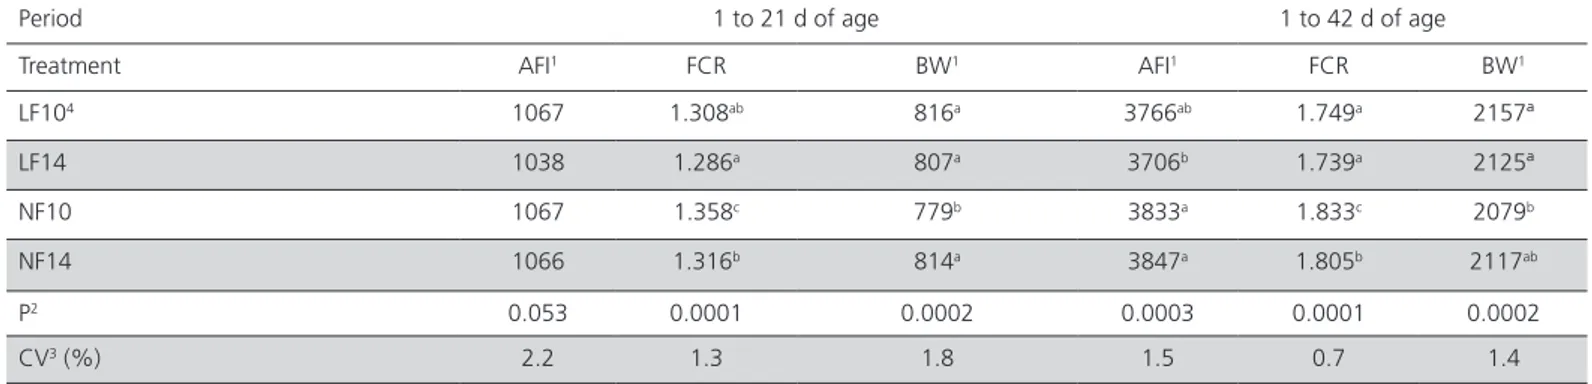
Females showed no feed intake differences at 21 d of age (p>0.005). It was observed that the NF14 diet fed to females was also high in protein, similarly to the male diet, but contained less energy. This may have prevented females from reducing their feed intake. The NF10 diet resulted in the worst female performance at this as shown by the worst FCR and the lowest BW (p<0.05), similarly to the results obtained with males. This diet had the lowest nutrient density. At 42 d of age, the females in this treatment continued to show worse FCR and lower BW. Independently of housing
density, there were no differences in the performance at 42 d of age of females fed the linear formulation diet, despite the 40% higher bird density. These results
are different from the findings of Zuowei et al. (2011),
who showed that females housed at high density had poorer FCR and lower BW at 42 d of age. The lower BW
of females (Kolling et al. 2005) compared with males
may explain why, in the case of females, increasing bird density and maintaining the same nutritional density did not affect performance.
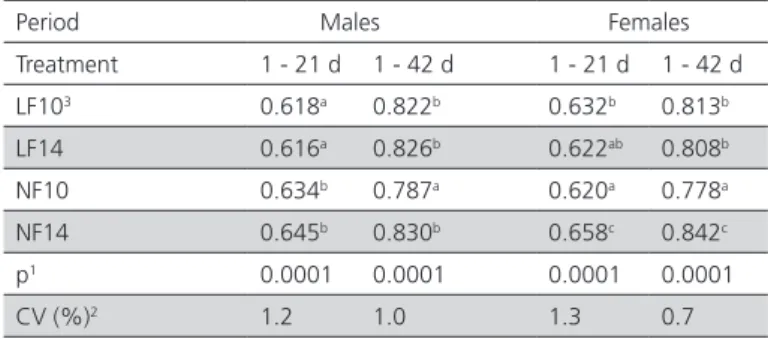
The cost per kg of male and female chickens produced (R$/kg) is shown in Table7. The cost of 21-d-old males fed LF diets was lower cost compared with those fed NF diets at both densities. This result was not observed at 42 d of age, when the cost of males fed the NF10diet was lower than the cost of the other treatments. The high energy and protein concentration of the pre-starter diets may be the cause of the high cost observed in the nonlinear formulation. According
to Mack et al. (2000), although linear programs may be
effective to lower the cost of the feeds with increasing energy, the response is curvilinear, decreasing as nutrient density increases.
In the present study, the good performance of males fed the NF14 diet reduced the cost from 1to 42 d, which was similar to the cost obtained with the LF diet. Moreover, the low nutrient density observed in the NF10 diet in almost all phases led to the lowest cost from1 to 42 d, although resulted in the worst FCR during the entire period. This is an interesting result, since companies put much emphasis on FCR, not considering that if the feed is cheaper, higher feed intake and worse FCR do not necessarily lead
to bad economic outcomes. Guevara et al. (2004)
had previously emphasized that reduced feed costs may seem to be attractive, but the consequent loss in performance may have negative effects on profitability.
Table 6 – Average feed intake (AFI), feed conversion ratio (FCR), and body weight (BW) of female broilers housed at two different densities from 1 to 21 d and from 1to 42 d of age, and fed linear(LF) or nonlinear formulation (NF) diets
Period 1 to 21 d of age 1 to 42 d of age
Treatment AFI1 FCR BW1 AFI1 FCR BW1
LF104 1067 1.308ab 816a 3766ab 1.749a 2157ª
LF14 1038 1.286a 807a 3706b 1.739a 2125ª
NF10 1067 1.358c 779b 3833a 1.833c 2079b
NF14 1066 1.316b 814a 3847a 1.805b 2117ab
P2 0.053 0.0001 0.0002 0.0003 0.0001 0.0002
CV3 (%) 2.2 1.3 1.8 1.5 0.7 1.4
a, b, c Means in the same column with different superscripts are significantly different byTukey’s test(p>0.05). 1 Values expressed in g/kg; 2 Statistical probability; 3 Coefficient of
The lowest cost was obtained at 21and 42 d with females fed the NF10 diet; the highest cost was obtained with NF14-fed females. It is observed that the NF determined very low nutritional levels for females reared at low density compared with males. The optimization of the results and the accuracy rate of nonlinear models is dependent on the calibration of these models.
The lack of fit may explain some of the results found in this study. According Lovatto & Sauvant (2001), modeling is primarily an attempt to integrate different phenomena, being limited human resources and materials available and/or to those used to build it. At the high-density housing condition, formulation greatly increased the concentration of diets; however, there was no remarkable improvement in the performance enabling cost reduction in female broiler production. Similarly, in males, although NF10 showed worse FCR and lower WB, it also had lower costs. Different from
our results, Verspecht et al. (2011) suggested that
higher density ensured greater profitability in broiler
production, which is in agreement with Skrbić et al.
(2009), who found that the stocking density directly influenced the economic efficiency of the poultry sector.
Table 7 – Cost per live weight kg of male and female broilers (R$/kg),reared at two densities from 1to 21 d and from 1to 42 d of age, and fed linear(LF) or nonlinear formulation (NF) diets
Period Males Females
Treatment 1 - 21 d 1 - 42 d 1 - 21 d 1 - 42 d
LF103 0.618a 0.822b 0.632b 0.813b
LF14 0.616a 0.826b 0.622ab 0.808b
NF10 0.634b 0.787a 0.620a 0.778a
NF14 0.645b 0.830b 0.658c 0.842c
p1 0.0001 0.0001 0.0001 0.0001
CV (%)2 1.2 1.0 1.3 0.7
a, b, c Means in the same column with different superscripts are significantly different by
Tukey’s test (p>0.05). 1 Statistical probability; 2 Coefficient of variation; 3 LF10, Linear
formulation (10 birds/m2); LF14, Linear formulation (14 birds/m2); NF10, Nonlinear
formulation (10 birds/m2); NF14, Nonlinear formulation (14 birds/m2).
The results of male and female carcass yield, presented in Table 8, show that male carcasses were not significantly different (p>0.05) among treatments. The results presented here are consistent with those
reported by Tong et al. (2012). As for the females, those
fed the LF10diet had lower carcass yield compared with those fed the NF14 diet. These results are difficult to explain, because birds of both treatments did not present different BW at 42 d.
Table 8 – Carcass yield of male and female broilers reared at two densities and fed linear (LF) or nonlinear formulation (NF) diets
Carcass yield (g/kg) Treatment/variable Males Females
LF103 787.0 776.0b
LF14 785.0 779.0ab
NF10 781.0 781.0ab
NF14 785.0 788.0a
P1 0.69 0.04
CV (%)2 1.7 1.5
a, b Means in the same column with different superscripts are significantly different by
Tukey’s test (p>0.05). 1 Statistical probability; 2 Coefficient of variation; 3 LF10, Linear
formulation (10 birds/m2); LF14, Linear formulation (14 birds/m2); NF10, Nonlinear
formulation (10 birds/m2); NF14, Nonlinear formulation (14 birds/m2).
CONCLUSIONS
Neither model applied was clearly better than the other for formulating male and female diets for broilers reared at high or in low stocking density.
The nonlinear formulation of diets for males at high stocking density seems to be better adjusted than that for females reared under the same conditions.
Better FCR does not necessarily mean lower production costs.
REFERENCES
Afrouziyeh M, Shivazad M, Chamani M, Dashti G. Use of nonlinear programming to determine the economically optimal energy density in laying hens diet during phase 1. African Journal of Agricultural Research 2010; 5(20):2770-2777.
Afrouziyeh M, Shivazad M, Chamani M, Dashti G, Amirdahri S. Use of nonlinear programming to determine the economically optimal energy density in laying hens diet during phase 2. Poultry Science Association 2011;20(1):50-55.
Cobb Broiler Nutrition Guide Siloam Springs: Cobb-Vantress; 2003. Available from: www.cobb-vantress.com.
Guevara VR. Use of Nonlinear Programming to Optimize Performance Response to Energy Density in Broiler Feed Formulation.Poultry Science 2004;83:147-151.
Hernández F, López M, Martínez s, Megías MD, Catalá P, Madrid J. Effect of low-protein diets and single sex on production performance, plasma metabolites, digestibility, and nitrogen excretion in 1- to 48-day-old broilers. Poultry Science 2012; 91(3):683-692.
Kamran Z, Sarwar M, Nisa M, Nadeem MA, Mahmood S, Babar ME, Ahmed S. Effect of low-protein diets having constant energy-to-protein ratio on performance and carcass characteristics of broiler chickens from one to thirty-five days of age. Poultry Science 2008;87:468-474.
Leeson S, Caston L, Summers JD. Broiler Response to Energy or Energy and Protein Dilution in the Finisher Diet. Poultry Science 1996;75:522-528.
Lovatto PA, Sauvant D. Modelagem aplicada aos processos digestivos e metabólicos do suíno. Ciência Rural 2001;31(4):663-670.
Mack S, Hohler D, Pack M. Evaluation of dose response data and implications for commercial formulation of broiler diets. Proceedings Australian Poultry Science Symposium;2000; Sydney. Australia p.82–87.
National Research Council.Nutrient requirements of Poultry. 9th ed. rev. Washington: National Academic Press; 1994.
Nguyen TTH, Bouvarel I, Ponchant P, Van der Werf HMG. Using environmental constraints to formulate low-impact poultry feeds. Journal of Cleaner Production 2012; 28:215-224.
Oviedo-Rondón EO. Optimización de laProducción Avícola por Medio de Modelos Matemáticos. Indústria Avícola 2002;32-36.
Oviedo-Rondón EO. Modelagem por compartimentos para integrar e comunicar conhecimento em nutrição. Revista Brasileira de Zootecnia 2007;36:305-313.
Penz Jr. AM, Bruno D, Fugueiredo A. Nutrição de frangos - Mudanças de paradigmas para o futuro. Anais da Conferência FACTA 2009 de Ciência e Tecnologia Avícola; 2009; Porto Alegre, Rio Grande do Sul. Brasil.
Reginatto MF, Ribeiro, AML, Penz Jr. AM, Kessler AM, Krabbe EL. Efeito da Energia, Relação Energia: Proteína e Fase de Crescimento Sobre o
Desempenho e Composição de Carcaça de Frangos de Corte. Brazilian Journal of Poultry Science 2000;2:229-238.
Rostagno HS, Albino LFT, Donzele JL, Gomes PC, Ferreira AS, Oliveira RF, Lopes DC. Tabelas brasileiras para aves e suínos: composição de alimentos e exigências nutricionais. Viçosa: Universidade Federal de Viçosa; 2000. 141p.
SAS Institute. SAS user’sguide. 7th ed. Cary; 1998.
Skrbić Z, Pavlovski Z, Lukić M. Stocking density – factor of production
performance, quality and broiler welfare. Biotechnology in Animal Husbandry 2009;25(5-6):359-372.
Tong HB, Lu J, Zou JM, Wang Q, Shi SR. Effects of stocking density on growth performance, carcass yield, and immune status of a local chicken breed. Poultry Science 2012;91:667-673.
Van Milgen J, Valancogne A, Dubois S, Dourmad JY, Sève B, Noblet J. Inraporc: a model and decision support tool for the nutrition of growing pigs. Animal Feed Science and Technology 2008;143:387-405.
Verspecht A, Vanhonacker F, Verbeke W, Zoons J, Van Huylenbroeck G. Economic impact of decreasing stocking densities in broiler production in Belgium.Poultry Science 2011;90:1844-1851.