F
ACULDADE DEE
NGENHARIA DAU
NIVERSIDADE DOP
ORTOAutomatic Extraction of Mobility
Activities in Microblogs
Ricardo César de Sales Ferreira
Master Degree in Informatics and Computing Engineering Supervisor: Rosaldo José Fernandes Rossetti (PhD) Second Supervisor: Eduarda Mendes Rodrigues (PhD)
Automatic Extraction of Mobility Activities in Microblogs
Ricardo César de Sales Ferreira
Master Degree in Informatics and Computing Engineering
Approved in oral examination by the committee:
Chair: Doctor Pedro Alexandre Guimarães Lobo Ferreira do Souto External Examiner: Doctor Pedro Manuel Henriques da Cunha Abreu Supervisor: Doctor Rosaldo José Fernandes Rossetti
Abstract
The management and planning of public transport, urban planning and Marketing decision making are everyday activities and they are influenced by the mobility of people. So the problem we face is that to make a good urban planning, management of transport networks and even marketing strategies, we need to know the mobility patterns of people. For this, there are several sources such as surveys, census data, among others. The sources of information for urban areas are varied, but not complete. It is in this context that we want this project of dissertation to be a more complete source of mobility intentions, as much as it will present a more intuitive way than the existing sources.
Previously sources of information that might reflect the patterns that we want to get were not abundant.
Now, alongside the growth of information on the Internet, coupled with a greater use of social networks, there are several sources of knowledge capable of extracting this data set so that the information might have value to the user. Thus, with this dissertation, we intend to extract infor-mation from these sources, filter and treat it so that we may obtain an amount of knowledge about the activities of mobility. We intend to report the obtained results in the form of an intuitive and user friendly web interface.
This document is itself an information source and it is the result of a study of related work in the area of the information extraction and current techniques. In this document we also describe the solution implemented.
We evaluated a random sample of messages from Twitter to be classified as containing mobility activities or not and the results were a precision of 82.7 % and a recall of 62 %. It means that our priority was to improve precision than recall. In other words, we preferred to be correct in the messages that we classify as mobility rather than getting almost all the mobility messages, thus we improved our algorithm in that way.
The greatest motivation for this dissertation is exactly the fact that it aims to contribute to a better planning and actual decisions for our country.
Resumo
A gestão e planeamento dos transportes públicos, o planeamento urbano e a tomada de decisões de Marketing são actividades do quotidiano e que são influenciados pela mobilidade das pessoas. Assim, o problema com que nos deparamos é que, para que seja possível fazer um bom planea-mento urbano, planeaplanea-mento e gestão de redes de transportes e mesmo estratégias de marketing, precisamos de conhecer padrões de mobilidade das pessoas. Para tal existem diversas fontes como inquéritos, dados de censos, entre outros. Ou seja, as fontes de informação, para áreas urbanas são variadas, mas não completas. É nesse âmbito que pretendo que o projecto desta dissertação seja mais uma fonte de padrões ou intenções de mobilidade, de uma forma muito mais intuitiva do que as fontes actualmente existentes.
Antigamente fontes de informação que pudessem reflectir os padrões e intenções que pretende-mos obter não eram abundantes.
Actualmente, com o crescimento de informação na Internet, aliado ao uso mais intenso das Redes Sociais, há diversas fontes passíveis de extracção do conhecimento desse conjunto de da-dos para que a informação possa ter valor para o utilizador. Deste modo, com esta dissertação, pretende-se extrair informação dessas fontes, filtra-la e trata-la de modo a que possamos obter con-hecimento sobre as actividades de mobilidade das pessoas. Pretendemos comunicar os resultados sob a forma de uma interface web intuitiva e user friendly.
Este documento assume-se, assim, como uma fonte de documentação de toda a pesquisa efec-tuada sobre o tema e trabalhos relacionados na área da extracção de informação, bem como das técnicas actuais. A metodologia e solução implementada.
Foi avaliada uma amostra aleatória de mensagens do Twitter para ser classificada como con-tendo actividades de mobilidade ou não, e os resultados obtidos foram de uma precisão de 82,7 % e um Recall de 62 %. Isso significa que a nossa prioridade foi melhorar a precisão ao invés de Recall. Por outras palavras, preferimos ser corretos nas mensagens que classificamos como a mobilidade ao invés de tentar obter praticamente todas as mensagens de mobilidade e perder em termos de precisão.
A maior motivação deste trabalho é exactamente o facto de ser uma dissertação que visa con-tribuir para um melhor planeamento e decisões actuais e do nosso país.
Acknowledgements
I would like to thank to all the people that were involved directly or indirectly in this dissertation. Firstly, I would like to thank my supervisor, Prof. Rosaldo Rossetti and second supervisor Prof. Eduarda Rodrigues for all the cooperation througout this year.
As this dissertation was developed in cooperation with SAPO Labs, I would like to thank all the people working there, those who were able to help me in current doubts. I still want to thank them for the workplace that I always had there to work.
I want to thank too to Maria Carneiro for reviewing this document.
Finally I would like to thank my family and my friends that were always capable of encourag-ing me and sharencourag-ing ideas and thoughts.
“We are what we repeatedly do. Excellence, therefore, is not an act but a habit.”
Contents
1 Introduction 1
1.1 Scope . . . 1
1.2 Problem . . . 2
1.3 Goals . . . 3
1.4 Methodological Approach and Expected Contributions . . . 3
1.5 Document Structure . . . 4
2 Literature Review 5 2.1 Background . . . 5
2.1.1 Microblogging . . . 5
2.1.2 Sources of Data . . . 6
2.1.3 Text Mining and Information Extraction . . . 9
2.1.4 Text Refining and Knowledge Distillation . . . 10
2.1.5 Preprocessing for Text Mining . . . 11
2.1.6 Classifiers . . . 14
2.1.7 Visualization . . . 15
2.2 Related Work . . . 16
2.2.1 Detecting Mobility in Social Media . . . 16
2.2.2 Information Extraction . . . 16
2.2.3 Visualization . . . 19
2.2.4 Previous Related Projects at FEUP . . . 22
2.3 Most Relevant Topics . . . 24
3 Twitter: The Chosen Microblog 25 3.1 Followers . . . 25 3.2 Business Model . . . 26 3.3 Spam . . . 27 3.4 Usage Statistics . . . 27 3.5 Geographical Distribution . . . 29 3.6 Twitter API . . . 29 4 Problem Modeling 31 4.1 Mobility Activities vs Places . . . 32
4.2 Problem Phases . . . 33
4.2.1 Collecting Data . . . 33
4.2.2 Getting Usefull Information from Tweets . . . 34
CONTENTS 5 Implemented Approach 35 5.1 Architecture . . . 35 5.2 Initial Database . . . 36 5.3 Filtering . . . 37 5.4 Preprocessing . . . 38 5.5 Information Extraction . . . 38 5.6 Categorization . . . 39 5.7 Interface . . . 40 6 Results 43 6.1 Test Methodology . . . 43 6.2 Evaluation . . . 45
7 Conclusions and Future Work 47
References 49
List of Figures
2.1 Internet users by language . . . 7
2.2 Website content languages . . . 8
2.3 Proccess of Data Mining to identify Patterns . . . 10
2.4 A text mining framework . . . 11
2.5 The steps for Stemming Portuguese Language . . . 13
2.6 Twitter Sentiment interface . . . 17
2.7 Result list of Twitter Sentiment application . . . 18
2.8 Twitteuro Main Interface . . . 20
2.9 Cristiano Ronaldo detailed information . . . 20
2.10 Japan’s 2011 Disasters . . . 21
2.11 Google WorldMap visualization . . . 21
2.12 We Feel Fine - World Map visualization . . . 22
2.13 Roel Nelles - Activity World Map . . . 23
3.1 Twitter’s User Interface . . . 25
3.2 Personal Twitter Overview Page . . . 26
3.3 Percentage of spammy tweets posted per day is way down . . . 27
3.4 Twitter’s Growth . . . 28
3.5 Geographical Distribution of Twitter Users . . . 29
4.1 Microblogs . . . 31
4.2 Activity Definition . . . 32
4.3 Development Phases . . . 33
5.1 System Architecture . . . 35
5.2 Multiple Boxes envolving tweets from Portugal . . . 36
5.3 Schemma of Initial Database . . . 37
5.4 List of expressions to identify mobility activities . . . 37
5.5 Input and Output of the second phase - Mobility Messages . . . 38
5.6 Identifying activity algorithm . . . 39
5.7 Schemma of the Database cointaining the results obtained . . . 40
5.8 Visualization Map implemented . . . 41
6.1 Relation Between Precision and Recall . . . 44
LIST OF FIGURES
List of Tables
2.1 Summary of Social Network Services . . . 6
2.2 Social Networks Market Share . . . 7
2.3 Top 10 Global Markets by Average Social Networking Hours per Visitor, October 2011 . . . 9
LIST OF TABLES
Abbreviations
API Application Programming Interface DM Data Mining
IE Information extraction IR Information retrieval
KDD Knowledge Discovery in Databases ML Machine learning
SNS Social Network Services SVM Support Vector Machines TA Text analysis
Chapter 1
Introduction
This first section aims at introducing the scope, problem and goals of this dissertation, as also to describe the outline of this document. It is expected that you should be able to understand the sci-entific appeal of this research work as well as the issues arising. The scope or the knowledge areas to be explored in this work, the potential application fields will be also identified in this chapter. How is this project expected to advance in the current state of the start? What are the practical expected outcomes of the results produced? These are issues we expect to address throughout this dissertation.
1.1
Scope
In few years, the Internet has consolidated itself as a very powerful platform that has changed the way we do business, and the way we communicate. The Internet, as no other communication medium, has given globalized dimension to the world. Internet has become the Universal source of information for millions of people, at home, at school, at work, everywhere [Gro08].
Therefore, nowadays, it is very common that people share in different social networks their needs, activities, preferences as much as other stuff. That is why the extraction of information from the Internet started to grow a lot, so that we can get and learn with the big amount of available information.
Nowadays Knowledge Extraction and Data Mining are two areas of great interest and it is very important to use the available information to help decision making. Nowadays the information presented in the social media could be very useful, because if we understood the frequency that people travel from one place to another, for example to work, we could obtain a comparison between the time that usually people go to work from one city to another. This way we developed an application that can be very useful for urban planning, planning of transport networks and even for planning marketing strategies.
Actually we face a problem to make a good urban planning, management of transport network planning and even marketing strategies. That is why we need to know patterns or intentions of
Introduction
mobility. And how is this done? There are several sources such as surveys, census data [EST02], for example. Information sources for urban areas are varied, but not complete.
The social mobility as a result of new rhythms and lifestyles that cities have provided in the contemporary world, appears in Matosinhos, for high mobility indices generated for reasons other than work or education in favor of leisure and shopping. These new phenomena emerging mobil-ity in segments such as women and the elderly, give rise to new challenges regarding the urban planning and transport, as they represent movements more irregular, heterogeneous and diver-sified. Thus require solutions more individualized integrated policies and more complex legal regulations, which unequivocally managing traffic alone cannot solve [Tel04].
This dissertation tackles this kind of problems by adding the information of the mobility of people gathered by extracting important information from the great amount of information lost in the social media. We hope that this information can help the responsible institutions to solve the problems of urban planning and public transportation.
The expected output of this work is a web interface in which one can see the main activities related with mobility, from the classes identified, in each region of Portugal. Thus, the mobility patterns identified will be very useful to the definition of the strategies already mentioned.
1.2
Problem
Previously sources of information that might reflect the patterns of mobility were not abundant. That is the problem we are facing: the lack of information about mobility activities.
Now, with the increase of information on the Internet, coupled with greater use of social net-works, there are several sources of knowledge capable of extracting this data set so that the infor-mation might have value to the user. This extraction process is called Inforinfor-mation Retrieval.
To extract information about mobility activities there are several microblogs where people write about their experiences and intentions. Microblogs "allow users to exchange small elements of content such as short sentences, individual images, or video links" [Kap11].
We choose Twitter as our source of information data and we face the problem of how to develop a system that can process all the messages from Twitter, and automatically classify them as mobility activities or not and then show the identified classes of mobility activities in a map.
Starting from this point it is possible to identify more issues related with the problem identified. It is intended that the information to search should be in Portuguese and to do it that way we should be able to know the most common verbs related to mobility and the prepositions and connectors that are usually prior to the activities related to mobility.
From Twitter it is expected that we can face some difficulties as for example: • The location of the messages.
• Small percentage of messages in Portuguese in the whole messages.
• Existence of negative and conditional sentences to be taken into count in the algorithm. 2
Introduction
1.3
Goals
With the development of this dissertation we intent to reach the following goals:
So the first goal is to extract the messages from Twitter. The next is to preprocess the messages in order to automatically transform it into correct and workable text. The third main goal is to filter the messages that really match the classes of mobility and test the results to improve the algorithm. The last main goal is to communicate the results in an intuitive interface, so that the user can make decisions based on that. That way the results are shown on a map, so that the end user can see, for each type of mobility activities, their predominance in Portugal, without the need to look to a boring list or something else. This assumes crucial importance because the information is essentially space-temporal.
The fact that this project will help in the daily decision making and the challenge to try to filter the information in a way that makes it useful, those are the bigger motivations of this dissertation. In fact, the motivation in application terms is exactly the great potential of this application for the studied areas, such as urban planning, management of transport networks planning and even planning marketing strategies.
1.4
Methodological Approach and Expected Contributions
The system that fits this dissertation is divided into three main modules that followed our approach. The module of the information extraction from Twitter, then the module to preprocess the mes-sages and implement rules and algorithms to identify the mobility activities and the module of the interface to communicate the results obtained in a map.
Another module and important part of the solution implemented are the results and metrics that evaluate the classification system, such as, precision and recall that are the fraction of retrieved instances that are relevant, and the fraction of relevant instances that are retrieved, respectively.
The information retrieval area is an area with a lot of research nowadays. There are several projects related with mobility, but with this dissertation we want to add useful information ex-tracted from microblogs about mobility in Portuguese to the sources that the Portuguese public transports, marketing and urban planning use to make some decisions.
That way, our contribution is a system of information extraction that automatically identifies mobility activities in microblogs (we did the system based on Twitter, but it could be used another microblog with the used database schema, with only a few changes in the preprocessing module of the messages).
The database schema will be detailed further in Chapter 5.
We do not only expect to develop an information extraction system but also a map interface to communicate the results in an easier way to the end user.
Introduction
1.5
Document Structure
This document is structured in seven main chapters, being this first one the introduction.
Chapter 2comprises the background and related work for this dissertation. So, for each one, we will divide in sources of information data from social media, techniques to extract and classify information and visualization of the results.
From Twitter, the chosen source of information, it will be presented its business model, user statics, political impact and how to interact with the API. Chapter 3will comprise all the infor-mation about Twitter, because it is important to understand the chosen microblog.
Before explaining the algorithms used and the methodology followed, the problem will be modeled in parts and explained the important terms to understand the algorithms followed for the implementation of the system. It comprises Chapter 4.
Chapter 5deals with the methodology used for the implemented solution that includes the process, technologies, implementation decisions, tools and algorithms.
Then chapter 6 will contain the main results of the system developed. As an information extraction system it is fundamental to analyze the precision and recall to try to make it better with the rules implemented in the system.
The last chapter contains the main conclusions and conttibutions of this research, the future perspectives and work. It also has an analysis of the proposed goals. That last part is really important as we can explain how this work can be extended. Another important point in the conclusions chapter is review and identify the good practices did and the things that we should improve if this thesis only started from now on.
Chapter 2
Literature Review
In this chapter we describe the background in information extraction area and mobility information as it represents what is needed to know and learn for this dissertation. Additionally related works will be presented in the same area, as they tried to solve the focused problem or similar ones in a way that can help us. To do this, for each part, it will be presented the sources of information data from social media, techniques to extract and classify information and visualization of mobility results.
2.1
Background
In the following subsections of this section are described the matters that are important to have present and to learn in order to respond to the proposed goals. Firstly it will be explained the defi-nition of Microblogging and discussed the sources of information data, followed by the techniques to preprocess the messages and to extract and identify patterns of mobility activities.
2.1.1 Microblogging
Microblogging is a relatively new form of communication in which users can describe their current status in short posts distributed by instant messages, mobile phones, email or the Web. Finin et al[FT07] found that people use microblogging to talk about their daily activities and to seek or share information. The microblogging tools provide a light-weight, easy form of communication that enables users to broadcast and share information about their activities, opinions and status.
Microblogging tools facilitate easily sharing status messages either publicly or within a social network.
So, there are several tools and applications for microblogging, such as, Twitter, Tumblr, Face-book status, and many others that are not so popular.
Literature Review
2.1.2 Sources of Data
Starting from the top, various types of social network services (SNS) on the Internet have been fastly growing during the last decade. ICQ and Messenger introduced the concept of having internet connection based on friends and allowed real time chats (messages). But these kinds of applications were merely reflection of the social connections of the users’ daily lives. So these applications do not provide information about friends of friends and it is not available via an API that allows a developer to use the shared data.
Nowadays some of the most popular social network services are Facebook, Twitter, Google Plus, among others.
Facebook is a website that allows its members to share information and connect to new friends by their existing friends. This feature is very powerful in the sense that a group of mutual friends can be identified before a user accepts a new person as a friend. For a user, a friend of a friend would be preferred over an unknown person. This nature of expanding the relationships on Face-book provides a sense of security.
On the other hand, Twitter, adopts a different philosophy about expanding the network. In Twitter the concept is about having followers, subscribing to other users without their approvals as followers. This asymmetrical relationship encourages announcements of messages to a massive amount of other users. In addition, Twitter limits the number of characters per message to a maximum of 140 characters.
These services provide application programming interfaces (APIs) that allow external users to access their databases via codes. From Twitter it is possible to get all the messages in real time and all the information about the user, such as his name, picture and location. In Facebook the basic information of a user it is not available for a developer [Dev12] which represents a huge limitation for us to choose this social network.
Table 2.1summarizes the nature of each major Social Network. Table 2.1: Summary of Social Network Services
SNS Main Base Relationship Structure API Empashis Messenger/ICQ Desktop Mutual No Chatting Facebook Website/Mobile App Mutual Yes Social Utility Twitter Website/Mobile App Asymmetrical Yes Short Messages
In terms of Market Share, Facebook leads by a huge amount, followed next by Twitter, as we can see in the Table 2.2. The provided information is stated according to ComScore, from November 2011 [Eld11].
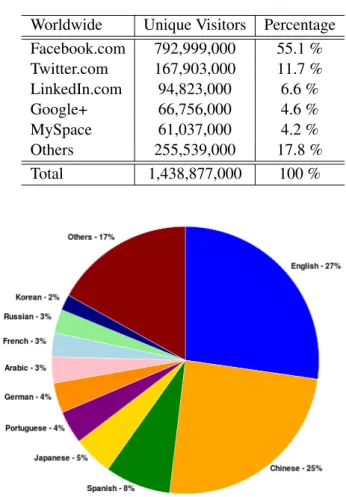
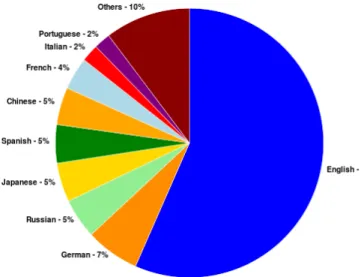
And what about Internet users by language? It is expected that Portuguese is not often used. In the next illustrations we can see the percentage of Portuguese (represented by the color purple) among the users (2.1) [Sta10] and websites (2.2) [W3T12].
It is possible to see that only English, Chinese, Spanish and Japanese have more percentage than Portuguese.
Literature Review
Table 2.2: Social Networks Market Share Worldwide Unique Visitors Percentage Facebook.com 792,999,000 55.1 % Twitter.com 167,903,000 11.7 % LinkedIn.com 94,823,000 6.6 % Google+ 66,756,000 4.6 % MySpace 61,037,000 4.2 % Others 255,539,000 17.8 % Total 1,438,877,000 100 %
Figure 2.1: Internet users by language
Web-based social networking services make it possible to connect people who share interests and activities across political, economic, and geographical borders [Lip07]. Through e-mail and instant messaging, online communities are created where a gift economy and reciprocal altruism are encouraged through cooperation. Information is particularly suited to gift economy, as infor-mation is a non-rival good and can be gifted at practically no cost. It is here where the context of this dissertation fits [Hey07].
Facebook and other social networking tools are increasingly the object of scholarly research. Scholars in many fields have begun to investigate the impact of social networking websites, inves-tigating how such websites may play into issues of identity, privacy,[Acq05] social capital, youth culture, and education [Boy08].
Several websites are beginning to tap into the power of the social networking model for phi-lanthropy. Such models provide a means for connecting otherwise fragmented industries and small organizations without the resources to reach a broader audience with interested users[Sil07]. Social networks are providing a different way for individuals to communicate digitally. These communities of hypertexts allow for the sharing of information and ideas, an old concept placed
Literature Review
Figure 2.2: Website content languages
in a digital environment.
2.1.2.1 Growing of each Social Network
Social networking accounted for nearly 1 in every 5 minutes spent online globally in October 2011, ranking as the most engaging online activity worldwide. Social networking sites now reach 82 % of the world’s Internet population age 15 and older that accessed the Internet from a home or a work computer, representing 1.2 billion users around the globe.
In October, Facebook reached more than half (55 percent) of the world’s global audience and accounted for 1 in every 7 minutes spent online around the world and 3 in every 4 minutes in social networking.
In recent years, micro blogging has taken hold as a popular social networking activity on a global scale. In October, Twitter reached 1 in 10 Internet users worldwide, growing 59 percent in the past year. Other popular micro blogging destinations seeing rapid adoption include Chinese website Sina Weibo, with its audience growing 181 percent in the past year to rank as the tenth largest social network in October. Tumblr, which ranked twelfth worldwide in audience size, grew 172 % in the past year.
Although young users age 15-24 still represent the most highly-engaged segment of social net-workers, with an average of 8 hours per visitor spent in the category in October, social networking is catching on among older age segments across the globe. In fact, people aged 55 and older rep-resented the fastest-growing age segment in global social networking usage, with the penetration of social networks in the segment increasing nearly 10 percentage points since July 2010 to 80 percent in October 2011.
In the U.S.A., 64 percent of smartphones users accessed social networking sites at least once in October 2011, with 2 in 5 smartphones owners connecting via social networking nearly every
Literature Review
day. In the EU 45 percent of smartphones owners accessed social networks on their mobile devices during the month, with nearly 1 in 4 doing so on a near daily basis.
comScore [Rad11] reports that the widespread adoption of social networking highlights the global appeal of this online activity. Of the 43 markets individually, 41 markets saw at least 85 percent of their respective online populations visit social networking sites in October 2011.
Analysis of the most highly engaged global social networking markets revealed that Israel led all countries with visitors spending an average of more than 11 hours on social networking sites during the month. This information is detailed in the following Table 2.3.
Table 2.3: Top 10 Global Markets by Average Social Networking Hours per Visitor, October 2011 Country Average Hours per Visitor Spent on Social Networking Sites
Israel 11.1 Argentina 10.7 Russia 10.4 Turkey 10.2 Chile 9.8 Philippines 8.7 Colombia 8.5 Peru 8.3 Venezuela 7.9 Canada 7.7 Worldwide 5.7
In the next subsections it will be explained the techniques to identify patterns of mobility or activity.
2.1.3 Text Mining and Information Extraction
Text mining concerns looking for patterns in unstructured text. The related task of Information Extraction (IE) is about locating specific items in natural-language documents. The problem of text mining, i.e. discovering useful knowledge from unstructured or semi-structured text, is attracting increasing attention.
KDD and IE are both topics of significant recent interest. KDD considers the application of sta-tistical and machine-learning methods to discover novel relationships in large relational databases. IE concerns locating specific pieces of data in natural-language documents, thereby extracting structured information from free texts.
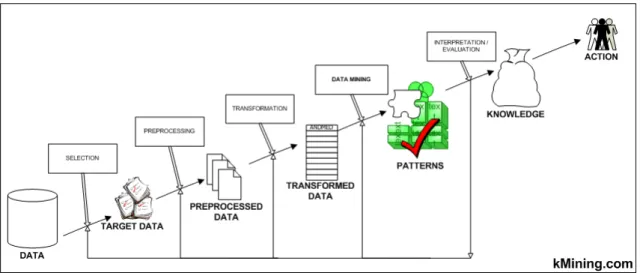
Traditional data mining assumes that the information to be “mined” is already in the form of a relational database. Unfortunately, for many applications like this one, electronic information is only available in the form of free natural-language documents rather than structured databases and that is what is called Text Mining. Since IE addresses the problem of transforming a corpus of textual documents into a more structured database, the database constructed by an IE module can be provided to the KDD module for further mining of knowledge as illustrated in the next Figure
Literature Review
step where text is normalized and inconsistencies are treated, like I will explain later as illustrated [NM04].
It is possible to select different approaches and methods for accomplishing goals. This is a very important step, because there is no best approach for all Text Mining cases. The best approach depends on the nature of the dataset [Jia01].
Figure 2.3: Proccess of Data Mining to identify Patterns
2.1.4 Text Refining and Knowledge Distillation
Text mining can be visualized as consisting of two phases: Text refining that transforms free-form text documents into a chosen intermediate form, and knowledge distillation that deduces patterns or knowledge from the intermediate form. Intermediate form (IF) can be semi-structured such as the conceptual graph representation, or structured such as the relational data representation. Intermediate form can be document-based wherein each entity represents a document, or con-cept based wherein each entity represents an object or concon-cept of interests in a specific domain. Mining a document-based IF deduces patterns and relationship across documents. Document clus-tering/visualization and categorization are examples of mining from a document-based IF. Mining a concept-based IF derives pattern and relationship across objects or concepts. Data mining oper-ations, such as predictive modeling and associative discovery, fall into this category. A document-based IF can be transformed into a concept-document-based IF by realigning or extracting the relevant infor-mation according to the objects of interests in a specific domain. It follows that document-based IF is usually domain-independent and concept-based IF is domain-dependent [Vin10].
Knowledge distillation can then be performed on the company database (company-based IF) to derive company-related knowledge.
Dictionaries and list should be used as auxiliary tools to classify the dataset. In the end the algorithm implemented has to be evaluated by some metrics as it will be possible to see in a further section.
Literature Review
Figure 2.4: A text mining framework
So, there are many different measures for evaluating the performance of information retrieval systems. The measures require a collection of messages and a query. All the common measures, such as precision, recall, fall-out and f-measure, assume a ground truth notion of relevancy: every message is known to be either relevant or non-relevant to a particular query. This ground truth notion is achieved by identifying each message as relevant or not, without using the algorithm implemented, but only taking in account the logic.
2.1.5 Preprocessing for Text Mining
Actually we face the problem of processing very large data sets, which are normal for text mining systems. An essential requirement for the data model is the reduction of very high dimensional data into low dimensional data, without the loss of important data. Furthermore, it should reduce the noise of the data [Bus11].
2.1.5.1 Morphological Analyses
The first step in text-preprocessing is the morphological analyses. It is divided into some subcat-egories: tokenisation, stemming and recognition of ending of records. However, like in all other analysis steps require the different methods of information retrieval only some of the described techniques. Dimension reduction sometimes are not required. It depends on the output that we want.
Literature Review
Morphology is a part of linguistics which deals with the words. It deals with the smallest, useful unit of a document. Firstly, information retrieval requires the words. Furthermore, the stemming of words increases the recall and precision of the information retrieval. The term recall describes the proportion of all relevant documents in a data set that are retrieved by the information retrieval system. The term precision describes the proportion of relevant documents in the data set returned to the user. [MKS99]
2.1.5.2 Tokenisation
The first step of Morphological Analyses is the tokenisation. The aim of the tokenisation is the exploration of the words in a sentence. Textual data is only a block of characters at the beginning. All following processes in information retrieval require the words of the data set. This may sound trivial as the text is already stored in machine-readable formats. But some problems are still left, like the removal of punctuation marks. Other characters like brackets or hyphens require a processing as well. That way tokenizer can cater for consistency in the documents. Other problems are abbreviations and acronyms which have to be transformed into a standard form [BVA02].
A tokenizer is not always required, it heavily depends on the following processing steps used and how powerful those methods are. We will present some potencial process steps that can follow the Tokenisation in the next sections.
2.1.5.3 Stemming
Stemming is a technique for the reduction of words into their root [All03].
Many words in English and Portuguese can be reduced to their base form or stem e.g. "agreed", "agreeing", "disagree", "agreement" and "disagreement" belong to "agree". Also in Portuguese, acordado, concordando, discordar, acordo and discordância belong to concordar.
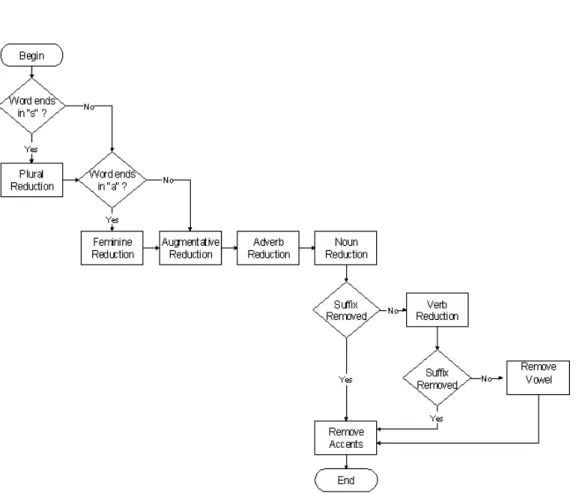
English stemming seems to be a resolved problem. And what about the steps for Portuguese stemming? It is important to study that as the messages that we want to crawl are in Portuguese.
So, it consists in 8 steps summarized in the Figure 2.5[OH01].
Each step has a set of rules and only one rule in each step can be applied (it should be the longest possible suffix to be removed first).
The result of the removal may lead to an incorrect root. However, these stems do not have to be a problem for the stemming process, if these words are not used for human interaction. The stem is still useful, because all other inflections of the root are transformed into the same stem. Case sensitive systems could have problems when making a comparison between a word in capital letters and another with the same meaning in lower case, so first it should reduce all the messages to the lower case form. [Pai94]
There are some difficulties applying Stemming such as dealing with exceptions forms, homo-graphs and irregular verbs.
Literature Review
Figure 2.5: The steps for Stemming Portuguese Language
2.1.5.4 String Matching
Another useful step is String Matching. String matching consists in finding one, or more generally, all the occurrences of a string. There are 2 different variants of String Matching: Exact String Matching, where words are matched when one word is contained in the other in the exact same form (i.e. teach in teaching), and Inexact String Matching that searches for approximate patterns between words [CL04].
This technique is very useful because it comprises finding approximate patterns on strings, obtaining a set of words, and then comparing them to dictionary valid words.
2.1.5.5 Spam Filtering and Meaning Obfuscation
Now we will present a summary of some common techniques that are not always used in text mining. It depends on which kind of information are we treating, but, sometimes, they are really useful, for example, in short messages with a lot of abbreviations.
Spam Filtering consists of substitutions of different characters with others. This is very im-portant because we know that in social media people write with spelling mistakes, words without some letters to make them shorter. This allows us to discover the real word (a word present in the dictionary), so that we can make the post understandable [SWB06].
Literature Review
It is very common to find posts in social media with spelling mistakes that make it more diffi-cult to learn the mobility activities that we are trying to find. The technique Meaning Obfuscation involves knowledge about the context in a given expression, in order to detect if the user literally means the word or not [JAG08].
Tests using a collection of 1.4 billion of words and sentences extracted from British National Corpus, have conducted to obtaining results showing some notion of similarity between words and different contexts. So this way we can test if a word is in context or out of context.
2.1.6 Classifiers
"Classifier systems are a kind of rule-based systems with general mechanisms for processing rules in parallel, for adaptive generation of new rules, and for testing the effectiveness of existing rules. These mechanisms make possible performance and learning without the “brittleness” characteristic of most expert systems in AI."
Holland et al., Induction, 1986
Machine learning is synonymous with advanced computing and a growing body of work exists on the use of such techniques to solve real-world problems [Bul04].
Machine learning, a branch of artificial intelligence, is a scientific subject concerned with the design and development of algorithms that allow computers to evolve behaviors based on empirical data, such as from sensor data or databases. The major focus of machine learning research is to automatically learn to recognize complex patterns and make intelligent decisions based on data.
Machine learning algorithms can be organized into a taxonomy based on the desired outcome of the algorithm [Mit97b].
• Supervised learning generates a function that maps inputs to desired outputs (also called labels, because they are often provided by human experts labeling the training examples). For example, in a classification problem, the learner approximates a function mapping a vector into classes by looking at input-output examples of the function;
• Unsupervised learning models a set of inputs, like clustering;
• Semi-supervised learning combines both labeled and unlabeled examples to generate an appropriate function or classifier;
• Reinforcement learning learns how to act given an observation of the world. Every action has some impact in the environment, and the environment provides feedback in the form of rewards that guides the learning algorithm;
• Transduction tries to predict new outputs on specific and fixed (test) cases from observed, specific (training) cases;
• Learning to learn learns its own inductive bias based on previous experience. 14
Literature Review
Training sets are finite and the future is uncertain, learning theory usually does not yield guar-antees of the performance of algorithms. Instead, probabilistic bounds on the performance are quite common.
There are many algorithms for machine learning as we can see but it will only be defined in a summarized way the most common ones [Bri02]:
• Decision tree learning [Mit97a] uses a decision tree as a predictive model which maps observations about an item to conclusions about the item’s target value;
• Association rule learning [Ma98] is a method for discovering interesting relations among variables in large databases.
• Support vector machines (SVMs) [Fle09] are a set of related supervised learning methods used for classification and regression. Given a set of training examples, each marked as belonging to one of two categories, an SVM training algorithm builds a model that predicts whether a new example falls into one category or the other.
• Cluster analysis [TS06] is the assignment of a set of observations into subsets (so called clusters) so that observations in the same cluster are similar in some sense, while observa-tions in different clusters are dissimilar. Clustering is a method of unsupervised learning. • Bayesian network [NFK07] is a probabilistic graphical model that represents a set of
ran-dom variables and their conditional independencies via a directed acyclic graph (DAG). For example, a Bayesian network could represent the probabilistic relationships between diseases and symptoms. Given symptoms, the network can be used to compute the proba-bilities of the presence of various diseases.
2.1.7 Visualization
Data presentation can be beautiful, elegant and descriptive. There is a variety of conventional ways to visualize data – tables, histograms, pie charts and bar graphs are being used every day, in every project and on every possible occasion.
Several topic maps engines provide visualizations of topic maps. Most of them display lists or indexes from which it is possible to select a topic and see related information. This representation is very convenient when users’ needs are clearly identified [Gra03].
Directly related with the mapping visualization, it is the actual technology, the library d3.js for Javascript.
D3 allows you to bind arbitrary data to a Document Object Model (DOM), and then apply data-driven transformations to the document. For example, you can use D3 to generate an HTML table from an array of numbers. Or, use the same data to create an interactive SVG bar chart with smooth transitions and interaction.
D3 is not a monolithic framework that seeks to provide every conceivable feature. Instead, D3 solves the crux of the problem: efficient manipulation of documents based on data. This avoids
Literature Review
proprietary representation and affords extraordinary flexibility, exposing the full capabilities of web standards such as CSS3, HTML5 and SVG. With minimal overhead, D3 is extremely fast, supporting large datasets and dynamic behaviors for interaction and animation. D3’s functional style allows code reuse through a diverse collection of components and plugins. 1
2.2
Related Work
In this section it will be exposed the projects already done related with each area of review of this thesis. So we will start with the most important related projects found using mobility in social media.
2.2.1 Detecting Mobility in Social Media
2.2.1.1 GeoEventMaps: News Event Detection and Geospatial Plotting
Event analysis is a core Natural Language Processing task that focuses on the automatic identifi-cation and classifiidentifi-cation of various event types in text. In this project, linguistic techniques were investigated for detecting pre-defined event types in a news stream (e.g., an RSS feed). In con-junction, a geo-tagging technique was developed to assign geographical coordinates to specific event types. These geo-footprints facilitated the map-based representation and visualization of news story events (using the Google Maps API). The scope of news events explored was confined to a particular domain, e.g. crimes - murders, attacks, robberies etc. The resulting news event mapping web service provided users with a quick and easy way to determine, for example, crime black spots in certain geographical regions. This was the system developed by Mastersone et al [CM12] that, as well as the proposed in this dissertation has the identification and classification of some events and then the visualization map to provide the information to the end-user in an easier way.
2.2.1.2 Finding influentials based on the temporal order of information adoption in twitter In this work, Lee et al [LKP10] proposed a novel method finding influentials by considering both the link structure and the temporal order of information adoption in Twitter.
Another related project is the "Determinants of mobility intentions in the Seoul Metropolitan Region" [Han11] as it is possible to analyze the mobility intentions of another region.
2.2.2 Information Extraction
Information extraction (IE) is the task of automatically extracting structured information from unstructured and/or semi-structured machine-readable documents. Recent activities in multimedia document processing like automatic annotation and content extraction out of images/audio/video
1http://d3js.org/
Literature Review
could be seen as information extraction. The next research represents the works did in this area in other contexts.
2.2.2.1 Twitter Sentiment
The first context is to find sentiments and it is quite important as a further improvement of our dissertation is to add the sentiment related to each mobility activity found and represent it with different color marks in the map.
So, TwitterSentiment 2 is a platform that uses a machine learning approach for sentiment detection. The classifier, developed by Go et al. at the Stanford University in an academic project, is very well described in a paper [GB09]. Basically, Go et al. import a training set by searching for ’:)’ and ’:(’. The first result is treated as a positive sample and the latter one as negative sample. Using diferent machine learning algorithms like Naive Bayes, Maximum Entropy and SVM, they achieved an accuracy of more than 80
Figure 2.6shows a screenshot of the interface, and Figure 2.7a screenshot of the result list. The salmon-colored entries indicate negative sentiments, while the green ones indicate positive sentiments.
Figure 2.6: Twitter Sentiment interface
2.2.2.2 Minimising Travellers’ Spending Money on Public Transport
Neal Lathia et al, [Lat11] based on the fact that people spend more than they should in the moment of buying the best fare for a public transport ticket, propose to address the incorrect purchases by leveraging the huge volumes of data that travelers create as they move about in the city provided, to each of them, personalized ticket recommendations based on their estimated future travel patterns. In this work, they concluded that applying data mining techniques to public transport data has the potential to provide travelers with substantial savings.
Literature Review
Figure 2.7: Result list of Twitter Sentiment application
2.2.2.3 Goal detection in football by using Support Vector Machines for classification In this paper, Ancona et al presented a technique for detecting goals during a football match by using images acquired by a single camera placed externally to the field. The method does not require the modification neither of the ball nor of the goalmouth. Due to the attitude of the camera with respect to football ground, the system can be thought of as an electronic linesman, which helps the referee in establishing the occurrence of a goal during a football match. The occurrence of the event is established detecting the ball and comparing its position with respect to the location of the goalpost in the image. The ball detection technique relies on a supervised learning scheme called Support Vector Machines for classification. The examples used for training are appropriately filtered version of views of the object to be detected, previously stored in form of image patterns [ACB+01].
2.2.2.4 Extracting Clustered Urban Mobility And Activities From Georeferenced Mobile Phone Datasets
In this research, Yuan et al [YR09] focused on extracting clustered human mobility and activi-ties based on a mobile phone dataset from northeast China. There have been several studies on modeling urban dynamic patterns from mobile connection datasets, but their research focused on extracting the implications of various clustering patterns, as well as relating these patterns to the distribution of urban infrastructures. That way the results would be very useful in updating envi-ronmental, urban and transportation policies. Moreover, the results can be used as informants of human activity including long-term choices such as where to live and short-term choices such as daily activity scheduling.
Literature Review
2.2.2.5 Activity-aware map: identifying human daily activity pattern using mobile phone data
This research work tackles the same problem as this dissertation. They tried to help urban plan-ning and transportation management by developing an activity awareness map to identify human daily activities in order to understand dynamics of human mobility. Besides geographic space, they characterized mobility in a profile-based space (activity-awareness map) that describes most probable activity associated with a specific area of space.
Based on a large mobile phone data of nearly one million records of the users in the central Metro-Boston area, it was found a strong correlation in daily activity patterns within the group of people who share a common work area profile. In addition, within the group itself, the similarity in activity patterns decreases as their work places become apart [PHDL+10].
2.2.2.6 Twitteuro
Twitteuro tracks the popularity and trends of the Euro 2012 teams and players in the Twittersphere. Twitteuro processes in real-time all the tweets that contain the Euro2012 hash tag and identifies mentions to teams and individual players. It assumes that the popularity of a team or a player is proportional to the number of tweet mentions. Thus, the more tweets containing the team or the player name, the higher their popularity. To help to compare the popularity of the teams and players they developed an interactive visualization. The circles with the national flags and players photos represent the Euro 2012 teams and players. The circles are sized by the Twitteuro popu-larity score. Twitteuro also displays opinion trends about the Euro 2012 competition in general, about a specific team or even about an individual player. It also presents the latest tweets collected by Twitteuro in real-time, for a given visualization context.
This project, still being done in SAPO LABS, is related with this dissertation as they use twitter as a source for collecting information and they have developed an intuitive interface to show the results gathered. In the detailed information about a player it is possible to see a graphic that shows the number of tweets about that player per day. It is easy to understand that the high points represent an important action of a player like a goal or a red card for example. It would be interesting that the system could determine the reason of those high points using the tweets of that period [PLT+12].
In the next images we can see the main interface of the developed system (Figure 2.8) and the detailed information where it is possible to see the detailed information referring to Portuguese player, Cristiano Ronaldo (Figure 2.9).
2.2.3 Visualization
Here we can find the "World Map" that is a free program developed by the Center for Geographic Analysis at Harvard University [Uni10]. World Map is designed to enable creation, visualization, and exploration of geographically referenced information. In other words, you can build some
Literature Review
Figure 2.8: Twitteuro Main Interface
Figure 2.9: Cristiano Ronaldo detailed information
great mapped data visualizations on the service, as the given example showing the Japan’s 2011 disasters in the Figure 2.10.
Literature Review
Figure 2.10: Japan’s 2011 Disasters
2.2.3.1 Google WorldMap visualization
A geomap 3is a map of a country, continent, or a region map, with colors and values assigned to specific regions. Values are displayed as a color scale, and you can specify optional hover text for regions. The map is rendered in the browser using an embedded Flash player. Note that the map is not scrollable or draggable, but can be configured to allow zooming.
Figure 2.11: Google WorldMap visualization
Literature Review
2.2.3.2 We Feel Fine
This project represents in an intuitive way the exploration of human emotions on a global scale. The system searches the world’s newly posted blog entries for occurrences of the phrases "I feel" and "I am feeling". When it finds such a phrase, it records the full sentence, up to the period, and identifies the "feeling" expressed in that sentence (e.g. sad, happy, depressed, etc.). Because blogs are structured in largely standard ways, the age, gender, and geographical location of the author can often be extracted and saved along with the sentence, as can the local weather conditions at the time the sentence was written. All of this information is saved. Using a series of playful interfaces, the feelings can be searched and sorted across a number of demographic slices, offering responses to specific questions like: Do women feel fat more often than men? The interface to this data is a self-organizing particle system, where each particle represents a single feeling posted by a single individual. The particles’ properties – color, size, shape, opacity – indicate the nature of the feeling inside, and any particle can be clicked to reveal the full sentence it contains. This is quite a complete system where you can also see the metrics that display the most representative traits of the sample population along different axes. For example, Figure 2.12displays the geographical breakdown of the sample population. The particles move to the point on the world map that corresponds to the geographical location of their author. The particles with unknown location form a giant question mark [KH11].
Figure 2.12: We Feel Fine - World Map visualization
2.2.4 Previous Related Projects at FEUP
This has been a subject of study in other previous thesis at FEUP, in a different way. 22
Literature Review
The first, by Sara Carvalho, aimed to identify messages with traffic information on twitter by implementing a Suport Vector Machine for message classification [Car10].
The objective of her study addressed the identification of messages that are relevant to the traffic characterization problem in a continuous flow of messages open to any subject. The focus was the capture of the user generated messages; in opposition to the messages broadcast by official sources like news agencies and traffic reporting agencies.
Roel Nelles’ point is already closer to this thesis. Also by collecting information from Twitter, he developed an interface that shows the times comparison for two countries for limited activities at each country in the word [Nel11].
His goals were related to compare the daily routines of people from different cultures (coun-tries). He searched for some words and compared the time of the messages posting. In his disser-tation it is not shown any metrics to evalutate the obtained results.
Our dissertation, having this knowledge as a basis, extract from Twitter messages in Por-tuguese the activities found in messages that contain expressions that implies mobility. We don’t want to compare habits but to classify the types of mobility and the predominance in our country. An important point was the metrics evaluated to improve the performance of the developed system by understanding what was failing and adding some specific cases.
The Figure 2.13represents the interface of the work made by Roel Nelles - Activity World Map.
Literature Review
2.3
Most Relevant Topics
This chapter is one of the most important, because it represents the study of existing techniques to collect information from social media, as to normalize them and to make it understandable because people write with spelling mistakes in social media in order to make the sentences shorter and faster to write.
Here we studied and found related projects in some parts. Ones that helped us most, other that made part of a structured review and let us understand how they developed their systems. Thus, as a working tool was primarily used: the work of Roel that we had access to the source code to understand how to interact with the Twitter API and the type of filters used to select the desired returned messages. The interface developed by him was a starting point for the one that we developed, based on Google Geomap.
The "Work Activity Map-Aware" project, that aims to help urban planning and management of public transport as a common point with this thesis was also one of the most important related works in terms of architecture background. Other techniques presented and the classifiers were very important to know how the whole process works and to help us to model the architecture for the system implemented by us.
The Tokenisation to divide the messages and the String Matching were techniques that we used.
In Chapter 5it will be presented the methodology for the implemented solution and the archi-tecture of the system.
Chapter 3
Twitter: The Chosen Microblog
From Twitter, the chosen source of data, it will be presented its business model, user statics, political impact and how to interact with the API. This chapter will comprise all the information about Twitter, because it is important to understand the chosen microblog.
The choice for the Twitter service was made because of the public databases that could be accessed trough an API and because of the short messages that makes people center their intentions on the activities that they want to share.
Twitter is a popular social network website which only asks one question: ‘What’s happen-ing?’, which represents what we want to know, the activities that people do (we will search for the ones related with mobility). The answer is limited to 140 characters which is also good because it pretends that people focus on the action instead of writing a descriptive text. Figure 3.1shows a screenshot of the current Twitter User Interface. Status updates can be sent via a web browser, SMS, e-mail or third party applications and are displayed on the users’ profile.
In sum, Twitter is an online social networking and micro blogging service that enables its users to send and read text-based posts of up to 140 characters, known as "tweets".
Figure 3.1: Twitter’s User Interface
3.1
Followers
Twitter implemented a concept of so-called followers. If a certain user updates his/her status, all followers are informed of the new status. This is achieved by adding the new entry to their personal Twitter overview page (Figure 3.2).
Twitter: The Chosen Microblog
Figure 3.2: Personal Twitter Overview Page
One can follow every other user unless this user has set the profile as ‘private’. In this case, an initial request for approval has to be sent first.
3.2
Business Model
Like several other popular social network sites, Twitter struggles to find a valid business model which actually generates revenue. Twitter itself confirms this on their web page:
"Twitter has many appealing opportunities for generating revenue but we are hold-ing off on implementation for now because we don’t want to distract ourselves from the more important work at hand which is to create a compelling service and great user experience for millions of people around the world. While our business model is in a research phase, we spend more money than we make." 1
To finance the service Twitter relies heavily on investors and has thus generated a total funding of 155 Million dollars. According to the Financial Times, the investors valued the site with 1 Billion dollars in 2009 [Tim09].
In that time Twitter made a new attempt to find a new business model. They introduced so-called ‘Promoted Tweets’.
Promoted Tweets are ordinary Tweets purchased by advertisers who want to reach a wider group of users or to spark engagement from their existing followers. Promoted Tweets are clearly labeled as Promoted when an advertiser is paying for their placement on Twitter. In every other
1https://twitter.com/about
Twitter: The Chosen Microblog
respect, Promoted Tweets act just like regular Tweets and can be retweeted, replied to, favorites and more. All Promoted Tweets are first displayed as regular Tweets to the timelines of people following an account. The advertisers can then promote those Tweets to spark additional conver-sation.2
With this type of approach they get the revenues of the companies that want to advertise using the Twitter service.
3.3
Spam
Like every successful communication platform, Twitter is prone to Spam. On their Company Blog
3, the Twitter operators define spam "as a variety of different behaviors that range from insidious to
annoying". This includes aggressive following/ unfollowing, links to phishing/malware sites and the classical unsolicited advertisements. Twitter fights hard to avoid spam as good as possible. For example, every user profile has a dedicated ‘report for spam’ button. According to the operators, they managed to bring down the Spam level to 1-2% as we can see in the figure 3.3.
Figure 3.3: Percentage of spammy tweets posted per day is way down
3.4
Usage Statistics
In October 2006, Biz Stone, Evan Williams, Dorsey, and other members of Odeo formed Obvious Corporation and acquired Odeo and all of its assets from the investors and shareholders.
The tipping point for Twitter’s popularity was the 2007 South by Southwest (SXSW) festival. During the event, Twitter usage increased from 20,000 tweets per day to 60,000 [Dou12]. More
2https://support.twitter.com/articles/142101-promoted-tweets 3http://blog.twitter.com/2010/03/state-of-twitter-spam.html
Twitter: The Chosen Microblog
specifically, Twitter’s website attracted a total of 44.5 million unique visitors worldwide in June, 2009, according to comScore [Sch09]. The service, then, rapidly gained worldwide popularity, with over 300 million users as of 2011, generating over 300 million tweets and handling over 1.6 billion search queries per day [Twi11].
This micro blogging network [LA07], has experienced a burst of popularity in recent months leading to a huge user-base, consisting of several hundreds of millions of users who actively par-ticipate in the creation and propagation of content.
In the Figure 3.4it is possible to see the growth of the Twitter service [KLPM10] from May 2009 to May 2010.
Figure 3.4: Twitter’s Growth
With 20 million of its visitors coming from the U.S.A., Twitter’s audience is now 55 percent international. ComScore now counts it as the No. 52 largest site in the world (bigger than ESPN, just shy of the BBC and Craigslist). These estimates only account for traffic to Twitter.com. Since more than half of Twitter users do not even go to the Website, and instead use Twitter apps to consume and publish Tweets, Twitter’s total audience is even larger. But comScore provides a consistent measure of its growth.
Asur and Huberman [AH10] demonstrated how social media, in particular Twitter, can be used to predict real-world outcomes. The study focuses on the prediction of box-office revenues for out-coming movies. In the end they conclude that a simple model that senses tweets on a particular topic can outperform some market-based predictors, therefore proving the forecasting power of social media.
The main reasons for choosing this social media were the fact that one has a shorter maximum of characters so that, instead of writing a long text, it makes one focus on the activity or the content one wants to share. The fact that it is possible to have access to the time, location of the messages (if available) or the local of the user, that is not private it is also very important.
Twitter: The Chosen Microblog
Even though the use of Portuguese is quite low, it is possible to get the messages by Por-tuguese users and select only messages written in PorPor-tuguese, as the dictionary filters the potential messages containing expressions in Portuguese.
3.5
Geographical Distribution
Java et al [JSFT07] carried out a detailed analysis of Twitter in the year 2007, being one of the first scientific papers to deal with this topic. They performed a detailed geographical analysis. The results show that Twitter is mostly used in the United States (especially East Coast), in Europe and Asia (mainly Japan). Twitter is adopted the most in the cities of Tokyo, New York and San Francisco. The following figure visualizes the geographical distribution.
Figure 3.5: Geographical Distribution of Twitter Users
3.6
Twitter API
The Twitter platform offers access to that corpus of data, via our APIs. Each API represents a facet of Twitter, and allows developers to build upon and extend their applications in new and creative ways. It is important to note that the Twitter APIs are constantly evolving, and developing on the Twitter Platform is not a one-off event.
Twitter: The Chosen Microblog
Twitter for Websites (TfW) 4 is a suite of products that enables websites to easily integrate Twitter. TfW is ideal for site developers looking to quickly and easily integrate very basic Twitter functions.
The Search API 5designed for products looking to allow a user to query for Twitter content. This may include finding a set of tweets with specific keywords, finding tweets referencing a specific user, or finding tweets from a particular user.
The REST API 6enables developers to access some of the core primitives of Twitter including timelines, status updates, and user information.
And finally, the most important for us, the Streaming API 7 is the real-time sample of the Twitter Firehose. This API is for those developers with data intensive needs. Streaming API allows for large quantities of keywords to be specified and tracked, retrieving geo-tagged tweets from a certain region, or have the public statuses of a user set returned.
The usage of the API is free of charge, it only requires an active Twitter account and it is used by a wide range of third-party twitter applications, like this one.
4https://dev.twitter.com/twitter-for-websites 5https://dev.twitter.com/docs/using-search 6https://dev.twitter.com/docs/api
7https://dev.twitter.com/docs/streaming-apis
Chapter 4
Problem Modeling
As we said in the Literature Review chapter, Microblogs are a relatively new form of communica-tion in which users can describe their current status in short posts distributed by instant messages, mobile phones, email or the Web and there are several tools and applications for microblogging, such as, Twitter, Tumblr, Facebook status, and many others.
As it was already explained too, the microblog crawled was the Twitter, known by its limit for 140 characters in the status update messages. But is this system extensible to use another microblogs (if the database that contains the initial messages has the same schema) as data source if it is needed in the future? And what are the needed changes to extend that?
Figure 4.1: Microblogs
The answer to the previous question is "Yes", the system developed is extensible if the schema of the database is the same. The preprocessing module would have some differences because Twitter has its own particularities, like the hastags that have to be removed, for example. Basically it would be needed to study the particularities of the other microblog and see if it important to implement some other preprocessing for special characters that has a specific mean for that service.
Problem Modeling
In the end it is expected to have another database with the mobility activities messages, as well as the type of that mobility and the place of the user that has posted.
In this context other problems are arising: • How to identify location?
• How to identify activity?
These are specific problems that will be explained how they were reached in the respective modules of the implementation in the next chapter.
But, what are mobility activities and places precisely? It is fundamental to have it clear, so that the implementation would be coherent.
4.1
Mobility Activities vs Places
Activity is usually related to movement when we are talking about mobility. So, it implies a dislocation from being static to be in movement. By definition a mobility activity has an initial and end time and the subtraction of the end time and the initial is the duration of the activity. Not only the time, but also the place has to change between initial and final time. To be considered a mobility activity the final location has to be different from the initial, so that it represents a dislocation.
The three following expressions summarize the conditions for being in a presence of a mobility activity.
• duration = t f − ti
• moving ⇒ location(t f ) 6= location(ti) • static ⇒ location(t f ) = location(ti)
Figure 4.2: Activity Definition
This way, it is easier to understand, for example, that the sentence Estou em casa that means "I am at home" does not implies movement, so that, it is not considered for our algorithm. It is also clear that the sentence Estou a ir para em casa that means "I am going home" has an underlying