Electronic copy available at: http://ssrn.com/abstract=1308526
Value relevance of alternative methods of accounting for actuarial gains and losses
Abstract
The adoption of IAS 19: Employee benefits (2004) provided managers with an important accounting choice affecting the time and placement of actuarial gains and losses recognition. IAS 19 enables a choice between three major accounting methods related to the recognition of actuarial gains and losses of defined benefit plans: profit or loss method, equity recognition method and corridor method. The objective of this paper is to compare the ability of the three alternative methods for recognising actuarial gains and losses to reflect companies’ value. We manually collect information about the accounting method of recognising actuarial gains and losses adopted by 91 European companies listed in EURONEXT100, in 2005, 2006 and 2007. We applied regression analysis to investigate the value relevance of financial information under equity recognition method, profit or loss method and corridor method. Findings suggest that the recognition of all actuarial gains and losses in equity best reflects the market’s valuation of actuarial gains and losses.
Author Keywords: actuarial gains and losses, corridor, equity, defined benefit plans.
Electronic copy available at: http://ssrn.com/abstract=1308526
1. Introduction
Accounting for defined benefit plans is an important, complex and actual financial reporting issue.
Defined benefit plans can entail one of the biggest liabilities that a company has in its balance sheet. Severinson (2008) found that 40% of companies from a global index reported defined benefit obligation due to pensions in 2007. Severinson (2008) also found that the defined benefit obligation represents, on average, 18% of market capitalization of companies.
Although defined benefit plans are an important way of compensation, the accounting treatment of defined benefit plans required by International Accounting Standard (IAS) 19 has long been criticised by companies, analysts, investors and other users. Some of
the main concerns are that the accounting model has too many conceptual
compromises and the different methods for recognising gains and losses lead to lack of
comparability.
In response to those criticisms, the International Accounting Standards Board (IASB) has put a long-term project on employee benefits on its agenda in 2006. Both the IASB and the Financial Accounting Standards Board (FASB) have announced that they will jointly develop a single standard for pension accounting. Additionally, in March 2008, IASB issued a discussion paper about the preliminary views on short term amendments to IAS 19. In this paper, IASB proposed to eliminate the deferred recognition of actuarial gains and losses (corridor method).
Electronic copy available at: http://ssrn.com/abstract=1308526
The objective of this paper is to compare the ability of the three alternative methods for recognising actuarial gains and losses to reflect companies’ value, for a sample of 91 companies included in EURONEXT 100, that have defined benefit plans and that disclosed information about the method of recognising actuarial gains and losses, for the period between 2005 and 2007. The alternative accounting methods are described in section 2. For each accounting method I estimated a valuation equation. This estimation includes: (1) an equation that adjusts reported net income and book value of equity to reflect the recognition of all actuarial gains and losses in equity (equity recognition method); (2) an equation that adjusts reported net income and book value of equity to reflect the recognition of all actuarial gains and losses in profit or loss (profit or loss method) and (3) an equation that adjusts reported net income and book value of equity to reflect the recognition of actuarial gains and losses under the corridor method (corridor method). To minimize potential effects of scale differences across sample companies, all equations are deflated by the number of shares outstanding at the year end.
My paper contributes to prior literature by showing which method of accounting for actuarial gains and losses provides more value relevant information, for the first three years that the adoption of IFRS/IAS is mandatory. I also investigated the only issue that under IAS/IFRS allows the companies to choose between recognising all actuarial gains and losses in profit or loss or directly in equity.
The structure of the paper is as follows. Section 2 provides a description of the alternative accounting methods for recognising actuarial gains and losses, the equations estimation and sample. Section 3 presents descriptive statistics and explains empirical results. Finally, section 4 presents the main conclusions.
2. Research design
2.1. Description of alternative accounting methods
In this section, I summarize the three accounting methods for recognising actuarial gains and losses and their underlying economic assumptions.
Actuarial gains and losses may result from increases or decreases in either the present value of a defined benefit obligation or the fair value of any related plan assets of defined benefit plans (IAS 19, § 94) and IAS 19: Employee Benefits (2004) enables a choice between three major accounting methods related to the recognition of actuarial gains and losses: profit or loss method, equity recognition method and corridor method.
Under profit or loss method, all actuarial gains and losses are recognised in income statement in the period in which they occur. Immediate recognition of all actuarial gains and losses represents more faithfully the company’s financial position, results in more transparent and understandable financial statements and improves comparability across companies (IASB, Discussion Paper, 2008).
Equity recognition method was introduced in 2004 and is based on the United Kingdom (UK) Financial Reporting Standard (FRS) 17: Retirement Benefits (2000). Under this method, all actuarial gains and losses are recognised immediately outside profit or loss and should be presented separately within a statement of recognised income and expense (IAS 19, §93B). Similar to profit or loss method, the equity recognition method requires the recognition of all actuarial gains and losses. However, the equity recognition method creates an exception to the recognition of all income and expenses in profit or loss.
The third method, followed by the majority of European companies (Morais, 2008) is the corridor method. Under this method, only the cumulated actuarial gains and losses that exceed a predetermined level (corridor) have to be recognised in profit or loss. The portion of actuarial gains and losses to be recognised in profit or loss is the “excess” divided by the expected average remaining working lives of the employees participating in the plan. The “excess” is determined by the difference between the net cumulative unrecognised actuarial gains and losses and the greater of 10% of the present value of defined benefit obligation and 10% of the fair value of plan assets. The portion of actuarial gains and losses not recognised in profit or loss is recognised as a liability, in the balance sheet.
The IASB’s Discussion Paper (2008) presents four main views that supported the corridor method. The first view considers that defined benefit obligations are more difficult to measure than other obligations, since it is impossible to predict accurately all the variables included in the valuation of defined benefit obligations. Therefore, companies should not reflect in profit or loss all actuarial gains or losses because some of the actuarial gains and losses may not result from the events of that period. The second view considers that actuarial gains and losses are not relevant to users of financial information, because some actuarial gains and losses may reverse or offset each other. The third view believes that the volatility resulting for the immediate recognition of all actuarial gains and losses is too great to be acceptable in financial statements. Finally, the fourth view states that the immediate recognition of all actuarial gains and losses may induce a reduction or even a cancellation of defined benefit plans.
2.2. Equations estimation
The objective of this paper is to compare the ability of the three alternative methods for recognising actuarial gains and losses to reflect companies’ value. To accomplish this objective, I estimated the valuation equation. Our benchmark model uses net income and book value of equity under the method chosen by companies.
i) Companies that adopted the corridor method
For companies that chose the corridor method, I estimated the valuation equation by adjusting net income and book value of equity in order to obtain the net income and book value of equity under the equity recognition method and profit or loss method.
To obtain the net income under equity recognition method, I increased net income under the corridor method by the amount of actuarial losses recognised in income under the corridor method and decreased net income under the corridor method by the amount of actuarial gains recognised in income under the corridor method. To obtain equity under equity recognition method, I decreased equity under the corridor method by the amount of unrecognised actuarial losses at the year end under the corridor method and increased equity by the amount of unrecognised actuarial gains at the year end under the corridor method.
To obtain the net income under profit or loss method, I decreased net income under the corridor method by the difference between actuarial losses of the period and actuarial losses recognised in income under the corridor method and I increased net income under the corridor method by the difference between actuarial gains of the period and actuarial gains recognised in income under the corridor method. To obtain equity under profit or loss method, I decreased equity under the corridor method by the amount of
unrecognised actuarial losses at the beginning of the year under the corridor method and increased equity under the corridor method by the amount of unrecognised actuarial gains at the beginning of the year.
Therefore, for companies that adopted the corridor method, the valuation equations under corridor method, equity recognition method and profit or loss method are, respectively: it t i t i
BVECM
NICM
MVEit
=
ϖ
0+
ϖ
1 ,+
ϖ
2 ,+
ε
(1a) it t i t iBVECME
NICME
MVEit
=
ϖ
0+
ϖ
1 ,+
ϖ
2 ,+
ε
(1b) it t i t iBVECMPL
NICMPL
MVEit
=
ϖ
0+
ϖ
1 ,+
ϖ
2 ,+
ε
(1c)Where MVE is the market value of equity at the year end; BVECM is the book value of equity at the year end under the corridor method and NICM is net income under the corridor method; BVECME is the book value of equity at the year end under the corridor method minus unrecognised actuarial losses (UALf) and plus unrecognised actuarial gains (UAGf) at the year end; NICME is net income under the corridor method plus actuarial losses recognised in income under corridor method minus actuarial gains recognised in income under the corridor method; NICMPL is net income under the corridor method adjusted by the difference between actuarial gains and losses of the period and actuarial gains and losses recognised in profit or loss under corridor method; BVECMPL is equity under the corridor method minus unrecognised actuarial losses (UALf) at the year end plus unrecognised actuarial gains (UAGf) at the year end.
ii) Companies that adopted the equity recognition method
For companies that adopted the equity recognition method, I estimated the valuation equation by adjusting net income and book value of equity in order to obtain the net income and book value of equity under profit or loss method.
To obtain the net income under profit or loss method, I decreased net income under the equity recognition method by the amount of actuarial losses of the period and increased net income under the equity recognition method by the amount of actuarial gains of the period. Book value of equity under profit or loss method is equal to book value of equity under equity recognition method since all actuarial gains and losses are recognised in equity.
Therefore, for companies that adopted the equity recognition method, the valuation equations under equity recognition method and profit or loss method are, respectively:
it t i t i
BVEE
NIE
MVEit
=
ϖ
0+
ϖ
1 ,+
ϖ
2 ,+
ε
(2a) it t i t iBVEE
NIEPL
MVEit
=
ϖ
0+
ϖ
1 ,+
ϖ
2 ,+
ε
(2b)Where MVE is the market value of equity at the year end; BVEE is the book value of equity at the year end under the equity recognition method and NIE is net income under the equity recognition method; NIEPL is net income under equity recognition method minus actuarial losses of the period (AL) plus actuarial gains (AG) of the period.
iii) Companies that adopted the profit or loss method
Finally, for companies that adopted the profit or loss method, I estimated the valuation equation by adjusting net income and book value of equity in order to obtain the net income and book value of equity under equity recognition method.
In order to obtain that estimation, I increased net income under the profit or loss method by the amount of actuarial losses for the period and decreased net income under the profit or loss method by the amount of actuarial gains for the period. Book value of equity under profit or loss method is equal to book value of equity under equity recognition method since all actuarial gains and losses are recognised in equity.
Therefore, for companies that adopted the profit or loss method, the valuation equations under profit or loss method and equity recognition method are, respectively:
it t i t i
BVEPL
NIPL
MVEit
=
ϖ
0+
ϖ
1 ,+
ϖ
2 ,+
ε
(3a) it t i t iBVEPL
NIPLE
MVEit
=
ϖ
0+
ϖ
1 ,+
ϖ
2 ,+
ε
(3b)Where MVE is the market value of equity at the year end; BVEPL is the book value of equity at the year end, under the profit or loss method and is equal to book value of equity under equity recognition method (BVEE) and NIPL is net income under profit or loss method; NIPLE is net income under profit or loss method plus unrecognised actuarial losses (AL) of the period minus unrecognised actuarial gains (AG) of the period.
To minimize scale effects, all equations are estimated using variables deflated by the number of shares outstanding at the year end.
I first manually collected information about post employment benefits from annual reports, for 2005, 2006 and 2007, available on the companies’ websites as well as on the website of Euroland (www.euroland.com).
I examined the Notes to the financial statements in order to identify if the company has defined benefit plans and, in that case, which accounting method of recognising actuarial gains and losses was adopted. We assigned the value 1 if the company adopted the corridor method, the value 0 if the company adopted the equity method and the value 2 if the company adopted the profit or loss method. I also collected information about the present value of the defined benefit obligation (PVO), fair value of plan assets (FVA), unrecognised actuarial gains (UAG) and losses (UAL) under corridor method, actuarial gains and losses recognised in profit or loss under corridor method and actuarial gains and losses recognised in equity under equity recognition method (AL and AG).
Information about market value of equity, net income, book value of equity and number of shares outstanding at the year end were obtained from Worldscope Database.
Then, I estimated cross-sectionally valuation equation for 2005, 2006 and 2007, as well as pooled regressions for equation using year-fixed effects. As heteroskedasticity is a common situation in these kinds of models, I adopted the White procedure to obtain consistent estimators for the standard errors of OLS estimators.
2.2. Sample
Our sample consists of 91 European listed companies that are included in the EURONEXT 100 in 2005 and that adopt the IASB standards.
TABLE 1 ABOUT HERE
Table 1, Panel A, shows descriptive statistics for my sample companies in terms of country representation. Of the total of companies, I excluded 2 companies that do not present their financial statements reports based on IAS/IFRS. A further 3 companies were excluded because of missing information. Finally, we excluded 4 companies because those companies do not have defined benefit plans. Consequently, the number of sample companies was reduced from 100 to 91. In terms of country representation, most of the companies are from France (67,03%).
Table 1, Panel B, shows representation by industry, in particular the number of financial companies and non-financial companies. I obtained information about industry from Worldscope Database and I considered financial companies the companies which the major industry group is 43 Financial. The sample comprises 19 companies from the financial sector (20,88%) and 72 companies from other sectors (79,12%). The industry classification shows that most of the companies are from non-financial sector.
Table 1, Panel C, shows the number of companies that adopted the corridor method, the equity recognition method and the profit or loss method, total and per country, in 2005, 2006 and 2007. The corridor method is the most adopted method by companies in all of the years (79,1% in 2005, 64,8% in 2006 and 58,2% in 2007), followed by the equity recognition method (16,5% in 2005, 33% in 2006 and 39,6% in 2007). The profit or loss method is the less used method (4,4% in 2005 and 2,2% in 2006 and 2007).
These results show that companies are changing their methods of recognising actuarial gains and losses from the corridor method to the equity recognition method. The analysis of the actuarial gains and losses accounting method by country shows that all the countries have a stronger adoption of the corridor method.
3. Results
3.1. Descriptive statistics
Table 2 provides descriptive statistics for our sample. As we can see, companies that adopted the corridor method of recognising actuarial gains and losses tend to be larger companies, with higher values of actuarial gains and losses for the period. By contrary, companies that adopted the equity recognition method show smaller amount of net income and higher values of liability recognised in the balance sheet.
TABLE 2 ABOUT HERE
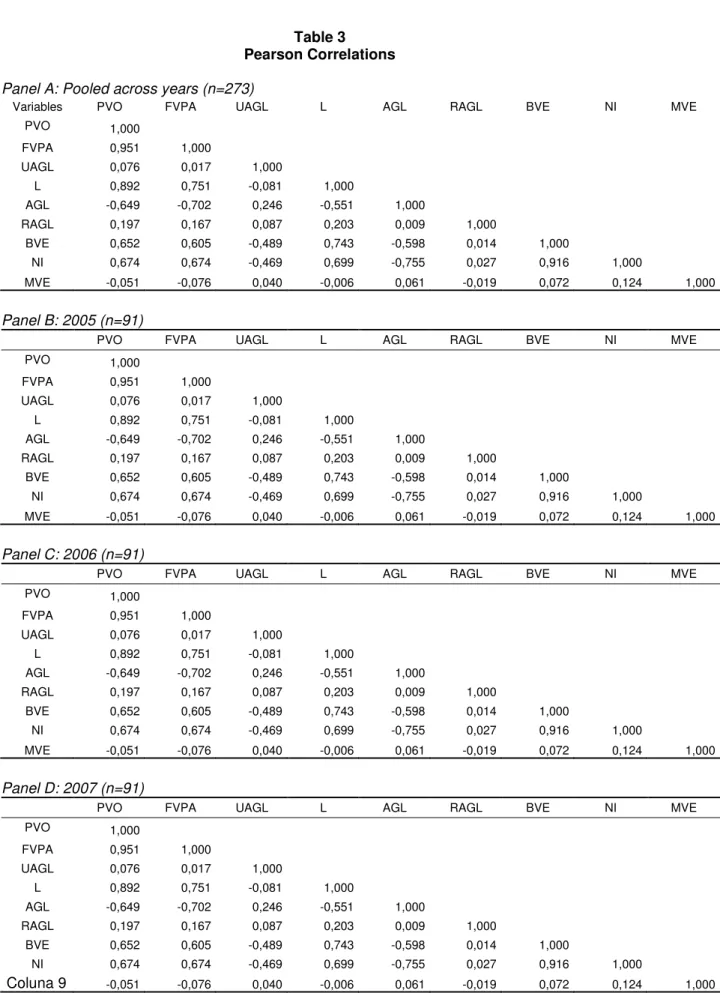
Table 3 reports Pearson correlations among the variables. Table 3 reveals that most of the variables are correlated with each other. At a bivariate level, present value of obligation and fair value of assets are negatively correlated with market value of equity while net income and book value of equity are positively correlated with market value of equity.
3.2. Regression
Table 4, panel A, present regression summary statistics corresponding to valuation equations (1b), (2a) and (3b). Table 4, panel B, present regression summary statistics corresponding to valuation equations (1c), (2b) and (3a). Finally, table 4, panel C, present regressions results corresponding to valuation equation (1a). In these tests, I included all the companies in the sample (91 companies), except for the corridor method.
TABLE 4 ABOUT HERE
Panel A reveals that the coefficients on net income are significantly positive in the pooled sample and across all years, except for 2005. The book value of equity coefficients range from 0,131 and 0,619 and are all statistically significant except for 2006.
Panel B shows that the coefficient on net income are significantly positive in the pooled sample and across all years. The coefficients on book value of equity are positive in all estimations, but not significantly in 2006. The notable difference between the findings in panel A and panel B is a drop in model explanatory power when net income and book value of equity is adjusted to reflect the profit or loss method, in the pooled sample and across 2005 and 2006, although direct comparison of adjR2 is not strictly valid.
Panel C reveals that the coefficients on net income are significantly positive in the pooled sample and across all years and higher than the coefficients under the equity recognition or profit or loss method, except for 2007. The model explanatory power is
lower in panel C than in panel A or B. The drop in explanatory power is consistent with actuarial gains and losses being revenue or expenses that should be recognised in whole. The results seem to suggest that the corridor method provides less value relevant financial information that the equity recognition or the profit or loss method. These results are consistent with Barth’s findings (2001). She found that market pays some attention to the pension information reported in the financial statement notes, but may have some difficulties to weighting this information. However, the results are not supportive of Brown’s conclusion (2002) that the market is able to effectively unwind aggressive managerial assumptions and fairly values pension liabilities and assets.
I performed the same tests using as an independent variable abnormal earnings instead of net income. I defined abnormal earnings as net income minus 4,5% (risk free rate for 30 years) of book value of equity at the beginning of the year and I reached similar results (untabulated results).
I also performed the same tests excluding companies that adopted the equity recognition method and profit or loss method in 2005, 2006 or 2006. Table 5, panel A to C, present regression summary statistics corresponding to valuation equations (1a), (1b) and (1c), respectively. I found that the explanatory power of the equity recognition method is higher than the explanatory power of the profit or loss method and corridor method in the pooled sample. The analysis of the results per year show that, in general, the explanatory power of the equity recognition method tend to be higher except for all the years except in 2007 that are similar to the corridor method.
4. Conclusions
This paper provides empirical evidence of the value relevance of financial information under the three different methods of accounting for actuarial gains and losses: the equity recognition method, the profit or loss method and the corridor method. Based on a sample of 91 European companies listed in EURONEXT 100, I investigated the value relevance of different method of accounting for actuarial gains and losses by estimating valuation equations.
The results of this study suggest that the recognition of all actuarial gains and losses provides more value relevant information than the deferred recognition of actuarial gains and losses. I also found that the equity recognition method provides more value relevant than the profit or loss method or the corridor method.
My findings make two main contributions to previous literature. First, this paper contributes to prior literature by showing which method of accounting for actuarial gains and losses provides more value relevant information, for the first three years that the adoption of IFRS/IAS is mandatory. Second, I investigated the only issue that under IAS/IFRS allows the companies to choose between recognising all actuarial gains and losses in profit or loss or directly in equity.
Although I included the adjustments to net income and book value of equity in order to estimate the valuation equations under the equity recognition method, the profit or loss method and the corridor method, I did not consider the fiscal effect of these adjustments. Additionally, our study includes a small number of companies, if we consider only those that adopted the corridor method. Finally, our study is limited to a three years period of mandatory adoption of IAS/IFRS. Future research can explore if the effects documented in this study are sustained in a longer period.
6. References
Accounting Standards Board, 2000, FRS 17: Retirement Benfits.
Ali, A. and L. Hwang, 2000, “Country specific factors related to financial reporting and the value relevance of accounting data”, Journal of Accounting Research, 38: 1-21. Amen, M., 2007, “Simulation-based comparison of existent IAS 19 Accounting options”, European Accounting Review, 16 (2): 243-276.
Amir, E. and E. Gordon, 1996, “Firms’ choice of estimation parameters: empirical evidence from SFAS 106”, Journal of Accounting, Auditing and Finance, 11 (3): 427-448.
Ashana, S., 1999, “Determinants of funding strategies and actuarial choices for defined-benefit pension plans”, Contemporary Accounting Research, 16 (1): 39-74. Ball, R. 2005, “International Financial Reporting Standards (IFRS): pros and cons for investors”, Working Paper.
Ball, R. and C. Smith, 1992, The economics of accounting policy choice, McGraw Hill, New York.
Barth, M., W. Landsman and M. Lang, 2005, “International Accounting Standards and accounting quality”, Working Paper, Stanford University.
Barth, M., 1991, “Relative measurement errors among alternative pension asset and liability measures”, The Accounting Review, 66 (3): 433-463.
Barth, M., W. Beaver and W. Landsman, 1992, “The market valuation implications of net periodic pension cost components”, Journal of Accounting and Economics, 15: 27-62.
Brown, S., 2002, “The impact of pension assumptions on firm value”, Working Paper, Emory University.
Cooke, T., 1989, “Disclosure in the Corporate Annual Reports of Swedish Companies”, Accounting and Business Research, 19, 74: 113-124.
Demirgue-Kunt, A. and R. Levine, 1999, “Bank-based and market-based financial systems: cross-country comparisons”, Working Paper.
D’Souza, J., 1998, “Rate-regulated enterprises and mandated changes: the case of electric utilities and post-retirement benefits other than pensions (SFAS nº 106)”, The Accounting Review, 73 (3): 387-410.
D’Souza, J.,J. Jacob and K. Ramesh, 2000, “The use of accounting flexibility to reduce labor renegotiation costs and manage earnings”, Journal of Accounting and Economics, 30: 187-208.
Easley, D. and M. O’Hara, 2004, “Information and the cost of capital”, Journal of Finance, 59: 1553-1583.
Faccio, M. and L. Lang, 2002, “The ultimate ownership of western European corporations”, Journal of Financial Economics, 65: 365-395.
Ghicas, D. 1990, “Determinants of actuarial cost method changes for pension accounting and funding”, The Accounting Review, 65 (2): 384- 405.
Hand, J. and T. Skantz,1998, “The economic determinants of accounting choices: the unique case of equity carve-out under SAB 51”, Journal of Accounting and Economics, 24: 175-203.
Hann, R., F. Heflin and K. Subramanayam, 2007, “Fair-value pension accounting”, Journal of Accounting and Economics, 44: 328-358.
Hang, J. and T. Skantz, 1998, “The economic determinants of accounting choices: the unique case of equity carve-outs under SAB 51”, Journal of Accounting and Economics, 24: 175-203.
Healy, P. and J. Whalen, 1999, “A review of the earnings management literature and its implications for standard setting”, Accounting Horizons, 13: 365-384.
Healey, P. and K. Palepu, 1993, “The effect of firms’ financial disclosure strategies on stock prices”, Accounting Horizons, 7: 1-11.
Healey, P. and K. Palepu, 1995, “The challenges of investor communication: the case of CUC International Inc.”, Journal of Financial Economics, 38: 111-140.
Holthausen, R. and R. Leftwich, 1983, “The economic consequences of accounting choice: implication of costly contracting and monitoring”, Journal of Accounting and Economics, 5: 77-117.
Holtahusen, R., 1990, “Accounting method choice: opportunistic behaviour, efficient contracting and information perspectives”, Journal of Accounting and Economics, 12: 207-218.
International Accounting Standards Board, International Accounting Standard 19: Employee Benefits (2004).
International Accounting Standards Board, 2008, Discussion Paper on post- retirement benefits.
La Porta, R. F. López-de-Silanes, A. Shleifer and R. Vishny, 1998, “Law and finance”, Journal of Political Economy, 106: 1113-1150.
Mittelstaedt, H., 1989, “An empirical analysis of the factors underlying the decision to remove excess assets from overfunded pension plans”, Journal of Accounting and Economics, 11: 399-418.
Mittelstaedt, H., W. Nichols and P. Regier, 1995, “SFAS 106 and benefit reductions in employer-sponsored retiree health care plans”, The Accounting Review, 70 (4): 535-556.
Morais, A., 2008, “Actuarial Gains and Losses: the Choice of the Accounting Method”, Accounting in Europe, 5 (2): 127 – 139.
Picconi, M., 2004, “The perils of pensions: does pension accounting lead investors and analysts astray?”, Working Paper.
Ramesh, K. and L. Revsine, 2000, “The effects of regulatory and contracting costs on banks’ choice of accounting method for other postretirement employee benefits”, Journal of Accounting and Economics, 30: 159-186.
Ravsine, L., D. Collins and W. Johnson, 2006, Financial reporting and analysis, Third edition, Prentice Hall, New Jersey.
Ramesh, K. and L. Revsine, 2001, “The effects of regulatory and contracting costs on banks´choice of accounting method for other postretirement employee benefits”, Journal of Accounting and Economics, 30: 159-186.
Severinson, C., 2008, “Accounting for defined benefit plans: an international comparison of exchange-listed companies”, OECD Working Paper on Insurance and Private Pension nº 23.
Thomas, J., 1989, “Why do firms terminate overfunded pension plans?”, Journal of Accounting and Economics, 11: 361-398.
Watts, R. and J. Zimmerman, 1978, “Positive accounting theory: a ten-year perspective”, The Accounting Review, 65, 1: 131-156.
Watts, R. and J. Zimmerman, 1990, “Towards a positive theory of the determination of accounting standards”, The Accounting Review, 53, 1: 112-134.
Watts, R. and J. Zimmerman, 1986, Positive accounting theory, Prentice Hall, Englewood Cliffs, NJ.
Watts, R., 1977, “Corporate financial statements, a product of the market and political processes”, Australian Journal of Management, 2: 53-75.
Appendix A –Variables and variables definitions
1) Dependent variables
MVE Market value of equity at the year end. 2) Independent variables
Variable Description
NICM Net income under corridor method.
NIE Net income under equity recognition method. NIPL Net income under profit or loss method. NICME NICM+RAL-RAG
Net income under the corridor method plus actuarial losses recognised in income under corridor method minus actuarial gains recognised in income under the corridor method.
NICMPL NICM-(AL-RAL)+(AG-RAG)
Net income under the corridor method adjusted by the difference between actuarial gains and losses of the period and actuarial gains and losses recognised in profit or loss under corridor method.
NIEPL NIE-AL+AG
Net income under equity recognition method minus actuarial losses of the period plus actuarial gains of the period.
NIPLE NIPL+AL-AG
Net income under profit or loss method plus unrecognised actuarial losses of the period minus unrecognised actuarial gains of the period.
BVECM Book value of equity at the year end under corridor method. BVEE Book value of equity at the year end under equity recognition
method. BVEPL BVEE
Book value of equity at the year end under profit or loss method. BVECME BVECM-UALf+UAGf
Book value of equity at the year end under the corridor method minus unrecognised actuarial losses and plus unrecognised actuarial gains at the year end.
BVECMPL BVECM-UALf+UAGf
Equity under the corridor method minus unrecognised actuarial losses at the year end plus unrecognised actuarial gains at the year end.
AL Actuarial losses of the period. AG Actuarial gains of the period.
RAL Actuarial losses recognised in net income under the corridor method.
RAG Actuarial gains recognised in net income under the corridor method.
UAG Unrecognised actuarial gains under the corridor method at the year end.
UAL Unrecognised actuarial losses under the corridor method at the year end.
Table 1
Companies included in the sample
Panel A: Number of companies included in the sample
Countries Companies Other GAAP Missing information Without defined plans Total % Belgium 10 - - 2 8 8,79% France 66 2 3 - 61 67,03% Netherlands 18 - - 2 16 17,58% Portugal 6 - - - 6 6,59% Total 100 2 3 4 91 100%
Panel B: Industry analysis
Countries Financial sector % Non-financial sector % Total Belgium 3 37,50% 5 62,50% 8 France 10 16,39% 51 83,61% 61 Netherlands 4 25,00% 12 75,00% 16 Portugal 2 33,33% 4 66,67% 6 Total 19 20,88% 72 79,12% 91
Panel C: Actuarial gains and losses accounting policy choice
Countries Equity Corridor Profit/loss Total
Belgium 2005 1 (12,5%) 7 (87,5%) 0 (0%) 8 2006 2 (25%) 6 (75%) 0 (0%) 8 2007 2 (25%) 6 (75%) 0 (0%) 8 France 2005 8 (13,1%) 49 (80,3%) 4 (6,6%) 61 2006 21 (34,4%) 38 (62,3%) 2 (3,3%) 61 2007 27 (44,3%) 32 (52,2%) 2 (3,3%) 61 Netherlands 2005 3 (18,8%) 13 (81,2%) 0 (0%) 16 2006 4 (25%) 12 (75%) 0 (0%) 16 2007 4 (25%) 12 (75%) 0 (0%) 16 Portugal 2005 3 (50%) 3 (50%) 0 (0%) 6 2006 3 (50%) 3 (50%) 0 (0%) 6 2007 3 (50%) 3 (50%) 0 (0%) 6 Total 2005 15 (16,5%) 72 (79,1%) 4 (4,4%) 91 2006 30 (33%) 59 (64,8%) 2 (2,2%) 91 2007 36 (39,6%) 53 (58,2%) 2 (2,2%) 91
Table 2 Descriptive statistics
Companies N Mean Std deviation Median Minumum Maximmum
All PVO 2005 91 3359,35 6390,75 1114,00 4,10 47014,22 2006 91 3794,89 6929,87 1119,90 3,90 45675,56 2007 91 3543,27 6325,73 965,00 3,80 42478,13 FVA 2005 91 2295,92 5473,56 438,00 0,00 46147,01 2006 91 2969,68 6707,66 780,70 0,00 51149,08 2007 91 2961,29 6676,48 659,30 0,00 51768,92 UAGL 2005 91 154,13 418,67 12,00 -710,00 2541,00 2006 91 13,25 627,44 0,00 -4993,70 2425,00 2007 91 -97,89 827,43 0,00 -7703,04 597,00 L 2005 91 912,73 1882,22 386,00 -966,00 14572,00 2006 91 832,99 1832,57 260,00 -1155,00 13896,00 2007 91 713,84 1772,18 190,00 -1593,19 13760,00 AGL 2005 91 105,42 281,49 17,90 -743,08 1770,00 2006 91 -100,76 539,51 -2,50 -4697,33 702,00 2007 91 -140,80 400,68 -5,55 -2655,10 628,00 RAGL 2005 91 15,93 92,79 1,20 -418,00 730,30 2006 91 -1,91 143,93 1,00 -853,00 690,00 2007 91 -14,33 132,67 0,00 -608,00 628,00 NI 2005 91 1808,96 2959,32 832,00 15,80 22175,05 2006 91 1999,01 2892,50 928,25 -61,00 19943,74 2007 91 2248,94 3327,59 1019,90 -3477,00 21690,52 BVE 2005 91 10570,36 13391,18 5357,00 407,10 82688,00 2006 91 12145,74 15380,57 5972,00 -2060,60 87128,31 2007 91 13022,73 16105,50 6597,00 -2072,90 85582,66
Table 2 (cont.) Descriptive statistics
Companies N Mean Std deviation Median Minumum Maximmum
Equity method PVO 2005 15 3418,30 5745,05 1457,40 4,10 21446,00 2006 30 3341,89 4823,17 1404,50 3,90 20358,00 2007 36 3431,40 5511,67 1230,00 5,40 25425,00 FVA 2005 15 2197,43 4032,21 918,00 0,00 16006,00 2006 30 2350,57 3619,28 1094,90 0,00 17278,00 2007 36 2835,34 5459,62 742,50 0,00 28231,00 L 2005 15 1236,01 2062,42 405,00 -15,00 6654,00 2006 30 998,18 1682,25 260,35 -651,00 6429,00 2007 36 715,11 1310,99 139,25 -940,00 5818,00 AGL 2005 15 57,72 224,88 33,00 -418,00 730,30 2006 30 -32,43 246,86 -2,90 -853,00 690,00 2007 36 -45,33 207,02 -3,45 -608,00 628,00 RAGL 2005 15 55,52 225,30 31,00 -418,00 730,30 2006 30 -32,78 246,80 -2,90 -853,00 690,00 2007 36 -42,56 208,29 -0,90 -608,00 628,00 NI 2005 15 1233,91 1364,43 689,00 221,00 4806,00 2006 30 1336,38 1526,50 729,05 115,00 5758,00 2007 36 1365,41 1756,57 919,00 -3477,00 6391,00 BVE 2005 15 8529,35 9418,69 6388,60 1099,00 39288,00 2006 30 9520,60 11716,60 5913,50 1196,00 50166,00 2007 36 9893,09 10963,29 6551,45 1214,00 48913,00
Table 2 (cont.) Descriptive statistics
Companies N Mean Std deviation Median Minumum Maximmum
Corridor method PVO 2005 72 3465,80 6703,14 1106,90 4,10 47014,22 2006 59 4109,40 7900,11 1119,90 4,20 45675,56 2007 53 3686,96 6967,11 965,00 3,80 42478,13 FVA 2005 72 2417,93 5876,92 413,80 1,60 46147,01 2006 59 3355,43 7920,83 472,00 1,30 51149,08 2007 53 3121,36 7540,74 659,30 1,50 51768,92 UAGL 2005 72 194,80 462,77 21,75 -710,00 2541,00 2006 59 20,43 781,49 11,70 -4993,70 2425,00 2007 53 -168,08 1083,02 -7,30 -7703,04 597,00 L 2005 72 854,43 1894,16 355,00 -966,00 14572,00 2006 59 762,49 1940,62 260,00 -1155,00 13896,00 2007 53 710,91 2063,41 204,40 -1593,19 13760,00 AGL 2005 72 118,71 299,18 15,10 -743,08 1770,00 2006 59 -140,50 647,16 -2,50 -4697,33 702,00 2007 53 -213,33 487,68 -15,00 -2655,10 159,90 RAGL 2005 72 6,06 18,12 1,00 -77,20 68,00 2006 59 12,81 30,24 2,20 -7,10 151,00 2007 53 3,30 17,15 0,70 -53,00 71,00 NI 2005 72 1933,99 3201,48 879,00 95,00 22175,05 2006 59 2273,28 3308,14 999,30 -61,00 19943,74 2007 53 2810,68 3973,28 1090,00 128,00 21690,52 BVE 2005 72 10809,67 13491,24 5337,75 407,10 82688,00 2006 59 12879,27 16007,98 6069,00 -2060,60 87128,31 2007 53 14391,18 17472,70 6597,00 -2072,90 85582,66
Table 2 (cont.) Descriptive statistics
Companies N Mean Std deviation Median Minumum Maximmum
Profit or loss method PVO 2005 4 1222,13 1206,15 1178,40 92,70 2439,00 2006 2 1311,60 1802,27 1311,60 37,20 2586,00 2007 2 1749,05 2446,52 1749,05 19,10 3479,00 FVA 2005 4 469,18 813,73 94,85 0,00 1687,00 2006 2 876,60 1235,17 876,60 3,20 1750,00 2007 2 986,55 1390,81 986,55 3,10 1970,00 L 2005 4 752,95 935,03 450,65 36,50 2074,00 2006 2 434,75 567,45 434,75 33,50 836,00 2007 2 768,60 1047,08 768,6 28,20 1509,00 AGL 2005 4 45,05 48,17 40,80 1,60 97,00 2006 2 27,00 43,84 27,00 -4,00 58,00 2007 2 26,50 43,13 26,5 -4,00 57,00 RAGL 2005 4 45,05 48,17 40,80 1,60 97,00 2006 2 27,00 43,84 27,00 -4,00 58,00 2007 2 26,50 43,13 26,5 -4,00 57,00 NI 2005 4 1714,80 3070,55 265,20 15,80 6313,00 2006 2 3847,25 5121,93 3847,25 225,50 7469,00 2007 2 3266,35 4554,69 3266,35 45,70 6487,00 BE 2005 4 13916,68 24918,49 2004,60 422,50 51235,00 2006 2 29883,60 39735,72 29883,60 1786,20 57981,00 2007 2 33092,50 44780,37 33092,5 1428,00 64757,00
Sample includes 91 European companies listed in EURONEX 100. PVO is the present value of the defined benefit obligation. FVA is the fair value of plan assets. UAGL is unrecognised actuarial gains and losses under corridor method. L is the amount recognized as a defined benefit liability. AGL is the actuarial gains and losses of the period. RAGL is the actuarial gains and losses recognized in profit or loss (corridor method and profit or loss method) or in equity (equity recognition method). A negative amount means a net actuarial gain and positive amount means a net actuarial loss. NI is net income and BE is the book value of equity. Amounts are in million of euros.
Table 3 Pearson Correlations
Panel A: Pooled across years (n=273)
Variables PVO FVPA UAGL L AGL RAGL BVE NI MVE
PVO 1,000 FVPA 0,951 1,000 UAGL 0,076 0,017 1,000 L 0,892 0,751 -0,081 1,000 AGL -0,649 -0,702 0,246 -0,551 1,000 RAGL 0,197 0,167 0,087 0,203 0,009 1,000 BVE 0,652 0,605 -0,489 0,743 -0,598 0,014 1,000 NI 0,674 0,674 -0,469 0,699 -0,755 0,027 0,916 1,000 MVE -0,051 -0,076 0,040 -0,006 0,061 -0,019 0,072 0,124 1,000 Panel B: 2005 (n=91)
PVO FVPA UAGL L AGL RAGL BVE NI MVE
PVO 1,000 FVPA 0,951 1,000 UAGL 0,076 0,017 1,000 L 0,892 0,751 -0,081 1,000 AGL -0,649 -0,702 0,246 -0,551 1,000 RAGL 0,197 0,167 0,087 0,203 0,009 1,000 BVE 0,652 0,605 -0,489 0,743 -0,598 0,014 1,000 NI 0,674 0,674 -0,469 0,699 -0,755 0,027 0,916 1,000 MVE -0,051 -0,076 0,040 -0,006 0,061 -0,019 0,072 0,124 1,000 Panel C: 2006 (n=91)
PVO FVPA UAGL L AGL RAGL BVE NI MVE
PVO 1,000 FVPA 0,951 1,000 UAGL 0,076 0,017 1,000 L 0,892 0,751 -0,081 1,000 AGL -0,649 -0,702 0,246 -0,551 1,000 RAGL 0,197 0,167 0,087 0,203 0,009 1,000 BVE 0,652 0,605 -0,489 0,743 -0,598 0,014 1,000 NI 0,674 0,674 -0,469 0,699 -0,755 0,027 0,916 1,000 MVE -0,051 -0,076 0,040 -0,006 0,061 -0,019 0,072 0,124 1,000 Panel D: 2007 (n=91)
PVO FVPA UAGL L AGL RAGL BVE NI MVE
PVO 1,000 FVPA 0,951 1,000 UAGL 0,076 0,017 1,000 L 0,892 0,751 -0,081 1,000 AGL -0,649 -0,702 0,246 -0,551 1,000 RAGL 0,197 0,167 0,087 0,203 0,009 1,000 BVE 0,652 0,605 -0,489 0,743 -0,598 0,014 1,000 NI 0,674 0,674 -0,469 0,699 -0,755 0,027 0,916 1,000 Coluna 9 -0,051 -0,076 0,040 -0,006 0,061 -0,019 0,072 0,124 1,000 Sample includes 91 European companies listed in EURONEX 100. PVO is the present value of the defined benefit
obligation. FVA is the fair value of plan assets. UAGL is unrecognised actuarial gains and losses under corridor method. L is the amount recognised as a defined benefit liability. AGL is the actuarial gains and losses of the period. RAGL is the
actuarial gains and losses recognized in profit or loss (corridor method and profit or loss method) or in equity (equity recognition method). A negative amount means a net actuarial gain and positive amount means a net actuarial loss. NI is net income; BVE is the book value of equity and MVE is the market value of equity at the year end. Amounts are in million of euros deflated by the number of shares outstanding at the year end.
Table 4
Regression results (all companies)
Panel A: regression results for the equity recognition method
Constant NI BVE
Year n coef t-stat coef t-sta coef t-stat Adj R2
Pooled 273 29,937 13,070*** 2,194 5,572*** 0,272 4,050*** 0,363
2005 91 23,215 8,120*** 1,016 1,496 0,619 4,698*** 0,495
2006 91 32,598 7,053*** 3,387 4,221*** 0,131 0,773 0,392
2007 91 34,473 7,692*** 1,506 2,252** 0,243 2,639** 0,255
Panel B: regression results for the profit or loss method
Constant NI BVE
Year n coef t-stat coef t-sta coef t-stat Adj R2
Pooled 273 31,017 13,317*** 2,091 5,306*** 0,249 3,697*** 0,330
2005 91 28,382 8,958*** 1,530 2,070** 0,319 2,385** 0,330
2006 91 32,025 6,795*** 2,882 3,633*** 0,216 1,258 0,369
2007 91 33,630 7,599*** 1,371 2,146** 0,267 2,986*** 0,270
Panel C: regression results for the corridor method
Constant NI BVE
Year n coef t-stat coef t-sta coef t-stat Adj R2
Pooled 184 31,438 10,054*** 2,274 4,411*** 0,159 2,048** 0,264
2005 72 29,556 8,214*** 2,503 3,091*** 0,113 0,768 0,336
2006 59 30,410 4,628*** 5,382 3,947*** -0,190 -0,825 0,327
2007 53 35,374 5,248*** 1,048 1,291 0,232 2,208** 0,194
Panel A presents regression summary statistics corresponding to valuation equations (1b), (2a) and (3b) (book value of equity and net income under the equity recognition method). Panel B present s regression summary statistics corresponding to valuation equations (1c), (2b) and (3a) (book value of equity and net income under the profit or loss method) and panel C presents regressions results corresponding to valuation equation (1a) (book value of equity and net income under the corridor method). All companies of the sample are included in the regression tests. The dependent variable is the market value of equity at the year end (MVE); NI is net income and BVE is the book value of equity. *, **, *** Significant at the 10%, 5% and 1% levels of significance, respectively.
Table 5
Regression results (companies adopted corridor method)
Panel A: regression results for the equity recognition method
Constant NI BVE
Year n coef t-stat coef t-sta coef t-stat Adj R2
Pooled 184 30,099 10,032*** 2,394 5,372*** 0,185 2,423** 0,340
2005 72 24,071 7,255*** 1,033 1,376 0,577 3,692*** 0,481
2006 59 33,274 5,275*** 4,093 4,412*** -0,087 -0,414 0,419
2007 53 35,302 5,230*** 1,081 1,329 0,227 2,161** 0,193
Panel B: regression results for the profit or loss method
Constant NI BVE
Year n coef t-stat coef t-sta coef t-stat Adj R2
Pooled 184 31,440 10,200*** 2,152 4,849*** 0,176 2,294** 0,300
2005 72 30,714 8,351*** 1,840 2,302** 0,192 1,263 0,299
2006 59 32,289 4,945*** 3,509 3,755*** 0,020 0,094 0,380
2007 53 35,572 5,159*** 0,909 1,134 0,243 2,321** 0,188
Panel C: regression results for the corridor method
Constant NI BVE
Year n coef t-stat coef t-sta coef t-stat Adj R2
Pooled 184 31,438 10,054*** 2,274 4,411*** 0,159 2,048** 0,264
2005 72 29,556 8,214*** 2,503 3,091*** 0,113 0,768 0,336
2006 59 30,410 4,628*** 5,382 3,947*** -0,190 -0,825 0,327
2007 53 35,374 5,248*** 1,048 1,291 0,232 2,208** 0,194
Panel A presents regression summary statistics corresponding to valuation equations (1b), (2a) and (3b) (book value of equity and net income under the equity recognition method). Panel B present s regression summary statistics corresponding to valuation equations (1c), (2b) and (3a) (book value of equity and net income under the profit or loss method) and panel C presents regressions results corresponding to valuation equation (1a) (book value of equity and net income under the corridor method). Only the companies included in my sample that adopted the corridor method are included in the regression tests. The dependent variable is the market value of equity at the year end (MVE); NI is net income and BVE is the book value of equity. *, **, *** Significant at the 10%, 5% and 1% levels of significance, respectively.