theory
DOI: 10.1590/1809-5844201812
Daniela Torres da Rocha
Leandro Rodrigo Canto Bonfim
Michael William Citadin
(Universidade Federal do Paraná, Escola de Administração, Programa de Pós-Graduação em Administração. Curitiba – PR, Brasil)
https://orcid.org/0000-0003-1541-4591 https://orcid.org/0000-0003-0323-7911 https://orcid.org/0000-0001-5358-3519
Fernando Antonio Prado Gimenez
(Universidade Federal do Paraná, Escola de Administração, Departamento de Administração Geral e Aplicada. Curitiba – PR, Brasil)
https://orcid.org/0000-0002-5143-9553
Abstract
The formation of networks comprising firms and stakeholders from the communication industry with the environments of interest for this economic activity is noticed as a topic of interest in the area. Thus, this article proposes to map and analyse the social interactions in the Brazilian cinematographic production and distribution, presenting network relations as a way of management of the economic actors operating in the Brazilian cinema industry. Data were gathered through information available in the Brazilian Observatory for Cinema and Audio-visual about Brazilian movies released between 1995 and 2015. As results, it was verified that in this period were released 1,251 movies, being identified 613 producers and 218 distributors. Only 53 producers were involved in co-productions and only 137 movies were co-distributed. Through the analysis of the social network structural measures, it was possible to verify that the Brazilian cinematographic market is concentrated and has
few relations of cooperation.
Keywords: Cinema. Social networks. Partnership. Cinematographic production.
Introduction
Social networks are established by autonomous actors in a given group, united
by common values and interests, and uniting ideas and resources. Instead of valuing
them are observed. Thus, each observed network presents a particular structure, being
possible to indicate which actors are more powerful and have more influence in the group (MARTELETO, 2001; BORGATTI; HALGIN, 2011). In recent years, the growing interest in the study of social relations and the formation of networks in communication organisations by the Communication Sciences has been noticeable (LEE, MONGE, 2011), among which
are companies from the audio-visual sector.
The audio-visual sector plays a vital role in the cultural, social and economic spheres of nations. Its development is fundamental in the construction of cultural identity and in the expression of citizenship since, through its channels, a society can be represented.
In this sense, cinema has a unique role, because it is the most international audio-visual product, and it is responsible for the highest revenues of the media conglomerates that dominate the sector at the international level (PANGARKER; SMIT, 2013). The production
and distribution of films require technical skills, articulation with suppliers, government,
service providers, sponsors, and the establishment of partnerships among the companies
within the same industry.
According to Gimenez, Rocha and Santos (2015), the period from 2009 to 2015 is marked by the increase in co-production and co-distribution of Brazilian films, specifically considering 2013 and 2014. These two years represent 75,3% of the Brazilian co-production films released in the cinema, evidencing the increase of interactions among the companies of the sector. However, there is still a lack of studies that empirically investigate the structure of network relations of coproduction and co-distribution in the Brazilian film industry.
Thus, the purpose of this research is to map and analyse the social interactions in cinematographic production and distribution in Brazil, presenting network relationships as a way of managing the economic actors in the Brazilian film industry. In order to do so, we analysed information provided by the Observatório Brasileiro do Cinema e do Audiovisual (Brazilian Observatory of Cinema and Audio-visual – OCA), of the Agência
Nacional do Cinema (Brazilian Film Agency – Ancine), about the Brazilian films released
from 1995 to 2015.
This article is structured in four additional sections besides this introduction. The
next one approaches conceptual aspects of network theory and the social network analysis (SNA) and presents a brief overview of the Brazilian cinema industry. Next, the third section describes the methodological procedures followed in the study. The fourth section is dedicated to the presentation and analysis of the research results. Finally, the article concludes with the final considerations.
Theoretical framework
The purpose of this section is to establish the theoretical relationships between the
theory and social network analysis, as well as the Brazilian audio-visual sector. In this
sense, the theoretical approach regarding social networks presents the network as a tool of
analysis, which aims to understand the social relations among a set of actors with different objectives (MARTES et al, 2008), besides presenting the network as a way of managing relations between economic actors. In relation to the audio-visual sector, definitions and more specific characteristics of the sector are presented.
Network theory and analysis of social networks
Networks are, according to Brass (2012), a set of nodes and ties that represent some relation or absence of a relationship between social actors. In social sciences, nodes or actors represent people, groups, organisations and societies embedded in relational networks.
The beginning of network theory was in the 1970s when Granovetter (1973) drew attention to the lack of studies investigating the influence of social micro-interactions on the diffusion of influence and information, since, at the time, social theories were focused on macrostructural explanations. In this study, the author turned to the science of sociometry to argue that the way an actor (ego) is embedded in a social network and the content of this actor’s social relations may affect the way he works, exchange information, or is organized in the community. In this sense, the number of acquaintances (close ties) or close friends and relatives (strong ties), and the density of their network of contacts (how connected are ego-related people) are likely to determine the outcome of the actor’s efforts to influence the
decision and behaviour of other people. Since Granovetter’s proposals, several researchers have contributed to the understanding of how the structure of social networks of actors
influences the economic outcomes and social behaviours of individuals, organisations,
or societies (BURT, 1980; BORGATTI, EVERETT, 1992; UZZI, 1996; HAUSMAN; HIDALGO, 2011).
Following the structural view of network theory, Borgatti and Halgin (2011) explain that the bonds that connect the actors constitute a pattern of interaction and produce a particular relational structure in which the actors occupy positions within the network structure. The positional differences between actors are interpreted based on the limitations and opportunities that arise from the way they are embedded in the network, being useful for understanding the behaviour and performance of social actors.
between organisations and individuals, assuming that in the current business environment, no company, small or large, is independent and self-sufficient.
Thus, the study of networks can be considered a social theory, deriving from it its own methodological approach, the social network analysis (GROSSER; BORGATTI, 2013). This methodology, considered as a methodology applied to the study of the relations between actors with objects of any kind (BORGATTI; EVERETT; FREEMAN, 2004), has in its scope of investigation distinct but intrinsically related relational phenomena, in which can be highlighted the formation of social networks by means of: (a) similarity relations (actors living in the same place, being members of the same social group, or sharing the same values andeventhesamegender);(b)socialrelations,suchaskinshiporaffinity,labour relationsandevenfriendship;and(c)socialinteractionsandtransactionflows,inwhichitis analysedwithwhomtheactorsspeak,exchangeinformation,exchangeresources,andtrade orareinvolvedinmonetarytransactions(BORGATTI;OFEM,2010).Also,ashighlighted byWellman(1993),socialnetworkanalysisasamethodisoriginallystructuralist.
Inthefieldofsocialnetworks, the concepts of role and position have been essential for the development of the area. For this, measures of positional and structural equivalence are presented as a means of exploring the structure and role of the actor in a given network (SCOTT, 2000). There are several structural measures with the purpose of identifying the actors with a higher degree of influence and prestige in the network, as well as to characterize the structure of the network as a whole. In this context, some of them deserve special attention, such as degree centrality, closeness centrality, betweenness centrality, density, geodesic distance, among others (LORRAIN, WHITE, 1971), as follows:
a. Degree centrality: demonstrates the number of ties an actor has with other actors in a network (FREEMAN, 1979). This measure is given by dividing the degree of the node by the maximum degree that any node can have;
b. Closeness centrality: demonstrates the distance of an actor from other actors in the ne -twork (WASSERMAN; FAUST, 1994). For the calculation of the degree of proximity, one must add the geodesic distance of the node in relation to all other nodes of the network. Inverting the resultant, one obtains the distance and consequently the close -ness centrality, since the higher the distance, the smaller the proximity and vice versa; c. Betweenness centrality: demonstrates the interaction between nonadjacent actors.
An actor is considered an intermediary if he links several other actors that are not connected directly (DEGENNE; FORSÉ, 1999), measuring the sum of probabilities that the same node is in the path between all other nodes within the network;
e. Density: calculating the proportion of existing lines in a graph, with respect to the maximum number of possible lines, represents the total network connectivity and is expressed as a percentage of existing relationships over the total number of possible relationships (SCOTT, 2000);
f. Geodesic distance: it is the shortest possible distance between two nodes of the ne-twork (WASSERMAN; FAUST, 1994).
These concepts are used as a foundation for studies intending to establish a basis of the association between the positioning in the network and the behavior or performance of
actors. Furthermore, social network analysis has already been used in other studies on the film industry.
For instance, Coe (2000) studied the Vancouver film industry by pointing out
how the companies’ strategies in the sector are based on networks that interconnect, but which are of different scales. At the international level, local business executives deal with
Hollywood companies in terms of service offerings, but also as potential project partners.
Co-productions are also being developed with companies from the UK and France. At the national level, the networks involve relationships with major Canadian companies based in Toronto and Quebec. These companies, in general, compete for the largest share
of support from official development agencies to the Canadian film industry. Finally, at the local level, there are networks that have been developed over the course of twenty years, with different small companies in the sector, but also with union agents and service providers to the industry. Despite showing strong ties at the local level, companies face the
competition from American companies that use the Vancouver region as lease space for
their productions, inflating the resource market in general. The study exemplifies how the analysis of networks in a given field allows the understanding of the behavior of its actors.
In Brazil, the perspective of network analysis has not frequently been used for the understanding of the film industry. In a qualitative perspective of analysis, Carvalho
and Fischer (2000) described the international strategic alliance between United Cinemas International (UCI) and the local organisation Orient Filmes dedicated to the exhibition
market, of the city of Salvador, Bahia. In this study, based on the logic of social networks, the authors revealed how the centrality of Orient Filmes’ entrepreneur, due to his reputation
and leadership in the local context, associated with the creation of governance conditions
allowed the insertion of this Brazilian company in a highly dynamic industry of the world economy, the cinema. In another study, also in Bahia, Loiola and Lima (2009) identified
the central actors and information brokers of the network composed by the directors of 31 films produced in Bahia between 1994 and 2006, in the so-called New Wave of Bahia. The authors found that the actors with more central positions in the network had greater prestige
Network analysis can also be helpful for understanding the performance of organisations that make up a given field. A study of this type was carried out by Kirschbaum (2006), who analysed the role of key individuals (actors, directors and producers) in the production of Brazilian films between 1994 and 2002. The author found that success in previous productions was a significant predictor of performance of the films produced
between 1994 and 1996. On the other hand, in the later periods, other aspects took on more
significant relevance, such as individual recognition, the centrality in the network and the structural equivalence. For Kirschbaum (2006), the results of his study indicated that in a networked industry, collective success proved to be more important than individual success.
Considering that a network perspective can help to comprehend the strategic choices
made by the production and distribution firms in this industry, the next section presents an overview of Brazilian cinema production in the last twenty years.
The Brazilian audio-visual sector
The film industry, given its broader international reach (PANGARKER; SMIT, 2013) has stood out in terms of economic relevance worldwide. The growing academic
interest in studies related to the film industry may be associated with its high economic importance for the global economy; to its central role in the entertainment industry; and its
cultural relevance (ELIASHBERG; ELBERSE; LEENDERS, 2006).
In the case of Brazilian cinema, since 1995, the year of the Resumption of Brazilian
Cinema (NAGIB, 2002), cinematographic production has been on the rise. The market
went from an average of 21 films released on the cinema market per year between 1995 and 2000 to 85 between 2011 and 2014, representing a growth of over 300% in two decades.
In addition to the launches, the distributors have made efforts to continue the exhibition of
films released in previous years. In relation to the distribution, there was a 15.7% increase in the number of titles exhibited in Brazil between 2013 and 2014. Finally, in relation to the exhibition market, the number of cinemas in Brazil continued to increase, reaching the
mark of 2,830 in 2014 (GIMENEZ; ROCHA; SANTOS, 2015).
Information on the behaviour of the Brazilian film market in 2015, also available
on the website of OCA1, confirms the growth trend of this sector. In 2015, with the release of 128 films, there was a reversal in the number of films observed in 2014 (from 129 films released in 2013 to 114 films in the following year).
Finalizing this brief panorama of the production of cinema in Brazil between 1995
and 2015, we mention the measurement of concentration degree of this market as measured
by Gimenez, Rocha and Santos (2015). Table 1 shows the measures of market concentration according to the revenue of feature films for each period.
Table 1 – Cinema production market concentration in Brazil (participation in box office)
Períod CR4* CR8**
1995/1998 57,67% 76,16%
1999/2003 51,58% 73,72%
2004/2008 49,89% 69,73%
2009/2014 32,69% 50,28%
* Participation of the 4 largest producers in terms of box office; ** Participation of the 8 largest producers in terms of box
office
Source: Adapted from Gimenez, Rocha and Santos (2015, p.214).
As shown in Table 1, in these two decades there was a dynamic of deconcentration of the film production market in Brazil. For both the indicators of the participation of the four
largest producers and for the eight largest producers, there was a change from a concentrated
market to a low concentrated one according to the criteria of George, Joll and Lynk (1991). When calculating this data for the year 2015, we noticed a return to a situation of market concentration, with CR4 indicators equal to 56.79% and CR8 of 83.95%. These data seem to indicate a return to the market concentration found twenty years ago, perhaps caused by the disadvantageous economic situation experienced in Brazil in the last two years.
Methodological approach of the research
The empirical research was carried out through a census study in which 613 producers and 218 film distributors located in Brazil with films released between 1995 and 2015 were identified. The data collection was based on secondary data research, while the temporal perspective comprised longitudinal observations. The list of films analysed was created through electronic searches conducted at the OCA. Data of Brazilian films released between 1995 and 2015 were analysed and categorized into animation, documentary, fiction
and video-musical.
The data gathered include release year, movie title, director, proponent/producer,
home state, distributor, genre, maximum exhibition rooms, public and revenue. After data tabulation, the names of producers and distributors were spelt out, leaving aside the
possibility of including names with different spellings, but not the incidence of homonyms, as pointed out by Silva et al (2006).
Regarding data analysis, the present study comprises two distinct forms of analysis. 1) Descriptive analysis carried out by means of frequencies, averages and other measures with the purpose of presenting characteristics of the Brazilian audio-visual sector and its main actors (producers and distributors). 2) Social network analysis (SNA) using Ucinet
and Netdraw (BORGATTI; EVERETT; FREEMAN, 2004), in which measures of cohesion
extracted. By means of such measures, it is possible to identify the position of each actor
and the overall structure of the network (QUIROGA et al, 2006).
For analysing relational data, two different matrices were elaborated: (i) the
interaction patterns between producers, and (ii) the interaction patterns between producers and distributors. Assuming that producer i has a bond with producer j, then producer j
will also have a tie with producer i (i and j are sociometric notations, the first for the focal actor or ego and the second for immediate contact or alter ego), the data of the first matrix were symmetrized in order to calculate the sociometric measures. For the calculation of the centrality measures from the matrix of interaction patterns between producers and distributors, we used 2-mode centrality measures, since this matrix is not a square one.
Presentation and analysis of results
The purpose of this section is to establish the theoretical and practical relationship of the central themes of the research, including the network theory perspective and social
network analysis of film producers and distributors, as well as the specific description of the main characteristics of the Brazilian audio-visual sector, object of this study, identified through the Brazilian films launched from 1995 to 2015.
Object of the study and temporal perspectives of
released Brazilian films
According to OCA, 1,251 Brazilian films were released from 1995 to 2015. As of 2006, there was a considerable increase in the number of films produced in the country, and in 2013 were launched 129 films. Regarding the genre of the films released, there is a predominance of fiction films (805), totalling 64.35%, followed by documentaries (428), totalling 34.21% of the total films released in the period.In relation to the number of films per producer, it is verified that 613 producers were responsible for the production of 1,251 films in the period. Of these, 1,198 films were produced by only one producer and 53 were produced in the form of co-production, that is, involving two or more producers. The production company Videofilmes stands out for
Table 2 – Number of films produced by producer (producers with 10 or more films)
N. Producer Number of Films
1 Videofilmes Produções Artísticas 31
2 Conspiração Filmes 29
3 Diler & Associados 29
4 Gullane Filmes 18
5 O2 Cinema 18
6 Filmes do Equador 16
7 Dezenove Som e Imagens Produções 14
8 Tambellini Filmes e Produções Audiovisuais 13
9 Total Entertainment 13
10 Taiga Filmes e Vídeo 11
11 Casa de Cinema de Porto Alegre 10
12 Cinematográfica Superfilmes LTDA 10
13 TV Zero 10
Source: Research data, 2016.
Thirteen producers were responsible for the production of 10 or more films, while 357 producers, representing 58.23% of the total production, were responsible for the production of only one film. In addition, 53 producers were involved only in co-productions, not doing any work individually. Thus, the data suggest that, despite having many actors,
the Brazilian film market is still very concentrated in certain producers and presents few
cooperative relations.
Regarding the audience, it is verified that the year 2013, with more than 26 million spectators, presented a record audience. This year, two films stood out: Minha mãe é uma Peça, by Migdal Produções (São Paulo – SP), with an audience of 4,600,145 spectators (407 rooms); and Até que a Sorte Nos Separe 2 by Gullane Filmes (Rio de Janeiro – RJ), with
an audience of 3,978,191 spectators (778 rooms). The year 2010, with 74 titles, presented the second largest annual audience in the last two decades (24,464,112 spectators). The year
2003 obtained the third largest public annual despite presenting the launch of only 30 titles,
totalling 22,291,806 spectators. This year, five titles were responsible for the amount of 15,412,317 spectators, especially the film Carandiru, produced by HB Filmes (SP), which was responsible for bringing 4,693,853 spectators to 298 theatres.
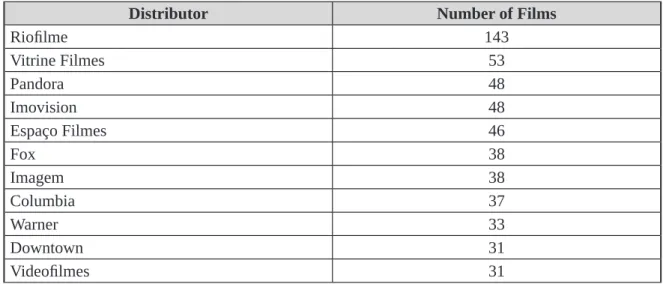
The distribution of the 1,251 films produced in the period was made by 218 distribution companies. 1,114 films (89.05%) were distributed by only one isolated distributor. As shown
in Table 3, it stands out that RioFilme, alone, distributed 143 films, representing 11.43%
of the total of films produced in the period. On the other hand, 137 titles were distributed by two or more distributors, evidencing a distribution market more concentrated than the
Table 3 – Number of movies distributed by distributor (distributor with more than 30 films)
Distributor Number of Films
Riofilme 143
Vitrine Filmes 53
Pandora 48
Imovision 48
Espaço Filmes 46
Fox 38
Imagem 38
Columbia 37
Warner 33
Downtown 31
Videofilmes 31
Source: Research data, 2016.
Profile of
relational network links
Looking at the relational perspective among movie producers with films released
during the period studied (1995-2015), the mapping of relational links between them is
presented. This analysis makes it possible to highlight the partnerships in the Brazilian audio-visual sector regarding film production. In this sense, the producers were distributed in a square matrix with binary observations (0 and 1) according to the existence or not of relations between the cinematographic producers. In addition, the density of the network was calculated by means of the proportion of existing lines in a graph, with respect to the maximum of possible lines, being able to vary from 0 to 1. The purpose of this measure was
to demonstrate the overall density of the relations in the period investigated.
It was verified that the overall network centralization of the 613 producers in the period of the investigation was 0.50% and the overall network density was 0.00%. These indexes indicate that the network of cooperation between producers in the Brazilian audio-visual market has a weak relationship of links, that is, cooperation in this sector is very restricted and dispersed. As pointed out by Sacomano-Neto and Truzzi (2009), low-density networks may have the advantage of access by actors to non-redundant information and contacts, which may have facilitated the strategic renewal that led to the revival of the film industry observed in the period studied. Likewise, less centralized networks tend to have a
Figure 1 shows the network graph from the perspective of degree centrality per producer (individual). Thus, the higher the size of the “node”, the higher producers’ degree centrality, that is, the higher the number of actors directly connected to it.
Figure 1 – Overall network sociogram - producers by centrality
Note: Isolated actors were excluded from the sociogram. Source: Research data, 2016.
Despite presenting 613 companies that have released firms during the investigated
period, the Brazilian audio-visual production industry presents only a few cooperative
relations between these companies. It is possible to observe the formation of some clusters
within the network, like the one formed by 6 firms, including Globo Filmes, Lereby Produções, Angélica Produções Artísticas, Casé Filmes, and Idéias Ideais Design &
Produções. Still, it is noticeable the cluster formed by 5 companies, concentrated around the Cavideo Produções; and two additional clusters formed by three companies, one between Cabra Vadia, O Alto Comando Cinema, and Mixer Produções Cinematográficas,
When observing the indicators from the producers’ individual perspective
(egocentric), it is suggested that the perception of centrality by producer shows its interrelationship degree. In this context, the higher the producer’s degree centrality in the
network, the higher its importance in the relational structure among the producers in the
area (Table 4). The degree centrality aims to reveal the number of bonds an actor has with other actors in a network, considering only the adjacent relationships, resulting in the local centrality of the actors (ROSSONI; HOCAYEN-DA-SILVA; FERREIRA-JÚNIOR, 2006). The degree centrality also indicates the prestige, prominence and power that the actor
possesses in the network (BORGATTI, 1995; FREEMAN, 1979). The more connections
an actor has in the network, the higher his opportunity to influence and be influenced by
other actors, and also the higher their chances of accessing information that circulates in the network (QUIROGA et al, 2006).
Table 4 – Degree Centrality per producer (more central actors - degree)
Producers Degree nDegree Producers Degree nDegree
Cavideo Produções 3 0.49% Filmes do Equador 2 0.33%
Globo Filmes 3 0.49% Guilherme Fiuza Zenha
Me 2 0.33%
Gullane Filmes 3 0,49% Idéias Ideais Design & Produções Ltda 2 0.33%
Angélica Produções
Artísticas 2 0.33% Lereby Produções 2 0.33%
Aurora Filmes Ltda 2 0.33% Link Produções 2 0.33%
Bananeira Filmes 2 0.33% Mixer Produções Cinematográficas 2 0.33%
Cabra Vadia 2 0.33% O Alto Comando Cinema
e Comunicação 2 0.33%
Camisa Listrada 2 0.33% Panda Filmes 2 0.33%
Casé Filmes 2 0.33% Voglia Produções
Artísticas 2 0.33%
Film Factory do Brasil 2 0.33%
Source: Research data, 2016.
Table 4 shows that the producers Cavideo, Globo Filmes and Gullane Filmes are
the most central producers in the Brazilian cinematographic production network. This means that these actors have more relationships with other actors, having the opportunity to influence or be influenced, as well as higher chances of obtaining information that
network, which is aligned with the low values found for overall network centralization (0.50%) and density (0.00 %).
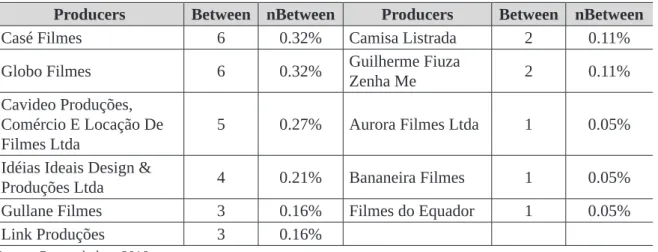
The betweenness centrality indicates the probability that an actor has to connect two other actors through the shortest (geodesic) path. These actors may also be termed as bridges. Actors with a high betweenness centrality occupy strategic positions in the network since they are more likely to exert the connection between two distinct groups
(QUIROGA et al, 2006). Table 5 shows the producers that have the highest betweenness
centrality, including the producers Casé Filmes (6) and Globo Filmes (6), which are more
likely to exert a connection between two different groups. In the sequence appear Cavideo (5), Idéias Ideais Design & Produções (4), Gullane Filmes (3) and Link Produções (3).
Table 5 – Betweenness Centrality by producer (more central actors - betweenness) Producers Between nBetween Producers Between nBetween
Casé Filmes 6 0.32% Camisa Listrada 2 0.11%
Globo Filmes 6 0.32% Guilherme Fiuza
Zenha Me 2 0.11%
Cavideo Produções,
Comércio E Locação De Filmes Ltda
5 0.27% Aurora Filmes Ltda 1 0.05%
Idéias Ideais Design &
Produções Ltda 4 0.21% Bananeira Filmes 1 0.05%
Gullane Filmes 3 0.16% Filmes do Equador 1 0.05%
Link Produções 3 0.16%
Source: Research data, 2016.
The actors’ capability to connect and access all other actors in the network is
measured by means of closeness centrality. This measure indicates the inverse of the sum
of the geodetic distances that an actor must go through to connect all other actors in the
network (FREEMAN, 1979). Thus, the higher the closeness centrality of an actor, the higher his ability to access the other actors in the network and to transmit information to them (BORGATTI; EVERETT; JOHNSON, 2013). Contrary to what happens in the case of degree and betweenness centrality measures, in the closeness centrality it is essential to
observe with whom the ego is connected to in the network. This is because, even if an actor
presents low degree and betweenness centrality, he can present high indexes of closeness centrality if he is connected to a relevant actor in the network (MOLINA, 2001).
Furthermore, in addition to the traditional Freeman’s closeness centrality, this study also analyses the Valente-Foreman’s closeness centrality. This centrality measure is
relevant for measuring the integration of an actor (ego) and its partners (alter egos) in the
network as a whole (VALENTE; FOREMAN, 1998). Table 6 shows the producers with the
highest closeness degree by Freeman (1979) and Valente and Foreman (1998). The results
show that the producers Casé Filmes, Globo Filmes, Idéias Ideais Design & Produções,
Angélica Produções Artísticas, Lereby Produções and José Augusto Costa Henriques are
the producers with higher capacity to access the other actors of the network, as well as to influence and to pass information to the other producers, and also the actors with higher integration and radiality of the ties in the network.
Table 6 – Closeness Centrality by producer (more central actors - closeness)
Producers FreeClo ValClo Producers FreeClo ValClo
Casé Filmes 20.11% 0.82% Ink Geração e
Produção de Conteúdos 20.07% 0.65%
Globo Filmes 20.11% 0.82% Gullane Filmes 20.08% 0.49%
Idéias Ideais Design &
Produções Ltda 20.10% 0.82% Camisa Listrada 20.07% 0.49%
Angélica Produções Artísticas 20.09% 0.82% Guilherme Fiuza Zenha
Me 20.07% 0.49%
Lereby Produções 20.09% 0.82% África Filmes 20.07% 0.49%
José Augusto Costa
Henriques 20.07% 0.81% Buriti Filmes 20.07% 0.49%
Cavideo Produções,
Comércio E Locação De Filmes Ltda
20.10% 0.65% Olhos de Cão Produções
Cinematográficas 20.07% 0.49% Link Produções 20.09% 0.65% Alê Abreu Produções 20.06% 0.49% 70 Filmes Produções
Artísticas Ltda 20.08% 0.65% Panorama Filmes 20.06% 0.49%
Berny Filmes Projetos
Artísticos e Culturais 20.08% 0.65% Source: Research data, 2016.
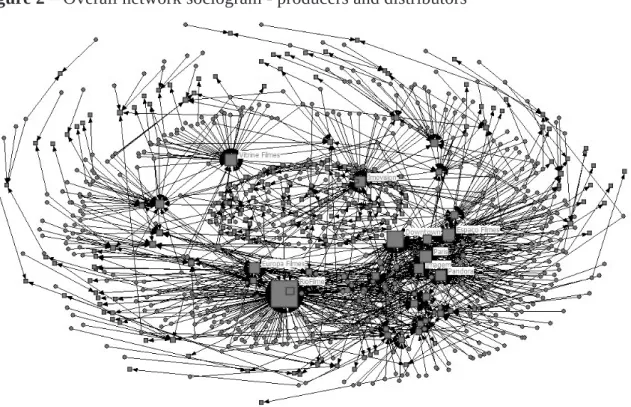
Figure 2 – Overall network sociogram - producers and distributors
Note: The isolated actors were excluded from the sociogram; square format represents the distributors, and circular format represents the producers.
Source: Research data, 2016.
In the period between 1995 and 2015, 218 film distributors were identified, with
an overall centralization of 20.80% and an overall network density of 1.00%. Through the
analysis of the overall network centralization and density, it was possible to show that the network of cooperation between producers and distributors in the Brazilian audio-visual
market is concentrated in some distributors, but it still presents a weak relation of links between these actors, that is, most producers work in isolation with small distributors.
Regarding the degree centrality of the distributors (Table 7), it can be seen that
RioFilme is the most significant distributor in the relational network structure (21.04%),
followed by the Downtown distributor (11.26 %). This data indicates that these distributors present more relations with producers and have higher chances of obtaining information
Table 7 – Degree Centrality per distributor (more central actors - degree)
Distributor Degree Distributor Degree
RioFilme 21.04% Europa Filmes 6.69%
Downtown 11.26% Imovision 6.53%
Espaço Filmes 7.50% Pandora 6.53%
Paris Filmes 7.50% Imagem 5.38%
Vitrine Filmes 7.18%
Source: Research data, 2016.
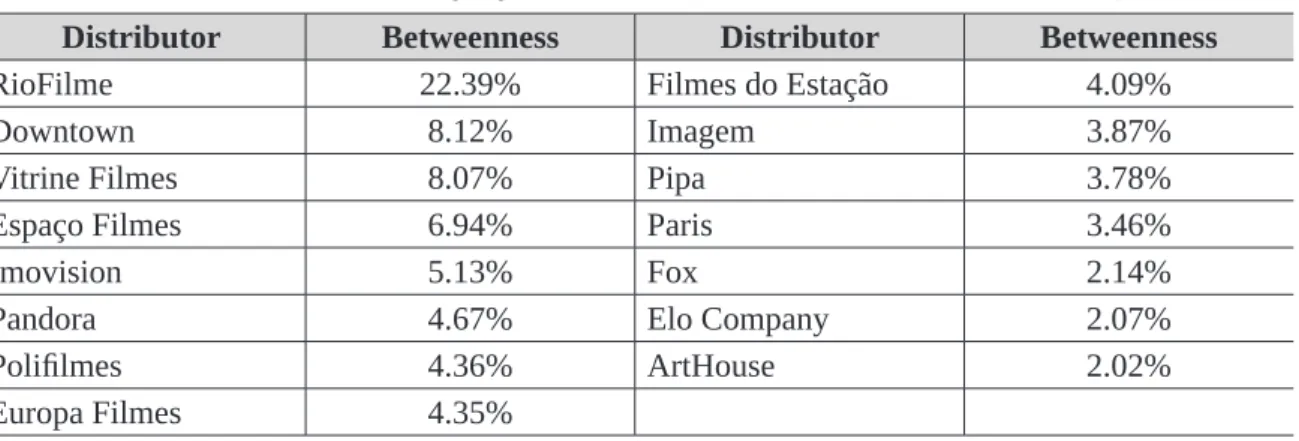
Regarding the betweenness centrality of distributors and producers (Table 8),
RioFilme (22.39%), Downtown (8.12%) and Vitrine Filmes (8.07%) stand out as central
actors. In this sense, the outstanding distributors are more likely to have a connection
between two different groups of producers, being able to obtain advantages and information in the intermediation process.
Table 8 – Betweenness Centrality by distributor (Central actors - betweenness)
Distributor Betweenness Distributor Betweenness
RioFilme 22.39% Filmes do Estação 4.09%
Downtown 8.12% Imagem 3.87%
Vitrine Filmes 8.07% Pipa 3.78%
Espaço Filmes 6.94% Paris 3.46%
Imovision 5.13% Fox 2.14%
Pandora 4.67% Elo Company 2.07%
Polifilmes 4.36% ArtHouse 2.02%
Europa Filmes 4.35%
Source: Research data, 2016.
Finally, the closeness centrality indexes demonstrate the distributors that are more likely to access the other actors in the network (producers and other distributors). Of
these, RioFilme (25.99%), Downtown (25.47%), Espaço Filmes (25.35%), and Europa Filmes (25.23%) are the distributors with higher capacity to access the producers in the
network. However, the data show that the most central players in the network do not
have a substantial advantage over their peer distributors despite having the highest values
Table 9 – Closeness Centrality by distributor (more central actors - closeness)
Distributor FreeClo ValClo Distributor FreeClo ValClo
RioFilme 25.99% 0.57% Filmes do Estação 24.69% 0.57%
Downtown 25.47% 0.57% Lumière 24.60% 0.57%
Espaço Filmes 25.35% 0.57% Columbia 24.49% 0.57%
Europa Filmes 25.23% 0.57% Polifilmes 24.44% 0.57%
Imagem 25.17% 0.57% Sony 24.35% 0.57%
Paris 25.17% 0.57% Mais Filmes 24.33% 0.57%
Imovision 25.14% 0.57% Raiz Filmes 24.22% 0.57%
Disney 24.91% 0.57% Elo Company 24.19% 0.57%
Vitrine Filmes 24.89% 0.57% Califórnia 24.11% 0.57%
Warner 24.86% 0.57% Paramount 24.06% 0.57%
Pandora 24.83% 0.57% PlayArte 24.03% 0.57%
Fox 24.83% 0.57% MovieMobz 24.03% 0.57%
Buena Vista 24.83% 0.57% Videofilmes 24.00% 0.57%
MAM 24.77% 0.57% Panda Filmes 24.00% 0.57%
S. Ribeiro 24.72% 0.57%
Source: Research data, 2016.
Concluding remarks
The purpose of the present study was to map and analyse the social interactions in cinematographic production and distribution in Brazil, presenting network relationships as a mode of managing the economic actors in the Brazilian film industry. The development of this study is justified since the analysis of the relational capabilities between social actors has recently gained relevance. Such evidence is given by the apparent need for relationships between the most diverse stakeholders and their environments of interest. In addition, the business activity in the audio-visual sector has stood out in terms of economic relevance at a global level, playing
a role of vital importance in the cultural, social and economic scope of nations.
Through the analysis of the network overall centralization and density, it was
possible to show that the networks of cooperation between the producers, as well as between
producers and distributors present in the Brazilian audio-visual industry, still presents weak links. Thus, the data suggest that cooperation in this sector is very restricted and dispersed, making a broader evolution of the Brazilian audio-visual industry in general, and film in specific, unlikely.
As for future studies, it is suggested to evaluate the relations of cooperation between producers and distributors considering the performance of productions in terms of revenue
and distributors can affect the possibility of access to private sponsorships, as well as government subsidies. In the same way, it is recommended to expand the analysis of the networks for the other levels of the film industry value chain in future studies, including the networks of directors, actors and producers of cinema, so that the films’ success may be evaluated through the network structures in which they are embedded in.
References
BORGATTI, S.P. Centrality and AIDS. Connections, v.18, n.1, p.112-114, 1995.
BORGATTI, S.P.; EVERETT, M.G. Notions of position in social network analysis. Sociological Methodology, v.22, p.1-35, 1992.
BORGATTI, S.P.; HALGIN, D.S. On network theory. Organizational Science,v.22, n.5, p.1168-1181, 2011.
BORGATTI, S.P.; OFEM, B. Overview: Social network theory and analysis. In: DALY, A. J. (Ed.). Social Network Theory and Educational Change. Cambridge, MA: Harvard Education Press, p.17-30, 2010. BORGATTI, S.P.; EVERETT, M. G.; FREEMAN, L. C. UCINET 6.69. Analytic Technologies. Harvard: MA, 2004.
BORGATTI, S.P.; EVERETT, M.G.; JOHNSON, J.C. Analyzing Social Networks. London: Sage, 2013.
BRASS, D.J. A social network perspective on organizational psychology. In: KOZLOWSKI, S.W.J. (Ed.). Oxford Handbook of Organizational Psychology. Nova Iorque: Oxford University Press, p.667-695, 2012.
BURT, R.S. Models of network structure. Annual Review of Sociology, v.6, p.79-141, 1980.
CARVALHO, M.; FISCHER, T. Redes sociais e formação de alianças estratégicas: o caso do Multiplex Iguatemi. Revista de Administração Pública, v.34, n.6, p.199-218, 2000.
COE, N.M. The view from out West: embeddedness, inter-personal relations and the development of an
indigenous film industry in Vancouver. Geoforum, v.31, n.4, p.391-407, 2000.
DEGENNE, A.; FORSÉ, M. Introducing Social Networks. Londres: Sage, 1999.
ELIASHBERG, J.; ELBERSE, A.; LEENDERS, M.A.A.M. The motion picture industry: critical issues in
practice, current research, and new research directions. Marketing Science, v.25, n.6, p.638–661, 2006. FENSTERSEIFER, J.; TIBERGHIEM, R.; DROUVOT, H.; ULHARUZO, C. O papel das redes de cooperação
na política tecnológica das pequenas e médias empresas. In: ENCONTRO DA ASSOCIAÇÃO NACIONAL DE PÓS-GRADUAÇÃO E PESQUISA EM ADMINISTRAÇÃO, 21. 1997. Angra dos Reis. Anais... Angra dos Reis: ANPAD, 1997.
FREEMAN, L. C. Centrality in social networks: I. Conceptual clarification. Social Networks, v.1, 1979.
GEORGE, K.D.; JOLL, C.; LYNK, E.L. Industrial organization: competition, growth and structural change. Nova Iorque: Routledge, 1991.
GIMENEZ, F.A.P.; ROCHA, D.T.; SANTOS, F.L.X. Vinte anos da retomada: dinâmica da concentração da
produção e distribuição do filme brasileiro no mercado nacional. Revista EPTIC, v.17, n.3, p.201-225, 2015. GRANOVETTER, M.S. The strength of weak ties. American Journal of Sociology, v.78, n.6, p.1360-1380, 1973.
GROSSER, T.J.; BORGATTI, S.P. Network Theory/Social Network Analysis. In: McGEE, R.J.; WARMS,
R.L. Theory in social and cultural anthropology: An encyclopedia. Thousand Oaks: Sage, p. 595-598, 2013.
HAUSMANN, R.; HIDALGO, C.A. The network structure of economic output. Journal of Economic
HUTT, M.D.; STAFFORD, E.R.; WALKER, B.A.; REINGEN, P.H. Defining the social network of a strategic
alliance. Sloan Management Review, v.41, n.2, p.51-62, 2000.
KIRSCHBAUM, C. Renascença da indústria brasileira de filmes: destinos entrelaçados? Revista de Administração de Empresas, v.46, n.3, p.58-71, 2006.
LEE, S.; MONGE, P. The coevolution of multiplex communication networks in organizational communities.
Journal of Communication, v.61, n.4, p.758-779, 2011.
LOIOLA, E.; LIMA, C.L.C. Redes sociais na produção de filmes da “Novíssima Onda Baiana”. Políticas Culturais em Revista, v.1, n.2, p.88-123, 2009.
LORRAIN, F.; WHITE, H.C. Structural equivalence of individuals in social networks. Journal of Mathematical Sociology, v.1, n.1, 1971.
MARTELETO, R.M. Análise de redes sociais – aplicação nos estudos de transferência de informação. Ciência da Informação, v.30, n.1, p.71-81, 2001.
MARTES, A.C.B.; GONÇALVES, S.A.; NASCIMENTO, M.R.; AUGUSTO, P.O.M. Redes e empresas:
imersão social, estratégia e inovação organizacional. In: CRUZ, J.A.W.; MARTINS, T.S.; AUGUSTO, P.O.M. Redes Sociais e Organizacionais em Administração. Curitiba: Juruá, p.19-42, 2008.
MOLINA, J.L. El Análisis de Redes Sociales: una introducción. Barcelona: Ediciones Bellaterra, 2001. NAGIB, L. O cinema da retomada: depoimentos de 90 cineastas dos anos 90. São Paulo: Editora 34, 2002.
PANGARKER, N.A.; SMIT, E. The determinants of box office performance in the film industry revisited.
South African Journal of Business Management, v.44, n.3, p.47-58, 2013.
QUIROGA, A.; MARTÍ, J.; JARIEGO, I.M.; MOLINA, J.L. Talleres de autoformación com programas
informáticos de análisis de redes sociales.Barcelona: Ediciones Bellaterra, 2006.
ROSSONI, L.; HOCAYEN-DA-SILVA, A.J.; FERREIRA-JUNIOR, I. Aspectos Estruturais da Cooperação entre Pesquisadores no Campo de Administração Pública e Gestão Social: Análise das Redes entre Instituições no Brasil. In: ENCONTRO DE ADMINISTRAÇÃO PÚBLICA DA ANPAD, 2. 2006. São Paulo. Anais... São Paulo: ANPAD, 2006.
SACOMANO-NETO, M.; TRUZZI, O.M.S. Posicionamento estrutural e relacional em redes de empresas: uma
análise do consórcio modular da indústria automobilística. Gestão da Produção, v.16, n.4, p.598-611, 2009. SCOTT, J. Social network analysis: a handbook. 2.ed. Londres: Sage, 2000.
UZZI, B. The sources and consequences of embeddedness for the economic performance of organizations: The
network effect. American Sociological Review, v.61, n.4, p.674-698, 1996.
VALENTE, T.W.; FOREMAN, R.K. Integration and radiality: Measuring the extent of an individual’s connectedness and reachability in a network. Social Networks, v.20, p.89-109, 1998.
VAN AKEN, J.E.; WEGGEMAN, M.P. Managing learning in informal innovation networks: overcoming the Daphne-dilemma. R&D Management, v.30, n.2, p.139-149, 2000.
WELLMAN, B. An egocentric network tale: comment on Bien et al. (1991). Social Networks, v.15, n.4, p.423-436, 1993.
WASSERMAN, S.; FAUST, K. Social Network Analysis: Methods and Applications. Cambridge: Cambridge
Daniela Torres da Rocha
Post-doctorate in Administration from the Federal University of Paraná. PhD in Administration from the Pontifical Catholic University of Paraná. Master in Business Administration from the Pontifical Catholic University of Paraná. Bachelor of Administration from the Pontifical Catholic University of Paraná. She acts as a consultant in business management and public management. Preferably
studies the area of OrganizationalStrategy,ResearchMethodologiesandTeachinginAdministration andAccounting. It develops research using both quantitative methods (univariate, bivariate and multivariatetechniques)andanalysisofsocialnetworks,aswellasqualitativewiththeuseofATLAS tisoftware.E-mail: [email protected].
Leandro Rodrigo Canto Bonfim
Doctorate of the Graduate Program in Administration of the Federal University of Paraná (PPGADM / UFPR) in the research line Innovation and Technology. Master in Administration by PPGADM / UFPR in the research line Strategy and Organizational Analysis, and bachelor in Business Administration from the State University of Paraná (Unespar). He is a member of the Group of Studies in Management of Innovation, Technology and Sustainability (EGITS), at UFPR and vice-leader of the Group of Research Entrepreneurship, Knowledge in Organizations and Institutions,
at the Universidade Tecnológica Federal do Paraná (UTFPR). analysis of social networks,
interorganizational networks, organizational institutionalism, innovation and technology, social innovation, and organizational strategy. E-mail: [email protected].
Fernando Antonio Prado Gimenez
He holds a bachelor’s degree in Business Administration from the State University of Londrina (1981), a Master’s degree in Business Administration from the University of São Paulo (1983) and a PhD from Manchester Business School (1995) and specialization in Cinema (2014). He is currently professor of the Department of General and Applied Administration of the Federal University of
Paraná. He has experience in the area of Administration, with emphasis in Business Administration,
working mainly in the following subjects: entrepreneurship, strategy, small company, administration
and creative leadership. E-mail: [email protected].
Michael William Citadin
Doctor with a double degree, in Administration by the Postgraduate Program in Administration of the Pontifical Catholic University of Paraná (PPAD/PUCPR) and in Business Sciences by the Business Administration program of the School of Economics and Management of the University of Minho (Portugal). Master in Administration by the PPAD/PUCPR and bachelor in Administration by PUCPR. He is a member of the Research Group on Organizations and Social Relations at PUCPR. Evaluator
of the National Association of Graduate Studies and Research in Administration (EnANPAD), the
Meeting of Organizational Studies (EnEO) and the journal REBRAE, working in the area of social networks analysis. E-mail: [email protected].
Received on: 05.10.2017 Accepted on: 02.06.2018