UNIVERSIDADE DE LISBOA
FACULDADE DE CIÊNCIAS
DEPARTAMENTO DE BIOLOGIA ANIMAL
Ecological indicators of the effects of multiple farming activities
in a Mediterranean High Nature Value Farmland
Bernardo Reis Rocha
Mestrado em Ecologia e Gestão Ambiental
Dissertação orientada por:
Doutor Mário Boieiro (cE3c-FCUL)
Doutora Paula Matos (cE3c-FCUL)
I
Agradecimentos / Acknowlegments
Primeiramente gostaria de agradecer à Doutora Cristina Branquinho, ao Doutor Mário Boieiro à Doutora Paula Matos e ao Doutor Pedro Pinho pela oportunidade que me concederam para desenvolver a minha tese de mestrado sob a sua alçada. Este ano que passou sob a vossa orientação permitiu-me abrir horizontes de conhecimento e criar dinâmicas de trabalho novas, que vou levar comigo no futuro. Apesar de oficialmente apenas o Doutor Mário Boieiro e a Doutora Paula Matos serem meus orientadores, também a Doutora Cristina Branquinho e o Doutor Pedro Pinho foram importantíssimos para a concretização deste estudo.
Obrigado pelo auxílio, partilha de conhecimentos, orientação e amizade. Foram pessoas muito importantes nesta caminhada e espero que continuem a sê-lo no futuro. A vossa dedicação à ciência é uma inspiração para qualquer iniciante na “modalidade”.
Às minhas companheiras de campo, as quase doutoras Clara Wendt e Joana Vieira. À Clara pelo auxílio na montagem e recolha dos pitfalls dos escaravelhos e à Joana pelas horas infindáveis, de lupa na mão, a identificar e contar líquenes. Sem ambas ainda hoje estaria na Companhia das Lezírias a trabalhar. Aproveito também para vos desejar boa sorte nos vossos doutoramentos.
À Cristiana Aleixo, pela ajuda relativamente à recolha de informação sobre diversas variáveis ambientas e na construção dos mapas, sendo indispensável para que este trabalho fosse concretizado com sucesso.
A todas as pessoas no laboratório de entomologia e do grupo e-Changes pela simpatia e espírito de grupo que sempre demostraram. Ajudaram a que este ano tenha sido proveitoso não só do ponto de vista académico mas também na construção de amizades.
Um obrigado muito especial a todos os trabalhadores com que me cruzei na Companhia das Lezírias, pela simpatia e disponibilidade total que sempre mostraram, durante todo o trabalho que lá realizei. Ao Engenheiro Rui Alves um muito obrigado por se ter disponibilizado a reunir connosco e autorizado a que pudesse usar o espaço da Companhia para este projecto.
Um obrigado à minha família por me apoiar e permitir seguir o meu sonho e aos meus amigos por todos os momentos de boa disposição que partilhámos.
Este último ano foi exigente, mas muito gratificante. Concluo hoje mais um passo na minha vida académica, ciente que o caminho é longo, mas proveitoso. A minha vontade de fazer ciência é hoje maior do que era há um ano atrás. A isso se deve todas as pessoas com quem me cruzei durante este ano.
III
Resumo
Devido às pressões antropogénicas de uma população em constante crescimento, as alterações na intensificação dos usos do solo são, hoje, uma ameaça séria à biodiversidade. Os sistemas agroflorestais apresentam-se como locais com usos de solo bastante diversos e sujeitos a alterações frequentes. Muitas destas alterações, tais como a transformação de espaços florestais em campos para agricultura ou pastoreio intensivo, e a consequente adição de produtos químicos, acabam por ameaçar os ecossistemas terrestres e aquáticos e consequentemente diminuir a qualidade dos serviços que estes sistemas oferecem.
Na bacia do Mediterrâneo o montado estabelece-se como um dos principais sistemas agroflorestais. Em condições normais, o montado apresenta-se como um sistema agro-silvo-pastoril, onde os usos do solo vão desde o pastoreio intensivo ou extensivo, à produção de cortiça, entre muitas outras atividades. Nas zonas próximas do montado, outras atividades agrícolas, tais como a agricultura intensiva, irrigada e fertilizada também estão presentes. Para além disso, estes sistemas têm também um grande interesse conservacionista. Uma elevada biodiversidade de fauna e flora acompanhado pelo risco de degradação iminente, torna o montado um local de elevada importância ecológica, estando assim classificado como Hotspot de biodiversidade e High Nature Value Farmland (HNVF). O montado pode ser dividido em montado de sobro e montado de azinho, dependendo se a espécie arbórea dominante é o sobreiro, Quercus suber, ou a azinheira, Quercus ilex. Em ambos os ecossistemas, a paisagem é tradicionalmente caracterizada por ter uma pequena densidade de Quercus e um subcoberto composto por herbáceas e arbustos. No entanto, a abundância de bens e serviços que providencia e a grande diversidade de usos do solo são grandes atrativos económicos para o Homem, que assim realiza um conjunto de práticas que muitas vezes exercem uma pressão excessiva sobre estes ecossistemas e colocam em risco a sua biodiversidade.
Uma dessas práticas é o pastoreio, que na região ribatejana e alentejana é predominantemente de gado bovino. A atividade deste tipo de gado é altamente impactante a vários níveis, desde a depleção do subcoberto vegetal e consequente aparecimento de solo nu, ao pisoteio que degrada solos, destrói a vegetação e impede a germinação das sementes, até à emissão de compostos gasosos azotados como a amónia que altera as propriedades químicas do solo, cria eutrofização nas massas de água e promove a criação de compostos azotados na atmosfera. Outra das práticas que pode ocorrer no local ou em zonas agrícolas na envolvente destes sistemas agroflorestais é a aplicação de fertilizantes, normalmente ricos em compostos azotados e fosfatados, e que com determinadas condições climáticas podem ser transformados em compostos voláteis tais como a amónia, sendo muito tóxicos para a biodiversidade em concentrações elevadas. As práticas florestais, com ênfase no descortiçamento e no desmatamento, são igualmente impactantes na medida em que o primeiro torna os sobreiros mais suscetíveis a pragas e doenças e o segundo altera a estrutura e composição da vegetação, o que posteriormente afeta os solos e o microclima. Por fim, importa ainda referir que se prevê que as alterações climáticas terão um efeito negativo a médio e longo prazo nestes sistemas agroflorestais. As previsões para a região da bacia do Mediterrâneo apontam para a ocorrência de menores valores médios de precipitação e maiores valores médios de temperatura o que, numa zona já de si seca e quente, irá provocar a ocorrência de secas extremas, contribuindo para o aumento das áreas desertificadas e erodidas.
É então premente que se desenvolvam ferramentas que permitam balancear a gestão e exploração económica dos ecossistemas agroflorestais de High Nature Value Farmland (HNVF) com a procura por manter a estrutura e funcionamento ecológicos para que estes continuem a providenciar os bens e serviços de regulação e manutenção tão necessários para a gestão dos recursos a longo prazo.
IV
Assim, o objetivo deste trabalho é determinar as influências que as várias atividades agrícolas exercem sobre a biodiversidade que estes ecossistemas albergam e assim criar uma ferramenta de gestão a ser aplicada nestas áreas. Para isso, efetuou-se a análise de dois indicadores ecológicos, sendo eles os líquenes epifíticos e os escaravelhos coprófagos. Essa escolha deveu-se ao facto de ambos os grupos serem sensíveis à eutrofização, especialmente às alterações das concentrações de azoto (na atmosfera e nos solos, respetivamente) e disponibilidade de nutrientes, bem como à alteração da estrutura da floresta, permitindo-nos assim avaliar os possíveis impactos dos vários usos do solo na biodiversidade do montado. Desta forma é possível fazer uma gestão que otimiza a conservação da biodiversidade e o retorno económico proveniente das atividades agrícolas.
O estudo foi efetuado na companhia das Lezírias, situada a este da Reserva Natural do Estuário do Tejo. A companhia das Lezírias engloba uma área de aproximadamente 18 mil hectares, e é composta por diversas parcelas de terreno com diferentes usos de solo, incluindo uma área considerável de montado de sobro. Esta propriedade é monitorizada há já dezenas de anos pelo que existem dados detalhados de todas as atividades agroflorestais que nela ocorrem. Foi assim possível criar um gradiente do uso do solo a partir desses dados. Esse gradiente variava entre a exclusão de pastoreio (máximo de 19 anos sem pastoreio) em algumas parcelas, até ao pastoreio máximo de 2,82 cabeças de gado bovino por hectare, por ano. Foram posteriormente selecionadas 18 parcelas onde foram analisadas as comunidades de líquenes epifíticos em 113 sobreiros e posicionadas 90 armadilhas iscadas com excrementos de bovino para captura de escaravelhos coprófagos.
A estrutura das comunidades dos indicadores ecológicos e respetivas variáveis dos grupos funcionais foram correlacionadas com diversos fatores ambientais, incluindo diversos parâmetros do solo, a humidade da canópia (Normalized Difference Moisture Index – NDMI), a temperatura à superfície da paisagem (através dos valores de Land Surface Temperature - LST), as perturbações locais causadas pelo pastoreio, pela fragmentação e pelo tráfego motorizado no interior da Companhia e as perturbações causadas pela agricultura intensiva nas zonas adjacentes à área de estudo. A escolha destes fatores ambientais, em detrimento de outros, deveu-se ao facto de eles terem frequentemente um papel mais relevante nas variações da composição e estrutura das comunidades. Essas variações são provocadas pelos usos de solo existentes na área de estudo e zonas adjacentes, quer ao nível da poluição, eutrofização, alterações na vegetação e microclima. Assim, recorrendo a uma abordagem multi-taxa ao nível local e da paisagem poderemos identificar quais as principais ameaças para a biodiversidade existente.
Ao nível dos líquenes epifíticos, mais sensíveis às alterações atmosféricas, a proximidade de explorações agrícolas intensivas revelou-se como os fator mais importante para explicar as diferenças na abundância dos grupos funcionais deste indicador ecológico, entre as parcelas estudadas. Tal se deve à aplicação intensiva de fertilizantes com compostos azotados nos arrozais e culturas temporárias de regadio, como os campos de milho, adjacentes à área de estudo. Parte destes compostos azotados, tais como a amónia, são dispersados pelo vento e acabam por se depositar no interior da área de
montado, acabando por impactar a biodiversidade de líquenes existente. A intensidade do pastoreio,
com exceção da área com maior intensidade (zona de concentração de gado bovino) de pastoreio, não mostrou ser a fonte principal de impacto na biodiversidade dos líquenes, muito provavelmente devido a esse pastoreio ser extensivo e de baixa intensidade. Isto leva a que a quantidade de amónia produzida esteja abaixo do nível crítico, a partir do qual as comunidades de líquenes respondem a este tipo de perturbações. Também não se identificou nenhuma associação entre as comunidades de líquenes e a proximidade às estradas, pois estas registam níveis muito baixos de tráfego e consequentemente não são fontes de poluição. Em relação aos escaravelhos coprófagos, foram detetados alguns padrões apesar do suporte estatístico ter sido baixo. Tal poderá ter-se devido à amostragem não ter coincidido
V
com o pico de atividade deste grupo (mais no final da Primavera). Mesmo assim, conseguimos identificar algumas associações de diversos parâmetros do solo, áreas de má qualidade e a humidade da canópia com as comunidades de escaravelhos. Diversos parâmetros do solo e as áreas menos propícias à existência de escaravelhos coprófagos revelaram ser os factores mais importantes para explicar as mudanças nas comunidades deste indicador.
É fundamental para a manutenção da biodiversidade, dos bens e serviços do montado que a sua gestão tenha em conta a intensidade do pastoreio. Os resultados mostram, por exemplo, que a partir das 3 cabeças de gado por hectare de pasto, por ano, deixa de ser possível manter os níveis de biodiversidade de líquenes iguais aos de zonas não pastoreadas. É também necessário ter em atenção aos usos de solo e intensidades dos mesmos em zonas adjacentes às áreas de montado, tais como as zonas agrícolas fertilizadas. Assim, zonas agrícolas intensivas devem estar localizadas a pelo menos 1 km de zonas com importância para a conservação. Este estudo pretende assim construir uma ferramenta de gestão capaz de perceber quais os impactos que as múltiplas atividades agrícolas exercem sobre os sistemas de montado.
VII
Abstract
Changes in the type and intensity of land-use are two of the main factors threatening biodiversity worldwide, especially in ecosystems with diverse land uses, like agro-forestry ones. These changes, driven by the need to keep up with the provision of goods and services might be damaging to our ecosystems and at the long-term increase the risk of disrupting the services they provide.
Nowadays, two of the most impacting land uses are farming and livestock breeding, due to water and air pollution and consequent eutrophication on soils and water bodies, thereby reducing the health and biodiversity of terrestrial and aquatic ecosystems. In the Mediterranean basin, one of the most iconic agro-forestry systems is the montado area. These areas are agro-silvo-pastoral systems that sustain diverse activities within it such as livestock breeding and cork production. Around it we can also find other agriculture activities, such as cereals and vegetables crops. Traditionally, most activities within the montados are performed with low intensity. As a consequence, these ecosystems were considered to have high interest for conservation, being label as High Nature Value Farmlands. However, when management is more intense, it can impact biodiversity and the services that these ecosystems provide. Climate changes will also add an extra pressure on montado ecosystems, due to changes in precipitation and temperature. Thus, it is vital to improve the management and the practices that occur inside and close to these areas. Our general aim was to build a management tool to understand the impacts of multiple farming activities in High Nature Value montado areas. This was done considering the effects of grazing intensity and its exclusion within the woodlands, and simultaneously the effects of nearby intensive agriculture. The tool was based in the use of lichens and coprophagous beetles as ecological indicators of these impacts, using different biodiversity metrics, in air and soil compartments, respectively.
A study was done in Companhia das Lezírias, a state farm with almost 18 thousand hectares, divided in dozens of plots with different land uses intensities, thus creating a gradient of intensity ranging from plots in grazing exclusion (maximum of 19 years excluded) to plots with maximum grazing intensity of 2.82 cattle heads per hectare, per year. We focused on analysing two ecological indicators, epiphytic lichens and coprophagous beetles. Both are sensitive to eutrophication, nutrients availability and changes in vegetation structure, thus being suitable indicators to evaluate possible impacts from the different land uses in montado.
All functional groups of epiphytic lichens showed, primarily, an effect of the nitrogen compounds deposition from the fertilizers used in crops surrounding the study area. Those fertilizers end up being dispersed by the wind and deposited inside the montado area, thus impacting lichens biodiversity. Coprophagous beetles’ communities showed to be associated with local soil characteristics, with the amount of surrounding habitats with poor suitability to host beetles and the vegetation moisture. Thus, cattle’s grazing was not a major impact source for the selected ecological indicators. This was likely due to the low intensity grazing.
We concluded that lichens are good ecological indicators to access impacts caused by nitrogen compounds from fertilizers inputs in nearby farming activities as they responded well to the impacts caused by the nitrogen deposition. In turn, coprophagous beetles’ communities’ didn´t allow us to determine the impact of any of the farming activities present in the study area. Nonetheless, if further studies take in consideration the soil characteristic of the sampled sites, beetles may reveal to be good ecological indicators of multiple farming activities.
IX Index Agradecimentos / Acknowlegments ... I Resumo ... III Abstract ... VII List of figures ... XI List of tables ... XIII
1. Introduction ... - 1 -
1.1. The impact of agriculture activities ... - 1 -
1.2. Montado and its landscape ... - 4 -
1.3. Ecological indicators... - 6 -
1.3.1. The use of epiphytic lichens biodiversity as ecological indicators ... - 7 -
1.3.2. The use of coprophagous beetle’s biodiversity as ecological indicators ... - 8 -
1.4. Objectives ... - 10 -
2. Methodology ... - 11 -
2.1. Study area ... - 11 -
2.2. Sampling design ... - 13 -
2.2.1. Epiphytic lichens sampling ... - 14 -
2.2.2. Coprophagous beetles sampling ... - 16 -
2.3 Environmental Data ... - 18 -
2.4 Statistical analysis ... - 21 -
3. Results ... - 22 -
3.1. Lichen diversity analyses ... - 22 -
3.2. Beetles’ diversity analyses: ... 28
4. Discussion ... 35
4.1. Air compartment ... 35
4.2. Soil compartment... 36
4.3. Building a tool for management ... 37
5. Conclusions ... 41
6. References ... 43
XI
List of figures
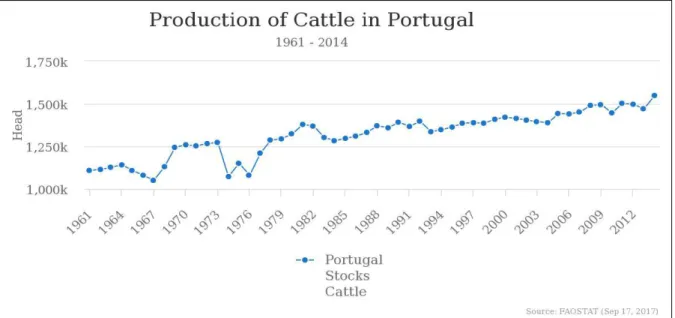
Figure 1.1.1: Evolution of the number of cattle heads worldwide (1961-2014). Source: (Organization of the United Nations,
2017)
Figure 1.1.2: Evolution of the number of cattle heads in Portugal (1961-2014). Source: (Organization of the United Nations,
2017)
Figure 1.2.1: Geographical distribution of biodiversity hotspots worldwide. Source: (Internacional Conservation, 2017) Figure 1.2.2: Distribution of the High Nature Value Farmland (HNVF). Source: (European Environmental Agency, 2017) Figure 1.3.1.1: Examples of the three lichens growth forms. From left to right: foliose broad lobe (Xanthoria parietina),
foliose narrow lobed (Physcia adscendens); and fruticose (Usnea rubicunda). Photos by: P. Matos and P. Pinho
Figure 1.3.2.1: Coprophagous beetles’ functional groups, regarding the dung manipulation method trait. Source: (K. D.
Floate, 2011)
Figure 2.1.1: Map of the main land-uses present in the “Charneca” site inside "Companhia das Lezírias". Map based on
information provided by (Direção-Geral do Território, 2016). (AFS stands for Agro-forestall systems)
Figure 2.2.1: All CL plots with montado, the 19 sampling sites (tringles) and the 42 plot divisions. Note that one additional
site was selected for lichen sampling only (due to time-constrains) due to the area within the plot having much more heavily grazing intensity levels than the centroid, and was added to the sampling.
Figure 2.2.1.1: Sampling grid for lichen sampling composed of 5 contiguous quadrats. The grid is placed in four different
positions accordingly to the four cardinal points (north, south, east, and west). Source: (Asta, Erhardt, Ferretti, & Fornasier, 2002)
Figure 2.2.2.1: Dung baited pitfall trap. Cup is filled with a solution and buried in the soil (top of the cup matching soil
surface). Dung bait is placed in the middle of the cup and a plate is placed on top of it. Source: (Johan Kotze et al. 2011) (modified)
Figure 3.1.1: NMS joint plot showing the ordination of sampling sites (triangles) according to epiphytic lichen communities.
The first two axes explained, respectively, 85.2% and 12.2% of the variance. Vectors represent environmental factors and lichen functional groups. Only significant variables are shown to prevent overcrowding. Environmental factors: N 1500m is the amount of nitrogen compounds emitted from fertilizers use in a 1500m buffer from each of our sampling sites. Functional group variables: Fob, Fon and Fr stand, respectively, for Foliose with broad lobe, Foliose with narrow lobe and Fruticose growth forms; Asx and Sex stands, respectively, for asexual and sexual main reproduction type; S-Neu and Bas stands for sub-neutral and basic substrate pH, respectively; Expo and Direct for sun-exposed and very high direct solar irradiation, regarding tolerance to solar irradiation. Mesop and Xerop for mesophytic and xerophytic lichens, regarding lichens aridity tolerance; Lastly, Meso, Nitro and Oligo stands, respectively, for mesotrophic, nitrophytic and oligotrophic lichens, regarding their eutrophication tolerance.
Figure 3.1.2: Spatial interpolation of the oligotrophic lichens CWM values calculated for the sampled sites and estimated for
the 307 non-sampled sites. In this map, areas coloured in blue translate the highest oligotrophic abundance values, in yellow the medium values and in blue the lowest values. Black dots correspond to the sampled points, black crosses to the regularly spaced points, the white dotted areas the rice fields and the white stripped areas the watered temporary crops. Black lines correspond to the CL plots boundaries.
Figure 3.2.1: NMS joint plot showing the ordination of sampling sites (triangles) according to coprophagous beetles’
communities. Vectors represent environmental factors and beetles functional groups. Environmental factors: Soil Pot, Soil Act and Soil Text stands for, respectively, for the potential permeability, actual permeability and the texture of the soil. Size B and D stands for, respectively, size classes between 0.475 cm to 0.95 cm and 1.426 cm to 1.9 cm. Roll are the rollers functional group. Lastly, W and NW stand for, respectively, winged and no winged functional groups. The three axes explained, respectively, 48.2%, 21.7% and 14.2% of the variance.
Figure 4.3.1: Spatial interpolation of the NH3 values estimated for the 307 non-sampled sites. In this map, areas coloured in
blue and light green translate the areas with NH3 concentrations lower than the critical levels (1.9µg/m3) while areas coloured in yellow, orange and red translate the areas with NH3 concentrations higher than the critical levels (1.9µg/m3). Black dots correspond to the sampled points, black crosses to the regularly spaced points, the white dotted areas the rice fields and the white stripped areas the watered temporary crops. Black lines correspond to the CL plots boundaries.
XIII
List of tables
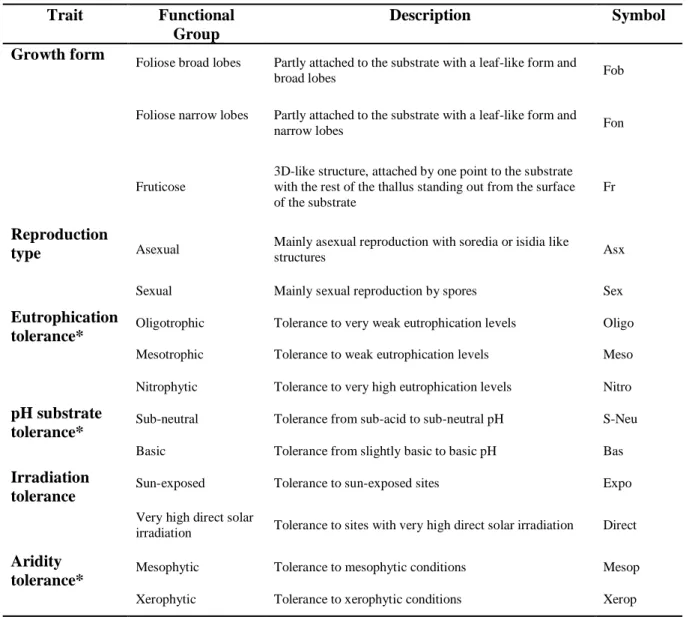
Table 2.2.1.1: Traits and related functional groups following (Nimis, 2016; Smith et al. 2009). *When species were
classified within two or more classes, we chose the highest class to translate the species tolerance.
Table 2.2.2.1: Beetle traits and related functional groups following Baraud (1992), Britton (2012) and; Jessop (1986). Table 2.3.1: List of all environmental factors tested.
Table 3.1.1: Spearman correlations between lichen taxonomic diversity, lichen community ordination axes (NMS1 and
NMS2), and lichen trait based diversity and the environmental factors. Significance of the correlations is indicated in superscript: * = p<0.05; ** = p<0.01; *** = p<0.001; “Ns” = non-significant. The codes of the variables are explained in
Table 2.2.1.1. GI stands for grazing intensity, YE for years of exclusion, DR for distance to the road, N500 and N1500 for,
respectively, N 500m and N 1500m and LST for land surface temperature.
Table 3.1.2: Spearman correlations between the scores of the ordination of lichen communities’ (NMS1 and 2), the
environmental factors and the CMW of all lichen traits and respective functional groups. Significance of the correlation is indicated in superscript: * = p<0.05; ** = p<0.01; *** = p<0.001; “Ns” = non-significant.
Table 3.1.3: Summary of the generalized linear models examining the effects of environmental factors on axis 1 lichens’
ordination scores and two functional groups. For more information regarding the environmental factors see Table 2.3.1.
Table 3.2.1: Spearman correlations between beetles taxonomic diversity, beetles community ordination axes scores (NMS1,
NMS2 and NMS3), and beetle trait based diversity (Dung manipulation method, size class and wings presence) and the environmental factors. Significance of the correlation is indicated in superscript: * = p<0.05; ** = p<0.01; *** = p<0.001; “Ns” = non-significant. The codes of the variables are explained in Table 2.2.2.1. GI stands for grazing intensity, YE for years of exclusion, DR for distance to the road, N500 and N1500 for, respectively, N 500m and N 1500m, LST for land surface temperature, HS –Good, HS-Medium and HS-Bad for, respectively, habitat suitability – favorable land uses, habitat suitability – moderately favorable land uses and habitat suitability – unfavourable land uses, Soil Text, Soil Thick, Soil Pot and Soil Act for, respectively, soil texture, soil thickness, soil potential permeability and soil actual permeability and NDMI Apr and NDMI Jul for, respectively, NDMI April and NDMI July.
Table 3.2.2: Spearman correlations between the scores of the ordination of beetles communities’ (NMS1, 2 and 3) with the
environmental factors and the CMW of all beetles traits and respective functional groups. Significance of the correlation is indicated in superscript: * = p<0.05; ** = p<0.01; *** = p<0.001; “Ns” = non-significant.
Table 3.2.3: Summary of the generalized linear models, examining the effects of environmental factors on axis 1 scores from
the beetles’ ordination and several functional groups. For more information regarding the environmental factors see Table
- 1 -
1. Introduction
The increase in the world’s population is exerting an huge pressure in ecosystems worldwide, particularly from changes in land use type and intensity, mining ecosystems capacity to provide us with their services (Jaramillo & Destouni, 2015; Wu, 2008). Agriculture, either through crop or livestock, causes significant impacts, including soil and water eutrophication (Jaramillo & Destouni, 2015). All these impacts have impacts on biodiversity, reducing the health and integrity of the ecosystems (Falcucci et al. 2007; Flynn et al. 2009; Haines-Young, 2009; Reidsma et al. 2006); UNEP, 2002).
1.1. The impact of agriculture activities
With the rise of the world population and economic power in the last century, the cattle sector production increased quite a lot, both in beef and dairy cattle (Figure 1.1.1). According to Food and Agriculture Organization of the United Nations (2017) from 1961 to 2014, cattle increased by 500 million heads to a total of 1,5 thousand millions heads total. According to the Instituto Nacional de
Estatistica (2016), in 2016, Portugal had slightly more than 1,6 million heads, a small increase
compared to the 1,5 million heads in 2014. These numbers contrast with most of the developed countries, especially in Europe, where numbers have stabilized or even decreased (Organization of the United Nations, 2017). Portugal also experienced an intensification of the cattle sector due to a decrease in the number of cattle farms and a contrasting increase of the number of cattle heads per area, which means that each farm has more cattle density than before (Costa, 2015; Instituto Nacional de Estatistica, 2016).
Figure 1.1.1: Evolution of the number of cattle heads worldwide (1961-2014). Source: Organization of the United Nations (2017)
- 2 -
Figure 1.1.2: Evolution of the number of cattle heads in Portugal (1961-2014). Source: Organization of the United Nations (2017)
According to FAO (2014) and Thornton (2010), we expect a future decrease in cattle products consumption in developed countries. Nevertheless, cattle production is still increasing in some developed countries, like Portugal (Figure 1.1.2) and in underdeveloped countries due to further demographic rise and better financial conditions of people living in those countries. In undeveloped countries, where legislation is often bypassed, and knowledge isn’t well spread throughout society, there is a high chance of over exploitation of the environment by this sector, leading to overgrazing. Over-grazing occurs when the amount of cattle in a given area is higher than the capacity of that area to provide feedstuff. This phenomenon changes the ecological properties of the ecosystem, and the degree of that change depends upon the grazing intensity and the characteristics of the grazing area. Those changes can be seen in the air, soil and vegetation, being inter-connected between them.
The production of cattle emits massive amounts of ammonia/ammonium and methane. Ammonia/ammonium, is toxic and has direct impacts in biodiversity through soil, water and atmosphere compartments (Bussink, 1992; Ishler, 2004). In turn, methane is a gas that contributes to the greenhouse effect. Over-grazing leads to an increased bare soil percentage and susceptibility to erosion by rain and wind (Risch et al. 2007). Roots removal also potentiates a loss of soil structure (FAO, 2003). Trampling affects soil by compacting it, decreasing its infiltration rates and the nutrients dissolved in it, making the soils poorer and drier (Sharrow, 2007; Vandandorj et al. 2017). On top of that, vegetation works as a carbon dioxide sink and consequently, when removed, that reservoir is destroyed (FAO, 2015). According to Concostrina-Zubiri et al. (2017), in a study conducted at
Companhia das Lezírias, biocrusts abundance in grazed sites was very low compared to ungrazed
sites, due to trampling and browsing by cattle. Over-grazing also produces changes in the composition and structure of the vegetation. That effect is due to the quick consumption of the vegetation by the cattle, which then promotes fast growth plant species rather than the slow growing ones (Ishler, 2004). Germination, seedling survival rates and growth are also affected both by consumption and trampling (Listopad et al. 2018; Wassie et al. 2009). Losses of aboveground plant biomass also have a negative effect in the nutrients cycle because less organic matter is produced and decomposed (FAO, 2003). The most noticeable change of over-grazing is the transformation of the landscape towards more open space and low vegetation density, when compared to sites with low intensity grazing or with grazing
- 3 -
exclusion. The soil becomes more exposed and consequently more susceptible to erosion and desertification.
Establishment of grazing exclusion areas is a well-known and used management technique, to stop or mitigate ecosystems degradation and, on the long term, restore it. One of the benefits of this management practice is the transformation of the vegetation structure, with grasses being gradually replaced by shrubs and woody plants (Listopad et al. 2018). This transformation enhances vegetation cover, aboveground biomass production and higher biodiversity levels (Bugalho et al. 2011; Castro & Freitas, 2009; Listopad et al. 2018; Yan & Lu, 2015). A change towards denser and higher vegetation increases water retention in the soil and blockage of direct sun light, reducing soil and air temperature (Concostrina-Zubiri et al. 2017). These microclimatic changes induced by grazing exclusion generate differences in both fauna and flora communities. A study conducted at Companhia das Lezírias, showed that is in the first 5 years after exclusion is when the most dramatic changes in the vegetation occur (Listopad et al. 2018),. During this time interval, the distribution of shrub vegetation increased greatly while herbaceous- vegetation declined. After 15 years of exclusion, they could observe that shrubs height and tree diameter had increased significantly, meaning that this management practice can be very effective to regenerate vegetation structure.
Nitrogen is abundantly present in earth’s atmosphere as nitrogen gas (Erisman et al. 2007). Nitrogen gas (N2) cannot be used directly by living organisms. For that, nitrogen must become reactive
(Nr), either by a combination of thunderstorms and rains or by fixation by free or symbiotic bacteria with plants, through an enzyme called nitrogenase (Galloway & Cowling, 2002; LeBauer & Treseder, 2008). Reactive nitrogen is highly important to all living beings due to the fact that it is vital for the formation of organic compounds like nucleic acids for DNA formation, ATP molecules for energy storage and amino acids for proteins formation (Erisman et al. 2007; Galloway & Cowling, 2002). Nitrogen is a limiting factor for agriculture production (Bal et al. 2012; Monaghan et al. 2005; Tilman, 1987), but production of Nr in large scale was only possible in the beginning of the 20th century. At that time, German chemists Fritz Haber and Carl Bosch developed an artificial process of nitrogen fixation, using hydrogen and atmospheric N2 in order to create ammonia (NH3). From that ammonia it
was possible to produce large quantities of nitrogen fertilizers, such as ammonium nitrate, in an industrial scale (Encyclopædia Britannica, 1998). The use of fertilizers allowed humankind to enhance the production of more food (Roberta Forti & Henrard, 2016).
Fertilizers have, however, being generally over applied, especially in crops and pastures. The unused reactive nitrogen leaches into the soil, causing changes in its chemical and physical properties, turning soils more acidic, and triggering changes in biodiversity and abundance of fungal and microbial communities (McDowell et al. 2004; Bowden et al. 2004; Galloway & Cowling, 2002; Ramirez et al. 2010). The flora is also affected because nitrophytic species or species with fast growth rates end up getting advantage over species more sensitive to high nitrogen levels or with slow growth rates, causing modifications in the vegetation structure and composition. A significant part of these compounds ends up leaching to water bodies and ground water masses like rivers, lakes, underground reservoirs or oceans. This can cause eutrophication and consequently losses in water quality and aquatic biodiversity (Bal et al. 2012; Johnson et al. 2005). When ammonia volatizes, it ends up settling in soils, water masses and vegetation close to the source, either by dry or wet deposition (Asman et al. 1998; Bal et al. 2012; Pinho et al. 2009; Ruisi et al. 2005). After an input of fertilizers , the volatilization speed depends on the temperature, presence of precipitation, air velocity, humidity and soil type and pH (Bussink, 1992; Ishler, 2004) while the deposition speed changes according the precipitation, the air velocity and the size/density of the surrounding vegetation (Asman et al. 1998;
- 4 -
Bal et al. 2012). In the atmosphere, the ammonia can cause the formation of aerosols, depletion of the ozone layer in the stratosphere and others (Galloway et al. 2003; Galloway & Cowling, 2002; Ishler, 2004).
On the long term, high and continuous inputs of fertilizers cause substancial changes in biodiversity and, ultimately, changes the landscape (Bal et al. 2012; Galloway et al. 2003; Gough et al. 2000; Ramirez et al. 2010; Tilman, 1987; UNEP, 2014).
1.2. Montado and its landscape
One of the ecosystems where human management is more important and where land uses types are more diverse is the montado. The montado is an agro-silvopastoral system, an woodland structurally similar to a savannah, but is human-managed, being grazed by cattle, pig, sheep and goat. Grazing co-exist with extensive crops and a large number of other activities such as tourism, hunting and cork production, being the last one the most profitable (Associação Portuguesa da Cortiça, 2017; Pereira & da Fonseca, 2003). This ecosystem extends along the Mediterranean basin, occurring in countries like Portugal, Spain, Morocco, and others. In Portugal, montado areas occupy 756 thousand hectares, 34% of all his world extension, of which, 84% are located in the Alentejo region (Associação Portuguesa da Cortiça, 2017).
While the montado present in the innermost regions of Portugal is dominated by Quercus ilex (Holm-oak), closer to the Atlantic it is dominated by Quercus suber (Cork-oak). This happens because
Quercus suber requires higher moister levels to develop than Quercus ilex (Attorre et al. 2015). Montado areas are characterized by having a Mediterranean climate, very dry and hot during the
summer and with mild and rainy winters (Encyclopædia Britannica, 2016). The singularity of this climate allows this Mediterranean region to host a high faunistic and floristic diversity, with many endemic species. The main singularity of these ecosystems is their flora. They usually have small tree density, with the rest of the vegetation being composed by grasses and shrubs (Pereira & da Fonseca, 2003; Rodrigues, 2008). In these ecosystems, where water is a limiting factor, the vegetation evolved to create strategies to counteract that limitation (Haines-Young, 2009; Ramos et al. 2015). The vegetation starts growing in October and reaches its peak during spring, taking advantage of the greater availability of water and then, during the high temperatures and dryness of the summer, it dries up, becoming very susceptible to fire. The unique and high biodiversity and the degradation risk (more than 70% of the original habitats) associated to these ecosystems to the Mediterranean basin is recognized and led to its classification as one of the major biodiversity hotspots worldwide, especially with regard to montado habitats (Bugalho et al.2011; Myers et al. 2000; Xavier & Martins, 2000) (Figure 1.2.1).
- 5 -
Figure 1.2.1: Geographical distribution of biodiversity hotspots worldwide. Source: Myers et al (2000)
The montado is designated, according to the European Union, as a High Nature Value Farmland (HNVF) (Figure 1.2.2). This concept has started in the beginning of the 1990’s and refers to agricultural areas of high conservation value and whose agricultural management practices are fundamental to the maintenance of high biodiversity levels (Keenleyside et al. 2014). Montado landscape have, for years, been in a balance between the ecological value and economic interests from landowners, trough low intensive practices like livestock grazing, cork production and others. However, changes in the traditionally performed practices in exchange for other more profitable or simply the intensification of the original practices have led to a disruption of that balance, putting in danger the ecosystem health. The montado is a striking example of land-sparing conservation policies, where the same area supports economical yield and high biodiversity. Therefore, these areas can only subsist when the economic and ecological interests are taken in account and management policies and evenly balanced between both.
- 6 -
Figure 1.2.2: Distribution of the High Nature Value Farmland (HNVF). Source: European Environmental Agency (2017)
However, changes in the intensity of management can promote large changes in the ecosystem structure and function. Local intensification can lead to vegetation losses, soil impoverishment and render trees more weakened and susceptible to pest and diseases (Attorre et al. 2015; Cancela et al. 2013; Ministério da Agricultura, 2013). These can be further intensified by ongoing climate changes, with a reduction in the average annual precipitation levels and the rise of the average annual temperature (Haines-Young, 2009; IPCC, 2007; Ministério da Agricultura, 2013). Additionally, the landscapes around montado ecosystems can also experience intensification, with the presence of irrigated and fertilized crops and intensive cattle rising. It is therefore vital to establish a balance between intensification in the surrounding areas of the montado and the protection of its biodiversity and its services. To do that, we must provide farmers and politicians with important and reliable information about the impacts of multiple farming activities taking place in and around montado. For that we need to measure the impact of the agriculture activities that take place in the montado and in the surroundings of the montado and ecological indicators could be a good choice.
1.3. Ecological indicators
One of the ways to study the impacts of disturbances on ecosystems is by using ecological indicators. Two very common approaches focus on changes in their taxonomic composition, changes in their functional groups, or on both. According to Peñuelas et al. (2004), ecological indicators are “measurable characteristics of the structure (e.g., genetic, population, habitat, and landscape pattern), composition (e.g., genes, species, populations, communities, and landscape types), or function (e.g., genetic, demographic/life history, ecosystem, and landscape disturbance processes) of ecological systems.” Ecological indicators started being used during the last century and the number of studies using them multiplied ever since (Matos et al. 2017) . This is due to the many advantages of their use compared to other, more analytical methods (e.g. chemical assays and the measurement of physical parameters). Their responses integrate the direct effect of the impact sources on the ecosystem. Besides, we have more sampling sites at lower cost and with a higher resolution (Branquinho, 2001; Branquinho et al. 2015). The preference for the use of ecological indicators was due to the fact that
- 7 -
they are cost-effective without compromising the efficiency and reliability while measuring/describing the effects of different environmental changes on ecosystems structures. Moreover, information provided by ecological indicators is simple and therefore can be easily communicated to practitioners and decision makers. Several metrics can be used to measure the effects of both structure and functioning of montado ecosystems as High Nature Value Farmland (HNVF). Taxonomy based metrics are commonly used (Giordani, 2007; Gotelli & Colwell, 2001; Jorge M. Lobo & Martín-Piera, 2002; Pinho et al. 2003). Furthermore, though taxonomy based metrics may respond, they do not provide insights on the drivers of the changes in those communities and may offer no reliability when trying to compare geographical distant sites (Mouillot et al. 2014). For that reason, we also used shifts in the communities and functional trait based metrics. Functional trait metrics were used successfully in several studies before, namely in this type of ecosystems (Gotelli & Colwell, 2001; Jorge M. Lobo & Martín-Piera, 2002; Pinho et al. 2012; Pedro Pinho et al. 2011). So, we adopted a functional trait approach, by classifying each species based on their characteristics (traits) regarding their response to the expected impacts addressed in our study (Laureto et al. 2015; Mouillot et al. 2014). Species with similar characteristics are then grouped into functional groups and used in functional trait metrics.
In this study, to evaluate the impact of multiple farming activities in a High Nature Value
montado area, we decided to select coprophagous beetles and epiphytic lichens as our ecological
indicator organisms. Beetles were used as proxy of the effects in the soil compartment. They are known indicators of the quantities of manure produced by cattle (Jorge M. Lobo et al. 2006; Peck & Howden, 2017; Slade et al. 2007), and thus nitrogen excreted in the soil. Once in the soil such nitrogen is volatilized to the air. Lichen communities were used as a proxy of the effects in the air compartment. They have a long history as ecological indicators of excessive nitrogen in the atmosphere (Pinho et al. 2009, 2011, 2012), taking into account the system capacity to handle the excessive nitrogen in the soil.
1.3.1. The use of epiphytic lichens biodiversity as ecological indicators
Epiphytic lichens are organisms that result from a symbiosis between a fungus and green algae and/or cyanobacteria, growing over a plant substrate. In this symbiosis, the fungus provides water and minerals, and serves as the main anchor and structure of the organism, while the green algae and/or cyanobacteria provide nutrients from photosynthesis (Conti & Cecchetii, 2001). Lichens absorb nutrients and water directly from the atmosphere. They balance their water and nutrient content with the surrounding environment, due to their inability to regulate its content. During dry periods, they become inactive, only re-activating when the surrounding environment gets more humid. These characteristics are what make them such excellent ecological indicators of environmental changes in the atmosphere. The use of lichens as ecological indicators of atmospheric changes is vast, and a lot is known about the evaluation of the effects of nitrogen pollution and climate and its effects on ecosystems worldwide (Frati et al. 2008; Hauck, 2010; Llop et al. 2012; Matos et al. 2015; Pinho et al. 2012) Some species of lichens may react even to small changes in the atmospheric concentration of pollutants, serving as an early warning system for this type of threats and as to monitor air quality.
Lichens have traits related to their growth form, main reproduction type, and tolerance to eutrophication, substrata pH, irradiation and aridity, and thus can be divided into functional groups. These traits are all thought to be important in mediating their response to the potential impacts that multiple farming activities might have in montado. Eutrophication tolerance is a useful trait for nitrogen pollution studies (Lopes, 2010; Pinho et al. 2011; VanHerk, 2001). Oligotrophic lichens only tolerate low levels of nutrients and, therefore, are very scarce close to pollution sources like barns, high-traffic roads or factories. Nitrophytic lichens can manage to thrive even in sites with high
- 8 -
nutrients concentration due to the fact that there are tolerant to even high levels of nutrients. Mesotrophics are in between the two described before. Air pollution from ammonia sources (VanHerk, 2001) and dust from arid areas help raise pH of epiphytic lichens substrate, like tree bark, making the pH trait useful to identify dusty areas (Frati et al. 2008; Giordani & Malaspina, 2016). Growth form (Figure 1.3.1.1) reflects the way lichens intercept particles and water in the atmosphere (Matos et al. 2015). Therefore, this trait is good to analyse eutrophication and aridity levels. Main reproduction trait translates lichens response to stress, due to the fact that they tend to reproduce sexually when in stressed environments, thus being good indicators of environmental stress (Martínez et al. 2012). Irradiation trait translates lichens tolerance to sites with more direct sunlight, being suitable traits for climate and vegetation structure differences (Munzi et al. 2014). Lastly, the aridity trait translates the climate conditions, making this trait useful in climate changes studies.
Figure 1.3.1.1: Examples of the three lichens growth forms. From left to right: foliose broad lobe (Xanthoria parietina),
foliose narrow lobed (Physcia adscendens); and fruticose (Usnea rubicunda). Photos by: P. Matos and P. Pinho
Though lichens have a long history as ecological indicators, only a few studies (Pinho et al. 2008; Pinho et al. 2012) used epiphytic lichens to evaluate the effect of multiple land uses in montado ecosystems.
1.3.2. The use of coprophagous beetle’s biodiversity as ecological indicators
Coprophagous or dung beetles (Coleoptera, Scarabaeoidea) have been roaming earth since the Mesozoic period. They feed on animal faeces, both during larval and adult phase (Bertone et al. 2006). The majority of the species of this group have higher activity during spring and summer seasons, due to warmer temperatures (Rainio & Niemela, 2003). The odour released by the faeces attracts these beetles that then travel to them either by moving on the soil surface or by flying, depending on whether they are winged or not. Fast traveling to where the faeces are located is very important because they feed preferentially on fresh ones (Holter, 2016). Other than feeding, they also use dung to lay their eggs and feed their larvae. These species are very important for the ecosystems, even more in grasslands with livestock, for a variety of reasons. One of them is due to their ability to remove the dung from the soil surface. Without beetles and other coprophagous species, those same dung can stand up to 4 years before completely disappearing (Whipple, 2011). This service is fundamental for livestock pastures because cattle don’t graze near their own dung. This way, beetles increase
- 9 -
decomposition rates of the dung, allowing livestock to graze freely in the entire pasture. Dung beetles also help spread out the dung along the soil surface and underground, increasing fertility. The activity of coprophagous beetles also helps aerate and increase infiltration of water in the soils, improving both physical and chemical characteristics of the soil (Abot et al. 2012; Bertone et al. 2006; Campos & Hernández, 2015; Correa et al, 2016; Howison et al. 2016; Nichols et al. 2008; Yamada et al. 2007). Removal of dung by coprophagous beetles also hinders livestock pests and flies to proliferate because they no longer have dung where they can lay their eggs and grow their larvae. Beetles also destroy their eggs by direct mechanical damage with their mouthpieces (Bertone et al. 2006; Campos & Hernández, 2015; Correa et al. 2016; Losey & Vaughan, 2006; Nichols et al. 2008; Whipple, 2011). Last but not least, they have also an important role on seed dispersal (Correa et al. 2016; Nichols et al. 2008; Whipple, 2011). For these reasons, coprophagous beetles have been the target of many ecological studies being a suitable indicator group when assessing the impact of grazing activities and land use changes (Braga et al. 2013; Lobo et al 2001).
Coprophagous beetles can be separated into three different functional groups (Figure 1.3.1.2), related to the method of dung manipulation trait (Milotić et al. 2017). Tunnelers (paracoprids) dig tunnels below the dung, grabbing small amounts of it and placing them along the tunnel walls. Dwellers (endocoprids) live inside or on top of the dung and rollers (telecoprids) build small balls of dung and then roll them to other places (Bertone et al. 2006; Campos & Hernández, 2015; Yamada et al. 2007). This trait can be very useful in studies of soil and vegetation characteristics because while rollers and tunnelers are highly dependent on the soil and vegetation structure, dwellers do not seem so dependent (Chandra & Gupta, 2012; Rainio & Niemela, 2003; Whipple, 2011). Presence or absence of wings can also be a useful trait to use in vegetation structure studies because beetles with wings have difficulties to fly in sites with closed vegetation. These constraints aren´t felted by the wingless beetles that move along the ground.
Figure 1.3.2.1: Coprophagous beetles’ functional groups, regarding the dung manipulation method trait. Source: K. D. Floate
- 10 -
Intensification of grazing also may affect them (Buse et al. 2015; Howison et al. 2016; Lobo et al. 2006), either positively by the production of more dung patches, that provide food and shelter, or negatively by trampling or mechanic abrasion from the grazing activity.
1.4. Objectives
Recognizing the importance of a sustainable use of the montado to maintain its biodiversity and ecosystem services, and taking into consideration the threats posed by land-use intensification, our general aim was to build a management tool to understand the impacts of multiple farming activities in High Nature Value montado areas. This was done considering the effects of grazing intensity and its exclusion within the woodlands, and simultaneously the effects of nearby intensive agriculture. The tool was based in the use of lichens and coprophagous beetles as indicators of these impacts, using different biodiversity metrics, in air and soil compartments, respectively.
We also aim at answering these questions:
1) Can we apply both ecological indicators in the context of the impacts of the multiple farming activities;
2) Which are the best metrics, in both indicators, to measure the impact of the multiple farming activities;
3) Which activities have the most impact;
- 11 -
2. Methodology 2.1. Study area
This study was conducted in the “Charneca” site of Companhia das Lezírias (CL) (Figure
2.1.1), a state-owned propriety where multiple agricultural activities co-exist within an 18000 ha area, forming a patch with multiple land-uses in a relatively small area. In the “Charneca” site the ecosystem is dominated by montado ecosystems, characterized by the presence of Quercus suber and small grasses and shrubs (ILTERN, 2017). The climate is Mediterranean with a strong seasonally, with dry hot summers and winters with mild temperatures and precipitation. Average annual temperature is 17.5 ºC and average annual precipitation is 600 mm (averages 1931–1960; Pinho et al. 2012).
- 12 -
Figure 2.1.1: Map of the main land-uses present in the “Charneca” site inside "Companhia das Lezírias". Map based on
information provided by (Direção-Geral do Território, 2016). (AFS stands for Agro-forestall systems)
Varied economical activities are developed inside CL property, like cork harvest (each 9 to 12 years), different crops, viniculture, beef cattle, hunting and others. Cattle grazing is done in a low-intensity, extensive regime, with rotation of the cattle by multiple pastures sites. Those sites are separated from each other by wood and barbed wire fences, preventing cattle to leave their designated site. Nearby, other land uses like irrigated and fertilized crop cultures, viniculture and nature tourism also take place. CL is also located very closely to the Tagus Estuary Nature Reserve and is included in the Natura 2000 network, being covered by a Special Protection Zone (ZPE) and Sites of Community Importance (SCI) (ICNF, 2017). CL is also included in the International Long Term Ecological Research Network (ILTER), a scientific research network, spread around the world and focused on the
- 13 -
gathering of data to improve the understanding of global ecosystems over the long term. This is important because there are several other studies previously conducted in the same (or similar) areas, making it easier to gather and share information with other researchers (ILTER, 2017).
2.2. Sampling design
For this study we focused on the plots occupied by montado. These plots are managed by the company and vary from long-term grazing exclusion (since the last 19 years) to grazing with multiple intensities. From the 42 plots, 17 were in a grazing exclusion regime, ranging from just 1 to 19 years of grazing exclusion. For the remaining, CL provided us the data on cattle heads (number of animals per year per hectare), and also about the normal use of fertilizers in nearby cultures (rice and corn fields with, respectively, 122 Kg(N)/ha/year and 275 Kg(N)/ha/year).
To select sampling sites from the total number of plots with montado (n=43), we performed a stratified sampling design. Stratification was done according to grazing intensity in each site, using the following formula:
Grazing Intensity = [1/9*07-08+1/8*08-09+1/7*09-10+1/6*10-11+1/5*11-12+1/5*12-13+1/4*13-14+1/3*14-15+1/2*15-16-(exclusion years)].
In this formula, 07-08; 08-09; 09-10; 10-11; 11-12; 12-13; 13-14; 14-15 and 15-16 refer to the annual grazing intensity levels for each of the plots. The increasing importance attributed to the recent year was chosen to give extra weight to recent years’ grazing intensity. The subtraction of the grazing years was chosen to differentiate between sites with grazing exclusion for many years. Overall, the values of the Grazing Intensity Index ranged from -19 to 390. The highest values correspond to the sites with higher presence of cattle in the recent years, the lowest values to sites excluded from grazing for the longest time. From there, we defined 9 classes of values, being the plots ordered according to their grazing intensity value. After ordering the plots, we selected 2 plots in each class, giving priority to plots already chosen in a previous work performed in the CL property (Listopad et al. 2018). The remaining plots were chosen randomly. The total number of plots selected was 18 (Figure 2.2.1).
- 14 -
Figure 2.2.1: All CL plots with montado, the 19 sampling sites (tringles) and the 42 plot divisions. Note that one additional
site was selected for lichen sampling only (due to time-constrains) due to the area within the plot having much more heavily grazing intensity levels than the centroid, and was added to the sampling.
Within each plot, the geometric centroids were selected for sampling, ensuring that it was located at more than 250 metres from another plot, at more than 50 metres from any road and that the selected sites had vegetation cover similar to the rest of the plot. Note that one additional site was selected for lichen sampling only. This resulted from field verification, that a specific area within the plot with the highest cattle density presented fixed cattle feeders. This area within the plot was much more heavily grazed by cattle than the centroid, and was added to the sampling. However, due to time-constrains, only lichens could be sampled in this area. In the selected sampling sites, sampling of lichens and beetles was carried out. These sites were further characterized regarding environmental factors like land surface temperature (LST), grazing exclusion years, distance to the nearest road, habitat suitability, Normalized difference moisture index (NDMI) and several soil characteristics (soil texture, soil thickness, soil actual permeability and soil potential permeability)
2.2.1. Epiphytic lichens sampling
In this study, we focused on the analysis of epiphytic macro lichens rather than on the conjugation of macro and micro lichens, in order to study the air compartment. This option was taken because, as previously stated by (Grogan & Barreto, 2005; Pinho et al. 2008), macro and micro lichens have a similar response to these impact sources and therefore the response of one of them is usually similar to the response of both of them together (Bergamini et al. 2005). More, sampling macro lichens is easier and faster, saving time, both in the field and in the laboratory. On top of that, macro lichens identification requires far less experience and knowledge than crustose lichens identification.
Sampling was conducted from 3 to 7 of April, 2017. The six Quercus suber closer to each centroid were selected, keeping in mind that they had to: 1) have a perimeter equal or superior to 50 cm but inferior to 250 cm; 2) have a trunk as vertical as possible; 3) with undamaged bark or any
- 15 -
visible signs of disease (Asta et al. 2002; Pinho et al. 2015). The amount of sampled Quercus individuals was lower than recommended, due to time constrains although other studies also used a lower number of sampling individuals without compromising their work (Pinho et al. 2009, 2011; Ruisi et al. 2005).
The sampling procedure was conducted by vertically placing a 50 cm by 10 cm grid, divided in 5 equal squares of 10 cm per 10 cm (Figure 2.2.1.1). The grid was placed in unharvested Quercus
suber bark, at a minimum height of 100 cm and fixed by pins.
Figure 2.2.1.1: Sampling grid for lichen sampling composed of 5 contiguous quadrats. The grid is placed in four different
positions accordingly to the four cardinal points (north, south, east, and west). Source: Asta et al. (2002)
We then proceed to the identification of all epiphytic macro lichens in each square of the grid, either by naked eye or with a magnifying lens. This process was repeated 4 times in each tree moving the grid to match each cardinal point (North, South, East and West). Individuals that couldn´t be identified in the field, were collected and taken to the laboratory for posterior identification. Identification was done using Smith et al. (2009) and Martellos (2010) identification keys. Tree perimeter at breast height was also recorded. In total, 113 trees were sampled, out of 114 possible. This was due to the fact that, in one of the plots, there weren’t enough trees suitable to be sampled. Species frequency in each site is the average number of quadrats each species occurs in a tree (minimum of zero and maximum of 20). Lichens diversity value (LDV), an abundance measurement, was calculated for each sampling site (by adding the species mean frequency in each site) and species richness were also calculated and used as metrics.
The community weighted mean (CWM) single-trait metric was computed afterwards (Matos et al. 2015) for each functional group and was used in statistical analysis. Lichens traits and respective functional groups (Table 2.2.1.1) were chosen based on several other studies using the same and other traits (Matos et al. 2015; Martínez et al. 2012; Pinho et al. 2011; Llop et al. 2012; Herk, 2001); Pinho, 2010; Frati et al. 2008; Munzi et al. 2014) that they are appropriate indicators of the potential impacts of the multiple farming activities that occur in our studied area. Information regarding functional traits was collected from Nimis (2016). Each lichen species is classified (from 1 to 5) based on his preferences to eutrophication, aridity, solar irradiation, pH and also reproduction and growth form type. We selected the highest classification to provide the information of that species tolerance to each factor.
- 16 -
Table 2.2.1.1: Traits and related functional groups following (Nimis, 2016; Smith et al. 2009). *When species were
classified within two or more classes, we chose the highest class to translate the species tolerance.
Trait Functional
Group
Description Symbol
Growth form Foliose broad lobes Partly attached to the substrate with a leaf-like form and
broad lobes Fob
Foliose narrow lobes Partly attached to the substrate with a leaf-like form and
narrow lobes Fon
Fruticose
3D-like structure, attached by one point to the substrate with the rest of the thallus standing out from the surface of the substrate
Fr
Reproduction
type Asexual Mainly asexual reproduction with soredia or isidia like structures Asx Sexual Mainly sexual reproduction by spores Sex
Eutrophication
tolerance* Oligotrophic Tolerance to very weak eutrophication levels Oligo
Mesotrophic Tolerance to weak eutrophication levels Meso Nitrophytic Tolerance to very high eutrophication levels Nitro
pH substrate
tolerance* Sub-neutral Tolerance from sub-acid to sub-neutral pH S-Neu
Basic Tolerance from slightly basic to basic pH Bas
Irradiation
tolerance Sun-exposed Tolerance to sun-exposed sites Expo
Very high direct solar
irradiation Tolerance to sites with very high direct solar irradiation Direct
Aridity
tolerance* Mesophytic Tolerance to mesophytic conditions Mesop
Xerophytic Tolerance to xerophytic conditions Xerop
2.2.2. Coprophagous beetles sampling
We also focused on the analysis of coprophagous beetles in order to study the soil compartment. Sampling was conducted during the first two weeks of March. Days 1, 2 and 3 were destined to the placement of 5 dung baited pitfalls closed to each centroid, in a total of 90 pitfalls. Each pitfall was placed 10 m away from the others, in a 40 m straight line. Pitfalls consisted of 12 cm diameter plastic cups with 13.5 cm height. They were buried until the top of the cup matched the soil surface. The dung bait was positioned over the plastic cup, involved in a thin fabric and fixed by a stick. The pitfall structure was completed with a small plastic plate placed 5 cm over the top of the buried pitfall to prevent rain or detritus from falling inside it (Hortal & Lobo, 2005) (Figure 2.2.2.1). Ethylene glycol and dish washer detergent solution were placed inside each pitfall to capture and preserve the beetles that were trapped inside. Pitfalls were collected on 6, 7 and 8 of March so each trap would stay in the field for 120 hours.
- 17 -
Figure 2.2.2.1: Dung baited pitfall trap. Cup is filled with a solution and buried in the soil (top of the cup matching soil
surface). Dung bait is placed in the middle of the cup and a plate is placed on top of it. Source: Kotze et al. (2011) (modified) After collecting the traps, they were brought to the laboratory and their content was individually placed inside trays. The content was examined, and beetles were separated from bi-catches and picked for further identification with the help of a stereoscope microscope. Identification of each individual was done with the help from Baraud (1992), E. B. Britton (2012), Fauna Europaea (2017), Jessop (1986) and Naturdata (2017) and also using the entomological collection of the Animal Biology Department – Faculty of Sciences, University of Lisbon. Data related to species richness and abundance of each species, inside each pitfall, was collected and used for further data analysis. The community weighted mean (CWM) single-trait metric was computed afterwards for each functional group and was used in statistical analysis. Beetles traits and respective functional groups (Table
2.2.2.1) were collected either by direct observation of the captured individuals (as wings presence or
absence and mean species body size) or by information collected from (Baraud, 1992; Britton, 2012; Jessop, 1986) regarding the method of dung manipulation. Mean species body size was categorized in five ordinal classes (Appendix 1). Traits were chosen because they are known to reflect somehow the impacts of grazing activity and vegetation structure.