J. Silvestre, T. Araújo and M. St. Aubyn
Economic growth and individual
satisfaction in an agent-based economy
WP19/2016/DE
_________________________________________________________
De pa rtme nt o f Ec o no mic s
W
ORKINGP
APERSEconomic growth and individual satisfaction
in an agent-based economy
J. Silvestre, T. Ara´
ujo
∗and M. St. Aubyn
April 18, 2016
ISEG and UECE, Instituto Superior de Economia e Gest˜ao, University of Lisbon
Abstract: Macro and micro-economic perspectives are combined in an eco-nomic growth model. An agent-based modeling approach is used to develop an overlapping generation framework where endogenous growth is supported by work-ers that decide to study depending on their relative (skilled and unskilled) indi-vidual satisfaction. The micro perspective is based on indiindi-vidual satisfaction: an utility function computed from the variation of the relative income in both space and time. The macro perspective emerges from micro decisions, and, as in other growth models of this type, concerns an important allocative social decision the share of the working population that is engaged in producing ideas (skilled work-ers). Simulations show that production and satisfaction levels are higher when the evolution of income measured in both space and time are equally weighted.
Keywords: agent modeling, education, heterogeneous human capital, economic growth, individual
sat-isfaction.
1
Introduction
Agent-based modeling is a growing research area in Economics (Kirman 2004; Tesfatsion 2006; Farmer & Foley 2009). Applications in Macroeconomics, albeit increasing, are still relatively rare compared to Microeconomics. There are some
examples, even hybrid approaches mixing traditional DGSE models with other non-standard characteristics (Lebaron & Tesfatsion 2008; De Grauwe 2010; Gati et al 2011).
Financial crisis highlighted flaws in many models used in economic policy de-sign, namely DGSE models. Homogeneity (representative agents) and rational expectations hypothesis are the two most criticized features. Agents are not, of course, homogeneous and economic reality is far more complex than this over simplistic assumption states. Rationality is also disputed by several neurological and psychological experiments (Kahneman 2003; Camerer, Loewenstein & Rabin 2011; Fehr & Rangel 2011). Most of the times, these two hypotheses are assumed to achieve mathematical optimization of the models.
In this paper we extend and modify the Ara´ujo & St. Aubyn (2008) and the Martins, Ara´ujo, Santos & St. Aubyn (2009) approaches, where an endogenous growth model based on Jones (2005) of an economy with skilled and unskilled workers in an overlapping generation environment was used to study economic growth. There, agents decide to study based on their neighbors behavior and on the relative income of skilled and unskilled workers.
In our overlapping generations framework, skilled workers - the agents that have studied in a previous period - produce ideas. There, an agent decision to study, or else to stay unskilled, is taken following a socially conditioned economic reasoning. This decision is twofold: on one hand, each agent is concerned with his or her lifelong income, so that it may be worthwhile to give up some present income in order to become part of an education elite that is usually better paid. On the other hand, the so-called neighborhood effects may have a preponderant role in the agent decision towards education.
observed in the space of agents.
In the present paper, the neighborhood effects are constrained by the amounts of satisfaction that characterize skilled and unskilled agents. We are now focusing in the study of economic growth from a multi-level perspective, where the (micro level) individual satisfaction plays a decisive role. In so doing, individual satisfac-tion is accounted for by combining individual income (in relative terms, in both space and time) with the neighborhood effects to the agent choice with respect to education.
Satisfaction is a measure of individual well-being used to assess each agent evaluation of a process that encompasses two features that may evolve in different ways. The first one concerns the relative position of his income by comparison with the income of the other agents (comparison in space). The second one con-cerns the evolution of his own income (in time). Although these two features are independent, their joined influence to the determination of the agent satisfaction is characterized by a mechanism of convex coupling.
Due to convex coupling, there is a limitation on the range of options and influences that determine the satisfaction of each agent. Then, if the influence that the agent receives from the evolution of the income of the other agents increases, there will be a correspondent decrease of the influence of his own income evolution in the determination of his satisfaction.
This satisfaction-based education decision is evaluated in different scenarios, where the key parameter is the weight given to the evolutions of the individual relative income in both space and time. The scenarios are also tested against each other in terms of long term growth and its impact on satisfaction. Our results indicate that when personal wellbeing depends exclusively on the influence of interpersonal comparisons - satisfaction becoming a kind of rival good - the economy grows less and, at the local level, there is almost no clustering.
This model is a first step in the development of a wider multilevel model where monetary policy options and labor mobility between countries - emigration - are intended to be included, also based in this individual satisfaction framework.
in this society regarding the income division between skilled and unskilled work-ers. Individual satisfaction functions for educated and non-educated agents are presented in Section 3. Simulations scenarios are depicted in Section 4. Section 5 concludes.
2
The model
There are N agents in our economy. Each agent lives for two periods. Pop-ulation size does not change and generations overlap. Consequently, there are at each point in time N2 young agents and N2 senior ones. A young agent is either a student or a young worker. In the latter case, it becomes immediately part of the unskilled labor force. Otherwise, a young person that spends the time studying becomes a skilled worker when older. Consequently, at each point in time the population is comprised of four groups: the young students; the young, or junior, unskilled workers; the senior unskilled workers, i.e., those that did not study in the previous period; and, finally, the skilled workers. The decision on becoming an educated agent is based on the satisfaction of the nearest neighbors. Neighbor-hood is defined on a ring and the neighborNeighbor-hood size (2g) defines the range of the influence that each agent receives from his nearest neighbors.
The agents decide to study based on the number of satisfied skilled workers and satisfied unskilled workers in their neighborhood. In formal terms, agents decide to study if:
nSts > nStu (1)
where nSts and nStu are respectively, the number of satisfied skilled workers and satisfied unskilled workers in the neighborhood.
Production is computed from the stock of ideas and from the unskilled labor supply. Unskilled workers produce regular work while skilled workers produce ideas. Production is defined as:
Yt=AtUt+εt (2)
number of unskilled workers in period tand εta productivity shock (with uniform
distribution between -0.5 and 0.5) in periodt. The evolution of the stock of ideas is given by:
∆At=At−1δSt+γDt (3)
whereSt represents skilled labor, δ is a parameter related with marginal
pro-ductivity of skilled labor, Dt is a measure of distance between skilled workers and
γ a parameter of the strength of the team effect. This means that production of ideas is higher when skilled workers are closer to each other and in the presence of a higher team effect. Dtis defined as:
Dt=
1 St
S X
i,j=1 1
|i−j| (4)
Production in each period is divided between skilled and unskilled workers. Skilled workers receive the income resulting from increases in the stock of ideas and unskilled workers receive the production without these gains. In mathematical terms:
Yt=YtU+YtS (5)
where YtU denotes the total income of unskilled workers and YtS the total income of skilled workers.
The income distribution – the social contract in this society – specifies that skilled workers receive the share related to the production of ideas and unskilled workers receive what would have been produced if ideas remained constant. Thus, the unskilled workers income is computed considering the previous period stock of ideas and all the additional income due to new ideas pertains to skilled workers. Productivity shocks are shared, in equal parts, by skilled and unskilled workers. The total income for unskilled (YtU) and skilled workers (YtS) is given by:
YtU =At−1Ut+ εt
YtS = (At−At−1)Ut+ εt
2 (7)
Wages per worker are determined dividing the total income by the total number of skilled (Lt) and unskilled workers (Ut):
wtU = AtUt Ut
+ εt 2Ut
=At+
εt
2Ut
(8)
wtS = Y
t S
Lt
+ εt 2Lt
= (At−At−1) Ut
Lt
+ εt 2Lt
(9)
3
Individual satisfaction
Accounting for individual satisfaction plays a key role in this work. The way individual satisfaction is accounted for in our model allows for considering two main and sometimes opposing views on the relationship between income and hap-piness. According to the so called Easterlin hypothesis (1995) individuals care much more about their income relative to others (relative in space) than about increases in income that go along with a general upward trend (relative in time). An individual would then be happier if he founds himself better off as compared to others, and not so much in absolute terms only. This perspective, to which Layard, Mayraz and Nickell (2010) find some empirical supporting evidence for the United States, Western Germany and other developed countries. Some other researchers, however, do not share this extreme view, and the relative importance of absolute income for happiness is not at all settled in the literature (see Deaton (2008) for a discussion of the positive relationship between life satisfaction and national income).
Satisfaction also takes into account the initial expectations of the agents when they decide for education. The values of initial (and individual) expectations are randomly generated and work like a fixed cost payed by every agent at each time step. The higher the expectation of an agent is, the harder the possibility of becoming satisfied with the options he made when choosing a job will be. Educated workers are provided with some amount of satisfaction (α) for the simple fact of being educated. Therefore, and respectively for skilled and unskilled workers, individual satisfaction is computed as:
Fi,ts =α−ci+ (1−ω)(wst−
wut
β(ρ)) +ω(w
s
t −wst−1) (10)
Fi,tu =−ci+−(1−ω)(wts−
wu t
β(ρ)) +ω(w
u
t −wut−1) (11)
where ci is the initial expectation of agent i , taking values in the interval
[−0.5,0.5]1. ws and wu represents, respectively, skilled and unskilled wages. α is an exogenous parameter, ρ is a discount rate and β(ρ) a monotonous function with δβδρ > 0. ω is a parameter taking values between 0 and 1 that represents the weighted relative income (in space) and income growth (in time). When ω= 0.5, both relative incomes have equal weight. By setting ω with different values allows for balancing the range of influences that determines individual satisfaction. This parameter is used to configure the three scenarios presented in the following section.
4
Results and conclusions
Simulations were performed for three scenarios in each of which the key role is played by the parameter ω. This parameter value specifies - in the computation of the satisfaction of each worker - the weight given to the relative income (in space) and to the income evolution (in time), with convex coupling. Our goal is to evaluate, precisely, the impact in satisfaction, the long run growth and the number
1
of partitions in this society when different weights are given to the satisfaction components. All the scenarios comprise 100 agents, 50 skilled and 50 non-skilled workers in the first period. Each simulation comprises nine generations (R = 9), there is no team effects (γ = 0), junior and senior agents equal 50, the discount rate is 5% (ρ= 0,05) and the neighborhood size is set to three (g= 3). As already mentioned,ω takes values in the set{0,0.5,1}.
In any scenario, satisfaction in the first period (t= 1) is randomly set for all agents with values between −0.5 and 0.5. Junior students satisfaction is derived from senior workers satisfaction in that period because they did not have wages in the previous period. Their satisfaction is randomly generated with values ranging between the maximum and the minimum values of senior workers satisfaction in that period. The ideia underlying this assumption is that a student can not be more satisfied than the most satisfied person in this society and can neither be less satisfied than the least satisfied worker.
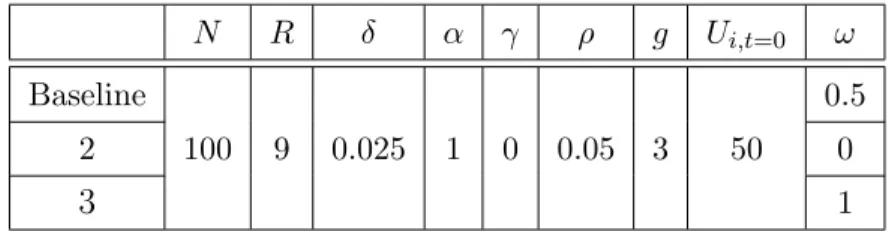
Table 1 shows the values that characterize the model parameters in each sce-nario.
N R δ α γ ρ g Ui,t=0 ω
Baseline
100 9 0.025 1 0 0.05 3 50
0.5
2 0
3 1
Table 1: The characteristics of the simulation scenarios
4.1
Simulation results
the scenario where only relative income (in space) matters. This is also the least clustered society, ending up with (on average) 33 partitions.
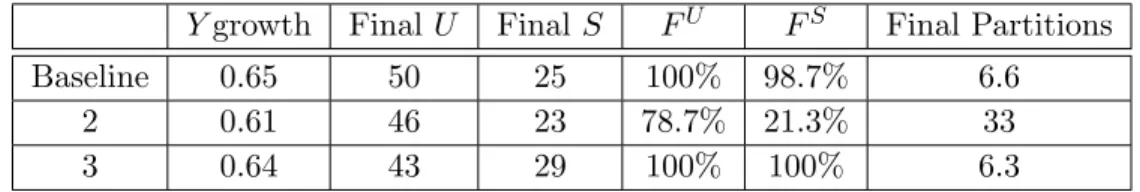
It is possible to evaluate the degree of clustering in this economy by counting the number of observed partitions. A small number of partitions corresponds to high local clustering. The final number of partitions for each scenario are presented in Table 2. The initial average number of partitions is 50. Final U and FinalS indicate the final number of unskilled and skilled workers. FUandFS
represent, respectively, the percentage of satisfied non-educated and the percentage of satisfied educated agents.
Ygrowth Final U Final S FU FS Final Partitions
Baseline 0.65 50 25 100% 98.7% 6.6
2 0.61 46 23 78.7% 21.3% 33
3 0.64 43 29 100% 100% 6.3
Table 2: The outcomes of the three scenarios after 1000 simulations
We also tested two further scenarios, not reported in this table, whereω was set to 0.25 and 0.75. The results were roughly the same obtained with the baseline forω = 0.75, for satisfaction and economic growth, and are slightly lower in both variables when ω = 0.25. These two additional scenarios confirm the general outcome of the model in the baseline.
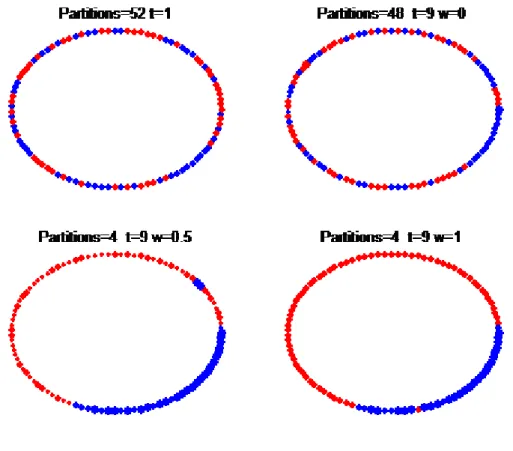
Figure 1: The first plot shows the initial distribution of skilled and unskilled agents on a ring and the corresponding number of partitions of a typical run in any of the three scenarios. The second, third and fourth plots show the final distributions and the number of partitions in each different scenario. The size of the nodes is proportional to its satisfaction and the color identifies skilled (blue) and unskilled workers (red).
It shall be noticed, that in any of the three scenarios and at each time step (each generation), there is no direct interaction between the agents which, instead, react to collective variables (local and global), that they themselves create.
•A local mechanism – that operates when the agents decide about education - where the collective variables are the number of skilled and satisfied-unskilled workers in the neighborhood.
•A global mechanism – operating when accounting for individual satisfaction - where the collective variables are the wages of skilled and unskilled workers.
In this context, the interaction through the global variables (wages) oper-ates faster in the overall dynamics of the model. Simultaneously, the interaction through the local variables (individual satisfaction) gives rise to a slower contri-bution, i.e., a contribution whose consequences are not immediately incorporated, since the modifications in individual satisfaction will affect the decisions of the next generation.
The field of dynamical systems or more precisely, its contributions to the un-derstanding of the interplay of local and global variables (see for, instance, Vilela Mendes (2001)) informs that in some systems, the essential mechanism driving the overall dynamics of the system is the slow dynamics, whereas the fast dynamics operates only as a background which is selected by the slow evolution.
Our results are in line with the consequences of the above described interplay between local and global interactions. When personal wellbeing depends exclu-sively on the influence of interpersonal comparisons, there is almost no clustering as the way the agents organize themselves in space (number of partitions) ap-proaches the random (initial) situation. This is due to the fact that when the influence of interpersonal comparisons dominates, the slow dynamics depending on a rival good drives the set of agents to an unstable situation in what concerns their satisfaction-based education decision. In this setting, neither local clustering nor any structural organization happens to take place.
4.2
Baseline scenario
of partitions, a similar outcome to those presented in the wage-based decision model (Ara´ujo and St. Aubyn, 2008).
Both skilled and unskilled workers have positive satisfaction, despite the fact that non-educated workers are, on average, more satisfied than educated workers. The baseline scenario, where the evolutions of both relative income and own income have equal weights, displays the best performance in long run growth. Moreover, this scenario is characterized by a high level of local clustering.
4.3
Scenario 2:
ω
= 0
(only relative income matters)
Turning now to the Scenario 2, whereωis set to zero, meaning that only relative income matters, we see some changes in the long term growth by comparison with the baseline scenario. Long term production is lower with a lower pattern of growth during transition path. This, of course, has obvious consequences to wage levels that are a direct result of production. Average Y growth is sligthtly lower than in the baseline - 0.61 against 0.65 - and satisfaction levels are considerably lower, mainly among unskilled workers where only 21.3% have positive satisfaction levels, the worst performance of this variable in the three scenarios.
In this scenario, satisfaction is a kind of rival good where skilled satisfaction is obtained from unskilled insatisfaction and vice-versa. Clustering is high, being the number of partitions much higher than in the baseline scenario.
4.4
Scenario 3:
ω = 1(only income variation matters)
In the third scenario, only income variation matters, meaning that whenωis set to one, the relative income (in space) plays no role in individual satisfaction. Here, production and satisfaction are similar to those found in the baseline scenario, in spite of having lower levels of production as in Scenario 2, and satisfaction levels are being equally shared by skilled and unskilled workers.
5
Concluding remarks
ABM modeling and endogenous growth are combined in a model that uses individual satisfaction as a driver of human capital accumulation. In a macro model with micro foundations and an overlapping generation environment, each agent decides to study based on individual satisfaction. This kind of a utility function has two main pillars - relative income (skilled versus unskilled workers) and the evolution of income in time - and also the initial expectations of agents when they decide for education. We simulate three different scenarios weighting differently the two main pillars of individual satisfaction. The baseline scenario, where the evolutions of both the relative income and the own income have equal weights, displays the best performance in the long run growth. Moreover, this scenario is characterized by a high level of local clustering.
When only relative income matters for satisfaction, local clustering is much lower as the number of partitions increases. The number of skilled workers is smaller, and this makes income growth to slow down, as less ideas are produced. In the other extreme scenario, when only income growth matters, local clustering and growth are similar to the outcomes of the baseline. Our artificial economy favors the interpretation that when the influence of interpersonal comparisons dominates, the slow dynamics depending on a rival good drives the set of agents to an unstable situation in what concerns their satisfaction-based education decision. In this setting, neither local clustering nor any structural organization happens to take place.
This work is a first step towards the study of convergence in the long run growth and economic policy in a world with labor mobility. Future work is planned to use this measure of individual satisfaction to evaluate the individual propensity to emigrate or take other kind of micro decisions as a consequence of (in) satisfaction levels.
6
References
Sys-tems 11.01 2008: 99-117
2. BIONDO, A., Pluchino, A., Rapisarda, A. (2012), “Return migration after brain drain: a simulation approach” arXiv preprint arXiv:1206.4280
3. CAMERER, C. F., Loewenstein, G., & Rabin, M. (EDS.) (2011). Advances in behavioral economics. Princeton University Press
4. DEATON, A. (2008), Income, Health, and Well-Being around the World: Evidence from the Gallup World Poll, Journal of Economic Perspectives, 22(2):53–72
5. DE GRAUWE, P. (2010) Top-down versus bottom-up macroeconomics. CE-Sifo Economic Studies, 56(4), 465-497
6. EASTERLIN, R. (1995), Will Raising the Incomes of All Increase the Hap-piness of All?,Journal of Economic Behavior and Organization, 27(1): 35–4
7. FARMER, J. D., & Foley, D. (2009), The economy needs agent-based mod-elling.Nature, 460(7256), 685-686.
8. FEHR, E., & Rangel, A. (2011), Neuroeconomic foundations of economic choice—recent advances. The Journal of Economic Perspectives, 3-30
9. GATTI, D. D., Desiderio, S., Gaffeo, E., Cirillo, P., & Gallegati, M. (2011), Macroeconomics from the Bottom-up (Vol. 1). Springer
10. JONES, C. (2005), Growth and Ideas, in Handbook of Economic Growth, vol. 1B, eds. P. Aghion and S. Durlauf, Elsevier Science, Amsterdam
11. KAHNEMAN, D. (2003), Maps of bounded rationality: Psychology for be-havioral economics. The American Economic Review, 93(5), 1449-1475
12. KIRMAN, A. (2004) , Economics and Complexity, Advances in Complex Systems 7(2), 139- 155
13. LAYARD, R. , G. Mayraz & Nickell S. (2010), Does Relative Income Mat-ter?, in International Differences in Well-Being, edited by Ed Diener, John Helliwell and Daniel Kahneman, Oxford University Press
15. MARTINS, T.V., Ara´ujo, T., Santos, M.A. & St. Aubyn, M. (2009), Net-work effects in a human capital based economic growth model. Physica A: Statistical Mechanics and its Applications, 388(11), 2207-2214
16. TESFATSION, L., & Judd, K. L. (EDS.) (2006).,Handbook of computational economics: agent-based computational economics (Vol. 2). Elsevier