“
NOTICE:
this is the author’s version of a work that was accepted for publication in the eBook
Single and two-Phase Flows on Chemical and Biomedical Engineering
. Changes resulting from
the publishing process, such as peer review, editing, corrections, structural formatting, and other
quality control mechanisms may not be reflected in this document. A definitive version will be
subsequently published in the eBook
Single and two-Phase Flows on Chemical and Biomedical
Engineering, Ricardo Dias, Antonio A. Martins, Rui Lima and Teresa M. Mata (Eds), Bentham
Science, 513-547, 2012
”
CHAPTER 20
*Correspondence Author: Rui Lima, DTM/ESTiG, Braganca Polytechnic, C. Sta. Apolonia, 5301-857 Bragança, Portugal. , †E-mail: [email protected]
Ricardo Dias, et al. (Ed.)
BLOOD FLOW BEHAVIOR IN MICROCHANNELS:
PAST, CURRENT AND FUTURE TRENDS
R. Lima
1,2, *, T. Ishikawa
3, Y. Imai
3and T. Yamaguchi
41. DTM/ESTiG, Braganca Polytechnic, C. Sta. Apolonia, 5301-857 Bragança, Portugal
2. CEFT, Engineering Faculty, Porto University, Rua Dr. Roberto Frias, 4200-465 Porto, Portugal
3. Department of Bioengineering & Robotics, Graduate. School of Engineering, Tohoku University, 6-6-01 Aoba, 980-8579 Sendai, Japan
4. Department of Biomedical Engineering, Graduate School of Biomedical Engineering, Tohoku University, 6-6-01 Aoba, 980-8579 Sendai, Japan
Abstract: Over the years, various experimental methods have been applied in an effort to understand the blood flow behavior in microcirculation. Most of our current knowledge in microcirculation is based on macroscopic flow phenomena such as Fahraeus effect and Fahraeus-Linqvist effect. The development of optical experimental techniques has contributed to obtain possible explanations on the way the blood flows through microvessels. Although the past results have been encouraging, detailed studies on blood flow behavior at a microscopic level have been limited by several factors such as poor spatial resolution, difficulty to obtain accurate measurements at such small scales, optical errors arisen from walls of the microvessels, high concentration of blood cells, and difficulty in visualization of results due to insufficient computing power and absence of reliable image analysis techniques. However, in recent years, due to advances in computers, optics, and digital image processing techniques, it has become possible to combine a conventional particle image velocimetry (PIV) system with an inverted microscope and consequently improve both spatial and temporal resolution. The present review outlines the most relevant studies on the flow properties of blood at a microscale level by using past video-based methods and current micro-PIV and confocal micro-PIV techniques. Additionally the most recent computational fluid dynamics studies on microscale hemodynamics are also reviewed.
Keywords: In vitro blood, microcirculation, blood flow, red blood cells, microchannel, confocal micro-PIV/PTV, blood rheology, cell-free layer.
BLOOD FLOW BEHAVIOR IN MICROCHANNELS
Haemodynamics of the circulatory system
The primary function of the circulating blood is to transport oxygen, nutrients, waste products and heat throughout the body. The oxygenated blood leaves the heart, with high pressure and velocity (Reynolds number (Re) > 2000), through the aorta and moves into other large arteries, then into arterioles and, finally, into the capillaries. On its way back from the capillaries the blood moves into venules and then into veins in order to return to the heart and to begin the same journey all over again (see Fig. 1a).
Figure 1: a) Schematic diagram of the circulatory system. b) Schematic diagram showing the changes in blood pressure and Re on the large arteries, capillaries and veins [1, 4, 15].
In large arteries, where the diameter of the blood vessels is large enough compared to individual cells, it has been proved adequate to consider blood as a single-phase fluid [1-3]. Accordingly, blood in large arteries may be treated as a homogeneous fluid (continuous viscous fluid) where its particulate nature is ignored. Moreover, due to the large Reynolds number (Re) in arteries, blood flow is governed by inertial forces. However, arteries divide into successive smaller arteries and consequently the cross-sectional area of the vascular bed increases. As a result both pressure and velocity decrease as the blood flows into the smaller vessels. When the blood reaches the arterioles and capillaries the Re became less than 1, where viscous force dominates over inertial forces (see diagram in Fig. 1b). At this microscale it is fundamental to take into account the effects of the multiphase properties of the blood on its flow behavior [1, 2, 4]. A clear example of the multiphase nature of the blood, illustrated in Fig. 1a, is the formation of a plasma layer at microvessels less than 300 m, known as Fahraeus-Lindqvist effect [5]. It is based on the Fahraeus-Lindqvist effect we define microcirculation as the one including all microvessels or microchannels with a diameter smaller than 300 m.
Blood composition
Figure 2: Scanning electron microscope image of human blood cells (adapted from [6] ).
Table 1: Blood cells composition [1]
Cell Unstressed shape and dimensions ( m) Volume concentration (%) in blood
Red blood cell (RBC) Biconcave shape (8) 45 White blood cell (WBC) Roughly spherical (7-22)
1 Platelets Round or oval (1-4)
Red blood cells (RBCs)
Blood flow behavior in microcirculation is strongly influenced by the red blood cells (RBCs), since they occupy almost half of whole blood volume. RBCs are formed in the bone marrow and during maturation they lose their nuclei before entering the circulatory system. When suspended in an isotonic medium (such as plasma or physiological saline) RBCs has a biconcave discoid shape, with a major diameter of about 8 m. The dimensions and shape of a typical human RBC is shown in Fig. 3.
Figure 3: Dimensions and shape of an unstressed human RBC (adapted from [1] ).
stresses acting on them. Fig. 4 shows several examples of RBCs deformation in capillaries and in extremely narrow microchannels [1-3].
Figure 4: RBCs deformation a) in vivo capillaries [10], b) by computational simulation [11], c) through narrow microchannels.
White blood cells (WBCs)
White blood cells (WBCs) are nucleated cells that represent the major defence mechanism against infections. Their shape is, in general, roughly spherical but their surface is not normally smooth (see Fig. 2). The diameter of WBCs ranges from about 7 up to 22 m, depending on its type. Healthy blood contains normally less than 1% of WBCs of the total volume of blood cells. [1, 7]. It has been argued that WBCs are less deformable than RBCs however WBCs can pass through the capillaries vessels walls. Thus the mechanical properties of WBCs are not clearly understood and need further research. Little is also known about the effect of the WBCs on the blood flow behavior in microcirculation. The blood flow under pathological conditions may promote the amount of WBCs within the flow and consequently they may disturb the blood flow behavior in microvessels.
Platelets
Platelets are cells with no nuclei, round or oval discoid shape, in general, and with diameters from about 1 to 2 m. The number of platelets is usually less than the WBCs and they may have little effect on the blood flow behavior. Although platelets play an important role in blood coagulation and thrombus formation, this topic is beyond the scope of the present work [1, 7].
Plasma
Plasma is a yellowish fluid which contains 90% of water by volume and 10% of proteins (such as albumin and fibrinogen), inorganic substances (such as sodium ions and chloride ions), vitamins, dissolved gases, etc. The proteins within the plasma flow, due to their large molecular size, usually do not pass through the capillary wall, thus generating an osmotic pressure. In in vitro experiments the osmotic pressure is an important parameter that needs special attention. For example, when RBCs are suspended in an isotonic solution, like physiological saline, their shape does not change. However, if the RBCs are suspended in a hypotonic solution (NaCl less than 0.9%) the water diffuses into the cells interior and as a result they swell and may undergo hemolysis [4, 12].
Blood rheology
Rheological properties from rotational viscometers
Hcts behaves as non-Newtonian fluid (see Fig. 5). Moreover, it was also shown that blood viscosity also varies with the temperature and disease state [7, 9].
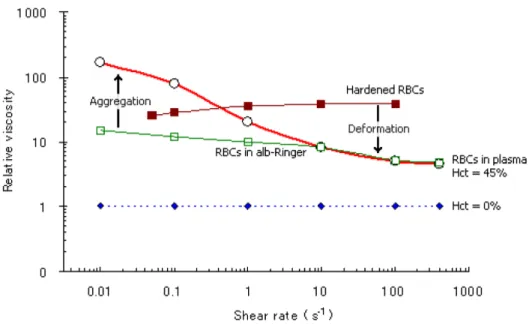
Figure 5: Relation between viscosity and shear rate (
γ
) of normal blood (45% Hct) and plasma (0% Hct) (adapted from [9]).Several experiments have examined the variation of viscosity with shear rate by using different kinds of fluids such as water, normal RBCs (45% Hct) suspended in plasma, washed RBCs (45% Hct) suspended in albumin-ringer solution and glutaraldehyde-hardened RBCs (45% Hct) in albumin-albumin-ringer solution. From Fig. 6, it is very clear that the normal blood has a rheological behavior significantly different from water. In fact, for the case of normal RBCs suspended in plasma, at low shear rates (
γ
<1s-1) the cells tend to aggregate to form rouleaux, where the presence of proteins (fibrinogen and globulin) in the plasma are believed to contribute to the RBCs aggregation. When the shear rate increases the rouleaux tend to break-up and the viscosity to decrease due to the deformation of the RBCs and the alignment with the flow. In the case of RBCs suspended in albumin-ringer solution, without fibrinogen and globulin, the results have shown that the RBCs do not have tendency to form rouleaux, a fact that reflects the lower viscosity at lowγ
. These RBCs at high shear rate also deform and align with the flow. In contrast, hardened RBCs by losing their ability to deform they tend to increase the viscosity, especially atγ
> 1 s-1 [9, 13, 14].Another interesting experiment, revealing the remarkable fluidity of normal blood, was performed by Goldsmith and Mason. Fig. 7 shows that in the suspension of rigid spheres, at 50% concentration, the viscosity increases exponentially making them difficult to flow. However, in the case of normal blood, even at 80% Hct, it has the ability to behave as a fluid [9, 14]. Although rotational viscometers have provided important findings on the blood rheological behavior, it should be emphasized that the actual rheological behavior of blood through microchannels may be different from some of the results above.
Figure 7: Relative viscosity of blood at 25°C as a function of Hct compared to that of suspensions of rigid spheres (adapted from [14]).
Rheological behavior in microchannels
The most astonishing flow characteristics of blood are known as Faharaeus effect and Faharaeus-Lindqvist effect. These two effects are strongly related to the microtube diameter and they were also observed in vivo experiments. Obviously in rotational viscometers these effects were never observed.
a) b)
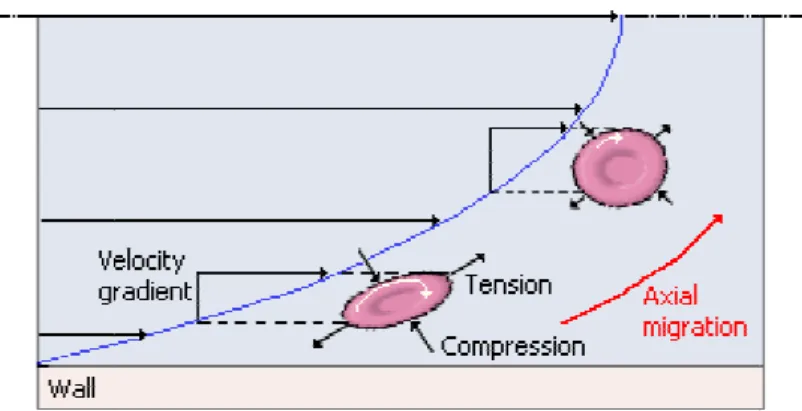
In the classical work of Robin Faharaeus, he observed that blood flow behavior and its heamatocrit are strongly affected by microtubes diameters less than 300 µm. The Fahareus effect indicates that the Hct in the glass capillaries (< 300 µm) is lower than the feed Hct, which suggests that the Hct decreases as the blood proceeds through narrower microvessels (see Fig. 8). This phenomenon results from the axial migration of the RBCs to the centre of the microtube and consequent faster motion of the cells when compared with the suspending medium, such as plasma or dextran [5, 7, 9, 16].
The Faharaeus-Lindqvist effect is somehow related to the above phenomenon. Again for microtubes diameters less than 300 µm, Faharaeus and Lindqvist observed that the apparent blood viscosity decreases as the microtube diameter became smaller [5]. After them, several works have extended their experiment down to diameters of about 3 µm and they have observed that the decrease of the apparent viscosity continues down to diameters of about 10 µm. However, the Faharaeus-Lindqvist effect is reversed at diameters 5 to 7 µm (see Fig. 9). This phenomenon indicates that the tube Hct is not the only parameter affecting the apparent viscosity. Thus, it is believed that the plasma layer and also the microscopic motions of RBCs play an important role on the apparent blood viscosity [7, 16, 19, 20].
Figure 9: Relative apparent viscosity of in vitro blood through glass capillaries with diameters between 3.3µm and 800µm (adapted from [19, 21, 22]).
Figure 10: The RBCs axial migra velocity gradient (
γ
) of the flow [2The rheological behavior of viscometers, since it is stron deformability or aggregation an viscosity fails to increase with observation does not corrobor Goldsmith [28], have measured albumin-saline flowing through when RBCs were suspended in the RBCs aggregation. This su plasma layer enhanced by RBC hydrodynamic resistance has in plasma layer. It should be noted low shear rate only if sediment aggregation on the blood visc aggregation of cells still remain.
Figure 11: Hydrodynamic
Microscopic flow behavior in m
In order to obtain further insigh 25, 31, 32] have performed seri
gration may be explained by the tank-tread motion of the RBC [26].
f blood in microcirculation can not be directly es ongly influenced by several combined effects of t and RBC radial distribution. In fact several researcher th decreasing shear rate or increasing RBCs aggregation borate with the findings provided from rotational vi red the hydrodynamic resistance of normal RBCs suspe gh vertical microtubes at low flow rates. In Fig. 11 it is in dextran 110 the hydrodynamic resistance decreased surprising phenomenon is maybe due to the increase BCs aggregation. In contrast when RBCs were suspend increased linearly mainly because there was not any a ted that in horizontal tubes an increase of the apparent entation of RBCs occurs [29, 30]. Despite the significa iscosity, some controversies related to the chemical in.
mic resistance (R) as a function of mean tube velocity (
U
) (adin microchannels
ight into the blood rheological behavior, Goldsmith and eries of experiments with diluted and concentrated susp
e RBC membrane due to the
estimated from rotational f the plasma layer, RBC ers have observed that the tion tendency [27-29]. This viscometers. Cokelet and pended in dextran 110 and t is possible to observe that ed at low flow rates due to se of the thickness of the nded in albumin-saline the aggregation of RBCs and nt viscosity may happen at icance of the role of RBCs cals used to enhance the
(adapted from [28]).
of particles and RBCs through a glass capillaries. In their experiments they used a conventional microscope in order to obtain detailed information about the blood flow behavior at a microscopic level.
Particles and RBCs in diluted suspensions
In Poiseuille flow, the behavior of suspended particles depends on several factors such as shear rate, particle deformability, size and shape. Generally, at low shear rates and diluted suspensions, rigid spherical particles and hardened RBCs (HRBCs) tend to move axially without any radial migration. On the other hand, deformable bodies tend to migrate towards the tube axis due to a radial hydrodynamic force. For higher (>1) particle Reynolds number (Rep) where the inertial forces become important, both deformable bodies and rigid spheres have axial migration, however the spheres not always migrate toward the centre. The spheres near the wall moves towards the centre whereas the ones in the centre moves towards the wall. At the end they reach an equilibrium radial position of 0.6R, where R is the tube radius. This effect is known as tubular pinch effect. Fig. 12 shows typical motions for rigid and deformable particles [1, 24, 25].
Figure 12: Schematic representation of migration differences of rigid, deformable particles and HRBCs in the median plane of the microtube. The particle Reynolds number (Rep) is defined by using the particle diameter as the characteristic length-scale (adapted from [24, 25]).
The motion of a single RBC in plasma undergoing Poiseuille flow reflects the behavior of both rigid and deformable particles. When the shear rate (
γ
) is less than approximately 20s-1, the cell seems to rotate in orbits similar to rigid discs where they flip and rotate with a periodically varying angular velocity (rotational and tumbling motion). At low shear rates it was observed that its biconcave shape retains while rotating, however it was also observed that the RBCs tended to migrate away from the walls suggesting that small deformations may also occur. Atγ
> 20 s-1 the rotation progressively deviates from that of rigid disks and tend to be aligned with the direction of the flow. Atγ
around 33 s-1, the RBCs cease to rotate as a whole and instead deform and rotate around the interior of cell, the so-called “tank-tread” motion. Although there is no experimental evidence, it is suggested that the membrane motion is transmitted into the interior of cell (cytoplasm) and may enhance the circulation of the hemoglobin (Hb) solution and consequently it may play an important role in the oxygen release from RBCs to tissues. At very high shear rates (γ
> 5000 s-1), RBCs are subjected to the tubular pinch effect with an equilibrium position nearer to the centre of the microtube [1, 7, 25].RBCs in concentrated suspensions
Although the flow properties of RBCs in diluted suspensions were extensively studied for many the years, such is not the case when the RBCs flow within a crowded environment. The reason is mainly related to technical limitations of optical systems to obtain reliable measurements at Hct bigger than 10%. However, Goldsmith and coworkers [14, 24, 31, 32] have overcome this technical difficulty by using transparent RBCs (known as ghost cells) as the suspension medium. By using ghost cells they were able to study the behavior of individual RBC flowing in concentrated suspension of RBC ghosts. Although there are controversies whether ghost cells have the same rheological properties of normal RBCs [32, 33], to our knowledge their work have provided the best insight into the complex behavior of RBCs flowing in the interior of concentrated suspensions.
The motion of RBCs in concentrated suspensions is appreciably different from those observed in very diluted suspensions (Hct < 1 %). At concentrated suspensions the motion of RBCs is disturbed not only by the collisions with neighboring cells but also by the plasma layer near the wall. In this way, the cell paths exhibit continuous erratic displacements with the largest ones occurring in the region between 0.5 and 0.8 of the tube radius from the axis. At a given microtube, the magnitude of radial displacements tends to increase with the concentration of RBC ghost cells. However, at concentrations bigger than 50%, the displacement decreases. At Hct > 50%, although the crowded environment leads to an increase of the cell deformation, it also limits the magnitude of the RBC radial dispersion [14, 31, 32].
The RBCs flowing at Hct bigger than 30% are deformed into a variety of shapes and rotate irregularly. Qualitative observations indicate that the degree of deformation increases with the concentration of ghost cells. It was also observed that at the centre of microtube some RBCs have retained their biconcave shape [31, 32]. Although the work of Goldsmith has provided important qualitative observations on the microscale behavior of RBCs flowing through microtubes, this research field remains relatively unexplored.
Velocity profiles
Blood flow velocity in microvessels and microchannels have been measured during the years by several measurements techniques such as: double-slit photometric [33, 34], video microscopy and image analysis [24, 32, 36, 37], laser-Doppler anemometer [38-42]. and particle-measuring methods [43, 44]. From all these studies there is no general consensus about the actual velocity profile in microvessels. Although some results reported parabolic profiles [34, 42, 43], others suggested blunt profiles [24, 32, 36, 44] and even others reported blunt profiles at extremely low velocities and diameters and parabolic profiles at diameters bigger than about 100µm [33, 40]. The large scatter of results reflects the complexity of the phenomena happening in microcirculation. However, it is clear from the past researches that the flow velocity profiles are strongly affected by several combined parameters such as : Hct, microtube diameter, shear rate, flow rate, suspension fluid (plasma, PS or dextran), experimental errors, concentration of trace particles, etc. Despite the great amount of research on this area, experimental evidence remains scarce and controversies still remain.
Figure 13: Schematic representation of the velocity profiles at Re <1 in capillaries for RBCs suspended in diluted (<1% Hct) and concentrated (32% Hct) suspensions. Local velocities (u(r)) are plotted as ratios of the centre line velocity (Uavg). R and r correspond, respectively, to the microtube radius and radial position (r) from the tube axis (adapted from [1, 14]).
Although qualitatively these results may provide a good basis of actual flow behavior of blood through microchannels, careful interpretation of the results should be considered due not only to the use of ghost cells but also unknown temporal and spatial resolution of the measurement technique.
Relevance of blood flow in microchannels
The complexity to control and obtain reliable measurements of the blood flow behavior through the in vivo microvascular system has led several researchers to perform their studies by using narrow glass tubes with simple geometries. By using in vitro models it allow a more precise control over the experimental variables of interest and extract detailed information of the flow behavior of individual blood cells. In fact, much of the understanding of the haemodynamics phenomena observed in microcirculation was obtained from studies on the both macro and microrheology properties of blood flowing through glass microtubes. Although glass microchannels present certain similarities to in vivo microcirculation, it is also clear that these kind of static in vitro experiments differ from microvessels in several respects, such as: elasticity of microvessels, role of the irregularly shaped endothelial surface and effect of the branches and asymmetrical structure of microvessels. Thus it was not surprising that several studies on blood flow in glass microtubes and in microvessels have yielded conflicting results with respect to flow resistance [45] and deformability of RBCs [46]. In the former case, they reported that the apparent viscosity was higher in vivo than in glass tubes whereas in the latter they have found that RBCs deform less in microvessels. However, the observed in vivo/in vitro discrepancies have not yet been convincingly explained. As a result, further work is clearly needed in this research field.
BioMEMS – the new generation of microchannels
current MEMS technology can not manufacture accurately microchannels with circular cross section. Instead they usually fabricate microchannels with rectangular cross section. Despite the great significance of this limitation, research on this field remains extremely scarce. A simple technique, known as wire casting technique, to overcome this limitation was recently published elsewhere [53]. The proposed method is rapid, inexpensive and requires no clean room or specialized equipment to fabricate straight circular microchannels by using precision wires of different materials. Detailed information about this fabrication technique can be found elsewhere [17, 53].
a) b)
Figure 14: In vitro blood flowing through a (a) bifurcation and (b) stenosis fabricated by soft lithography.
Flow visualization techniques in microcirculation
In large blood vessels, the conventional non-invasive medical instruments to measure the blood flow are the Doppler ultrasound and magnetic resonance imaging (MRI) techniques. Although, both techniques have revolutionized cardiovascular diagnosis, these in vivo diagnostic techniques have several limitations. One of them is the inability to obtain quantitative detailed information at a microscale level due to the relatively poor spatial resolution [54, 55]. Accordingly, these techniques did not gain popularity among the microcirculation research community.
In the past, blood flow in both microvessels and microchannels has been measured by several measurements techniques such as: double-slit photometric [33, 34], laser-Doppler anemometer [38-42]. These techniques used direct photometric information obtained without image information [56]. However, most successful techniques are the video-based methods [24, 32, 36, 37]. Generally, these methods record video-microscopy images in order to be analyzed off-line by using image processing techniques.
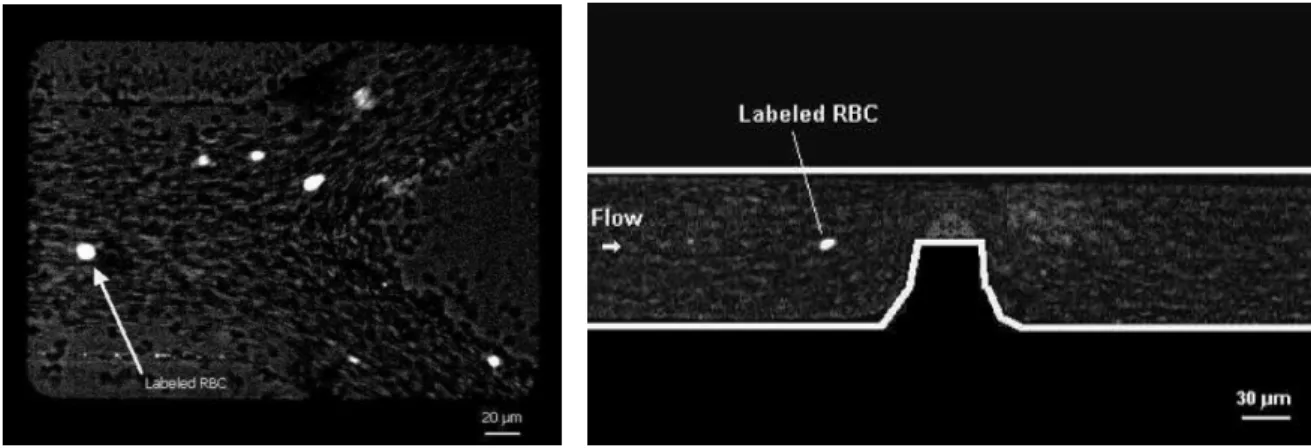
contributes to diminish the concentration of tracer particles in the acquired confocal images. This low density images become more evident for Hct bigger than 20 %, which generates spurious errors in the velocity fields. For this reason, Lima and his colleagues [17, 18, 74] have developed a new approach to track individual tracer cells at high concentration suspensions of RBCs. Hence, a confocal micro-PTV system was employed, for the first time, in an effort to obtain detailed quantitative measurements on the motion of blood cells at both diluted and high suspensions of RBCs (see Fig. 15). The authors have successfully labeled both RBCs and WBCs and have measured their motions through a 100 µm glass capillary. The ability of the confocal system to generate thin in-focus planes has allowed both qualitative and quantitative measurements in flowing blood at concentrated suspensions (up to 35% Hct) of: cell-cell hydrodynamic interaction, RBC orientation and RBC radial dispersion at different depths [18, 74]. Further research was carried on to determine the RBCs radial dispersion coefficient (Dyy) in the middle plane of a 50µm and 100 µm glass capillaries at low Reynolds
numbers (from 0.003 to 0.005) [74]. The results demonstrated that RBCs Dyy tends to increase with the Hct
but at Hct of about 24% it tends to level off. This finding suggests that at moderate Hcts the development of the plasma layer and consequent decrease of the local cell density surrounding the RBCs may enhance the radial dispersion of RBCs.
Figure 15: Confocal micro-PTV system used to measure the flow of labeled RBCs at both diluted and high suspensions of blood cells (adapted from [18, 74]).
(PDMS) microchannel, which was fabricated by soft lithography. Generally, the velocity profiles were found to be markedly blunt in the central region, mainly due to the low aspect ratio (h/w = 0.15) of the rectangular microchannel. Predictions using a theoretical model for the rectangular microchannel corresponded quite well with the experimental micro-PIV results for the PS fluid. However, for the in vitro blood with 20% Hct, small fluctuations were found in the ensemble velocity profiles most likely due to the interactions between neighbouring RBCs, high shear rate generated in the vicinity of the walls, and temporal fluctuations of the local Hct. Additionally, this work also demonstrated that confocal micro-PIV can be effectively integrated with a PDMS microchannel and used to obtain blood velocity profiles along the full depth of the microchannel because of its unique 3-D optical sectioning ability [47].
PDMS rectangular microchannels have been used to study blood flow in complex geometries, including bifurcations and stonosis, in an effort to mimic human arterioles and capillary networks [48, 49, 75]. However, these microchannels have a rectangular cross-section, in contrast to living microvessels which have close to circular cross-section, and thus the blood rheology through them may be significantly different from that of in vivo blood vessels. Therefore, very recently Lima et al [53] have proposed a simple method based in a wire casting technique to fabricate circular polydimethysiloxane (PDMS) microchannels, suitable for in vitro hemodynamic studies. By using precision wires of different materials they were able to fabricate straight PDMS microchannels with diameters in the range of 50–250 m. The method is rapid, inexpensive and requires no clean room or specialized equipment. By using a confocal micro-PTV system individual red blood cells (RBCs) were successfully tracked trough a 75 m circular PDMS microchannel. The results showed that RBC lateral dispersion tends to increase with the Hct.
Besides the ability to produce models with diameters comparable to in vivo microvessels, this axisymmetric PDMS microchannel has also good permeability to gases. This property makes these microchannels adequate to culture living cells on their surfaces, such as endothelial cells. Recently, Kaji and his colleagues [50-52], by using an innovative cellular micropatterning technique based on electrochemical method, have successfully cultured endothelial cells on the surfaces of rectangular PDMS microchannel and silicone tubing. In the near future the authors intend to pattern endothelial cells on the surfaces of the proposed circular PDMS microchannel. By culturing endothelial cells within the microfluidic device, we expect to develop a flow system device that closely mimics the in vivo environment and also to identify and quantitatively measure cellular and molecular events occurring between the blood cells and endothelium.
ADVANCES IN NUMERICAL STUDIES ON MICROSCALE HEMODYNAMICS
In a large vessel, the scale of generated flow field is much larger than the scale of a red blood cell (RBC). Thus, one can assume that the blood is homogeneous. In solving a blood flow in a large vessel, constitutive equations are used to express the rheological property of blood. Casson model [78] is often used as a constitutive equation of blood, which is given as:
(1)
where τ is the shear stress, λ is the plasticity, µ is the viscosity and
γ
is the shear rate. Casson model can express the plasticity and the shear-thinning property of blood.In a small vessel, however, the scale of generated flow field sometimes becomes comparable to the scale of a RBC. In such a case, the constitutive equations assuming homogeneous fluid is no longer valid, and the motion of individual RBCs needs to be solved in order to discuss the blood flow. In this section, we will briefly explain numerical methods appropriate for microscale blood flows; a boundary element method, immersed boundary methods, and particle methods.
,
Boundary element method
The RBC can be modeled by a capsule with a thin membrane and containing Newtonian fluids. The flow around a RBC is assumed to be a Stokes flow, given that the Reynolds number based on the cell diameter and the velocity variation in the cell scale are usually much less than unity. In using a capsule model, the flow field inside and outside a capsule can be described by the Stokes equation and the continuity equation, and the problem is closed with equilibrium and constitutive equations describing a mechanical behavior of the membrane. One of the most successful numerical method for addressing this problem is a boundary element method (BEM) first developed by Youngren and Acrivos [79].
Figure 16: Schematics of the system, where a capsule is deforming in a flow field.
Let a capsule with the inside viscosity λµ be in an infinite fluid with the viscosity µ (see Fig. 16). By assuming Stokes flow, the velocity u around the capsule can be expressed by the integral form as [80, 81]:
∫
∫
+
−
+
+
−
+
=
∞ y yA i ijk k y
A j ij y
j j
dA
n
K
u
dA
J
f
u
u
)
(
)
,
(
)
(
)
1
(
4
1
)
,
(
)
(
)
1
(
4
1
)
(
1
2
)
(
y
y
x
y
y
x
y
x
x
λ
π
λ
λ
πµ
λ
, (2)
where
u
∞ is the background flow field, n is the outward normal vector, f is the traction force on the surface. The green functions J and K are given by:|
|
,
,
6
)
,
(
,
)
,
(
x
y
=
+
3x
y
=
−
5r
=
y
−
x
r
=
r
r
r
r
r
K
r
r
r
r
J
ijk i j kj i ij ij
δ
, (3)
The main advantage of the integral equation is that all unknown quantities are distributed on the particle surface. In the BEM, the boundary integral equation is approximated by the summation at discrete collocation points on the surface, so that a computational mesh needs to be generated only on the two-dimensional surface, even though the flow problem is fully three-dimensional. The total number of meshes required is much less than with other numerical methods, which leads to a low computational load. Moreover, the BEM can easily deal with an infinite computational domain. In the Stokes flow regime, a flow disturbance due to a point force decays as 1/r, where r is the distance; thus a fairly large computational domain must be generated to avoid numerical errors resulting from the boundary conditions. In the case of the BEM, however, such boundary conditions are automatically satisfied by selecting appropriate kernel functions in the boundary integral equation.
In analyzing the motion of a capsule in a background flow field, we also need an equilibrium equation to describe the membrane deformation. The membrane of a RBC is made by a lipid bilayer, and its thickness is in the order of 10nm. Thus, it is often assumed as a thin membrane of isotropic hyper-elastic material. By using shell mechanics, the membrane equilibrium equation can be given by [82, 83]:
µ
λµ
n
0
)
2
,
1
(
0
=
+
Γ
−
∂
∂
−
=
=
+
−
Γ
+
Γ
+
∂
∂
nf
q
q
b
T
f
q
b
T
T
T
λ β βλ β β αβ αβ β α β α αλ β αλ λβ α αλ α αβθ
β
θ
, (4)
where Γ is the Christoffel symbol, b is the curvature vector, q is the transverse tension. In plane tension tensor T is related to a strain energy function W as:
αβ αβ αβ
a
I
W
J
A
I
W
J
T
ss 1 2
2
2
∂
∂
+
∂
∂
=
, (5)where A and a are metric tensors, λ1 and λ2 are extension ratios in the principal strain directions, and Js =
λ1λ2. A RBC membrane has to satisfy the local area incompressibility, because the area of lipid bilayer is
hardly changed by the viscous force generated by a normal blood stream. Skalak model [84] is well known to express appropriately the membrane rheology, which is given by:
(
)
[
2 2]
2 1 2
1
2
2
1
4
+
−
+
−
=
s s SKJ
C
I
I
I
G
W
, (6)where Gs is a modulus of elasticity, C is the ratio of two moduli,
2
2 2 2 1
1
=
λ
+
λ
−
I
, andI
2=
J
s2−
1
. The large deformation of a RBC has been simulated using the BEM, representing a field pioneered by Pozrikidis [85-89], who performed computations for a capsule of biconcave unstressed shape over an extended range of dimensionless shear rates and for a broad range of ratios of internal to external fluid viscosities. The membrane used in that study was nearly incompressible and exhibited an elastic response to shearing and bending deformation. They clarified the deformation of a cell and the stress exerted on the membrane in simple shear and extensional flows, as well as the migration of a cell in a tube flow. Nevertheless, some problems remain in these simulations. For example, a capsule of biconcave unstressed shape does not show a smooth tank-treading motion because the membrane stiffness is not homogeneous. Lac and Barthes-Biesel [83, 90] recently reported that the pre-stress of a membrane is important in the deformation of a capsule. It may be that an appropriate pre-stress is essential for simulating RBC motion. Future studies are needed to clarify this point.Although accounting for membrane pre-stress is difficult in simulating single-cell deformation, another challenge exists in modeling the interaction between two RBCs. The cell-cell interaction is not purely a hydrodynamic phenomena, and currently, two accepted theories describe the mechanism of aggregation: the bridging of two cells by cross-linking molecules [91] and osmotic force generated by the depletion of molecules in the intercellular space [92]. Since such biochemical phenomena have not been included in most of former studies, a precise aggregation model needs to be established.
Normal blood has a volume concentration of RBCs of about 40-45%, therefore, blood can be approximated as a concentrated suspension of RBCs. As the momentum, energy, and mass transport in blood are strongly dependent on the microscopic flow structures, many studies have tried to clarify the RBC motions in blood flow. However, numerical simulation of a concentrated suspension of RBCs has not yet been successful by the BEM. The main difficulties encountered in this simulation are that the motion of even a single RBC is difficult to simulate, the interactions among RBCs have not been precisely modeled, the number of cells involved is so great that the computational load is enormous, and lubrication flows in the thin intercellular space. Furthermore, the macroscale flow structure due to cell aggregation must be accurately resolved, indicating the divergent scale of flow fields to be addressed. Owing to these difficulties, the numerical simulation of a concentrated suspension of RBCs is currently one of the most challenging tasks in this field of research.
Immersed boundary method
blood flow in the heart, and the method was extended to a front-tracking method by Univerdi and Tryggvason [94]. In the IBM, fluids inside and outside capsule are treated as a single-phase fluid. Here, we assume that the fluid motion is governed by the following Navier-Stokes equation:
(
u
u
)
f
uu
u
+
∇
⋅
=
−∇
+
∇
⋅
∇
+
∇
+
∂
∂
Tp
t
ρ
µ
ρ
, (7)where t is the time, ρ is the density, u is the flow velocity, p is the pressure, µ is the viscosity, and f is the force generated by the membrane. The Navier-Stokes equation is solved on fixed Eulerian meshes and the motion of the membrane is solved by the Lagrangian procedure. The force f is only found at the surface of the membrane, but in general, the surface is not right on the nodal points of the fluid meshes. To impose the no-slip boundary condition at the surface, the surface force must be interpolated at the fluid node. A smoothed delta function is often employed to interpolate the surface force:
∑
−
=
I I i Ii
)
(
)
D
(
)
(
x
f
x
x
x
f
, (8)where the notation i represents the fluid node, I is the membrane node, and D is the smoothed delta function. The velocity of the membrane node is also interpolated using the smoothed delta function:
∑
−
=
i I i iI
)
(
)
D
(
)
(
x
u
x
x
x
u
. (9)For discretization of Eq. (7), we can use standard finite difference methods. More detailed description is found in [95]. For the motion and deformation of the membrane, the similar methods described in the section 3.1 can be used.
First application of the IBM to microscale hemodynamics was done by Eggleton and Popel [96]. They analyzed the deformation of red blood cells in a simple shear flow. Bagchi [97] employed the IBM to simulate two-dimensional flow including 2500 red blood cells. Li and Sarkar [98] presented that the IBM provided the compared results with those obtained from the BEM for the deformation of capsules in a simple shear flow.
Finite element formulation of Eq. (7) is also combined with the IBM. Liu and Liu used the immersed finite element method (IFEM) [99] to study the aggregation of red blood cells [100]. Using the high-order shape function, employed in the reproducing kernel particle method [101], the accuracy in the fluid-structure coupling is improved in the IFEM. Recent applications of the IFEM to biological flows were reviewed in [102].
Simulations by the lattice Boltzmann method (LBM) [103] have been also presented recently. The LBM is a kinetic based method and the discretized Boltzmann equation is solved instead of Eq. (7):
[
(
,
)
(
,
)
]
1
)
,
(
)
,
(
t
t
t
t
t
eqt
i i
i i
i
x
c
φ
x
τ
φ
x
φ
x
φ
+
∆
+
∆
−
=
−
−
, (10)where i is the velocity direction, φ is the single-particle distribution function, c is the particle velocity, τ is the relaxation time, and φeq is the equilibrium distribution function. From the distribution function (10), the density and momentum of fluid are obtained:
∑
= i
i φ
ρ , (11)
∑
= i
i iφ
ρu c . (12)
method for flow simulations, even without the IBM, the simple algorithm and efficiency for parallel computations should be advantageous features for future simulations as shown in Dupin et al [106].
Particle method
Mesh free particle methods are also suitable for microscale hemodynamics problems. Consider the continuity and Navier-Stokes equations in the Lagrangian description:
0
=
Dt
D
ρ
, (13)(
u
u
)
f
u
=
−∇
p
+
∇
⋅
∇
+
∇
T+
Dt
D
ρ
µ
, (14)
where D/Dt is the Lagrangian derivative. In the particle methods, both the membrane of capsules and the internal and external fluids are represented by the cluster of particles. Note that each particle is not a real fluid particles but a discrete point for computation. Fluid variables are calculated at the computational point and it is moved by the calculated advection velocity every time step. A major advantage of the particle method is the coupling with front-tracking. The particle method tracks the front of membrane using the membrane particles, where the velocity of the membrane particles is also given by Eq. (14). The force f is directly imposed to the membrane particles, that is, any smoothing (interpolation) methods are not needed. A well known particle method is the smoothed particle hydrodynamics (SPH) method [107]. Tanaka and Takano [108] employed this method to simulate the tank treading and axial migration of RBCs. Tsubota et al. [11] also simulated the motion of RBCs using the moving particle semi-implicit (MPS) method [109]. More recently, Kondo et al. [110] and Imai et al. [111] extensively applied this method to model hemodynamics arising malaria infection (see Fig. 17)). Because of the flexibility of the particle method, it would be an efficient method when we model more complex problems involving biological interactions.
Figure 17: A particle model of hemodynamics in malaria infection.
Malaria infected RBC
ACKNOWLEDGEMENTS
This study was supported in part by the following grants: Grant-in-Aid for Science and Technology (PTDC/SAU-BEB/108728/2008, PTDC/SAU-BEB/105650/2008 and PTDC/EME-MFE/099109/2008) from the Science and Technology Foundation (FCT), Portugal and Grant-in-Aid for Scientific Research (S) from the Japan Society for the Promotion of Science (JSPS; No.19100008). We also acknowledge the support from the 2007 Global COE Program “Global Nano-Biomedical Engineering Education and Research Network”. The authors would also like to thank the many colleagues and students who helped to undertake this survey.
REFERENCES
[1] Caro C, Pedley T, Schroter R, Seed W. The mechanics of the circulation. USA: Oxford University Press 1978. [2] Fung Y. Biomechanics – Circulation. 2nd ed. New York: Springer-Verlag 1997.
[3] Yamaguchi T, Ishikawa T, Tsubota K, et al. Computational blood flow analysis – new trends and methods. J Biomech Sci Eng 2006; 1: 29-50.
[4] Burton A. Physiology and biophysics of the circulation. Chicago: Year Book Medical Publishers 1966. [5] Fahraeus R, Lindqvist T. The viscosity of the blood in narrow capillary tubes. Am J Physiol 1931; 96: 562-8.
[6] Wetzel B, Schaefer H. National Cancer Institute. Human Blood Cells. 1982. Available from: http://en.wikipedia.org/wiki/Wikipedia:Featured_picture_candidates/Human_Blood_Cells
[7] Chien S, Usami S, Skalak R. Blood flow in small tubes. In: Geiger RR Eds. Handbook of physiology – The cardiovascular system IV, American Physiological Association 1984; pp.217-49.
[8] Shiga T, Maeda N, Kon K. Erythrocyte rheology. Crit Rev Oncol Hemat 1990; 10: 9-48.
[9] Fung Y. Biomechanics – Mechanical properties of living tissues. 2nd ed. New York: Springer-Verlag 1993.
[10] Minamiyama M. In vivo microcirculatory studies: In vivo video images of microcirculation part 2. 2000. Available from: http://www.ne.jp/asahi/minamiya/medicine/
[11] Tsubota K, Wada S, Yamaguchi T. Particle method for computer simulation of red blood cell motion in blood flow. Comput Meth Prog Bio 2006; 83: 139-46.
[12] Waite L. Biofluid mechanics in cardiovascular systems, USA: McGraw-Hill 2005.
[13] Chien S. Shear dependence of effective cell volume as a determinant of blood viscosity. Science 1970; 168: 977-9. [14] Goldsmith H, Turitto V. Rheological aspects of thrombosis and haemostasis: basic principles and applications. ICTH-Report-Subcommittee on Rheology of the International Committee on Thrombosis and Haemostasis. Thromb Haemostasis 1986; 55(3): 415–35.
[15] Levick JR. An introduction to cardiovascular physiology. 4th ed. London: Arnold 2003. [16] Maeda N. Erythrocyte rheology in microcirculation. Jpn J Physiol 1996; 46: 1-14.
[17] Lima R. Analysis of the blood flow behavior through microchannels by a confocal micro-PIV/PTV system. PhD(Eng.) dissertation, Bioengineering and Robotics Department, Tohoku University, Japan, 2007.
[18] Lima R, Ishikawa T, Imai Y, et al. Measurement of individual red blood cell motions under high hematocrit conditions using a confocal micro-PTV system. Ann Biomed Eng 2009; 37, 8: 1546-59.
[19] Pries A, Neuhaus D, Gaehtgens P. Blood viscosity in tube flow: dependence on diameter and hematocrit. Am J Physiol 1992; 263: H1770-8.
[20] Pries A, Secomb T. Rheology of the microcirculation. Clin Hemorheol Micro 2003; 29: 143-8.
[21] Wada S, Kobayashi R. Simulation of the shape change of a red blood cell at the entrance of a capillary. In: Proceedings of the 4th World Congress of Biomechanics, Calgary, Canada, 2002.
[22] Tsubota K, Wada S, Yamaguchi T. Simulation study on effects of hematocrit on blood flow properties using particle method. J Biomech Sci Eng 2006; 1: 159-70.
[23] Schmid-Schonbein H, Wells R. Fluid drop-like transition of erythrocytes under shear. Science 1969; 165: 288-91. [24] Goldsmith H. Red cell motions and wall interactions in tube flow, Fed Proc 1971; 30(5): 1578-88.
[25] Goldsmith H. Deformation of human red cells in tube flow, Biorheology 1971; 7: 235-42.
[26] Mchedlishvili G, Maeda N. Blood flow structure related to red cell flow: a determination of blood fluidity in narrow microvessels. Jpn J Physiol 2001; 51: 19-30.
[27] Reike W, Gaehtgen W, Johnson P. Blood viscosity in small tubes: effect of shear rate, aggregation, and sedimentation. Am J Physiol 1987; 253: H540-7.
[28] Cokelet G, Goldsmith H. Decreased hydrodynamic resistance in the two-phase flow of blood through small vertical tubes at low flow rates. Circ Res 1990; 68 (1): 1-17.
[29] Alonso C, Pries A, Kiesslich O, Lerche D, Gaehtgens P. Transient rheological behaviour of blood in low-shear tube flow: velocity profiles and effective viscosity. Am J Physiol 1995; 268: H25-32 .
[30] Gaehtgens P. Tube flow of human blood at near zero shear. Biorheology 1987; 24: 367-76.
[31] Goldsmith H, Karino T. Microscopic considerations: the motions of individual particles. Ann NY Acad Sci 1977; 283: 241-55.
[32] Goldsmith H, Marlow J. Flow behavior of erythrocytes. II. Particles motions in concentrated suspensions of ghost cells, J Colloid Interf Sci 1979; 71 (2): 383-407.
[33] Nash G, Meiselman H. Red cell and ghost viscoelasticity. Effects of hemoglobin concentration and in vivo aging. Biophysical Journal 1983; 43: 63-73.
[34] Baker M, Wayland H. On-line volume flow rate and velocity profile measurement for blood in microvessels. Microvasc Res 1974; 7: 131-43.
[36] Tangelder G, Slaaf D, Muijtjens M, et al. Velocity profiles of blood platelets and red blood cells flowing in arteriols of rabbit mesentery. Circ Res 1986; 59: 505-14.
[37] Parthasarathi A, Japee S, Pittman R. Determination of red blood cell velocity by video shuttering and image analysis. Ann Biomed Engi 1999; 27: 313-25.
[38] Einav S, Berman R, Fuhro P, DiGiovanni P, Fine S, Fridman J. Measurement of velocity profiles of red blood cells in the microcirculation by laser Doppler anemometry (LDA). Biorheology 1975; 12: 207-10.
[39] Born G, Melling A, Whitelaw J. Laser Doppler microscope for blood velocity measurement. Biorheology 1978; 15: 163-72.
[40] Cochrane T, Earnshaw J, Love A. Laser Doppler measurement of blood velocity in microvessels, Med Biol Eng Comput 1981; 19: 589-96.
[41] Uijttewaal W, Nijhof E, Heethaar R. Lateral migration of blood cells and microspheres in two-dimensional Poiseuille flow: a laser Doppler study. J Biomech 1994; 27: 35-42.
[42] Golster H, Linden M, Bertuglia S, et al. Red blood cell velocity and volumetric flow assessment by enhanced high-resolution laser Doppler imaging in separate vessels of hamster cheek pouch microcirculation. Microvasc Res 1999; 58: 62-73.
[43] Sugii Y, Okuda R, Okamoto K, Madarame H. Velocity measurement of both red blood cells and plasma of in vitro blood flow using high-speed micro PIV technique. Meas Sci Technol 2005; 16: 1126-30.
[44] Nakano A, Sugii Y, Minamiyama M, Niimi H. Measurement of red cell velocity in microvessels using particle image velocimetry (PIV). Clin Hemorheol Micro 2003; 29: 445-55.
[45] Pries A, Secomb T, Gessner T, et al. Resistance to blood flow in microvessels in vivo. Circ Res 1994; 75: 904-15. [46] Suzuki Y, Tateishi N, Soutani M, Maeda N. Deformation of erythrocytes in microvessels and glass capillaries: effects of erythrocyte deformability. Microcirculation 1996; 3: 49-57.
[47] Lima R, Wada S, Tanaka S, et al. In vitro blood flow in a rectangular PDMS microchannel: experimental observations using a confocal micro-PIV system. Biomed Microdevices, 2008; 10, 2: 153-67.
[48] Fujiwara H, Ishikawa T, Lima R, et al. Red blood cell motions in a high hematocrit blood flowing through a stenosed micro-channel. J Biomech, 2009; 42: 838-43.
[49] Lima R, Nakamura M, Omori T, Ishikawa T, Wada S, Yamaguchi T. Microscale flow dynamics of red blood cells in microchannels: an experimental and numerical analysis, In: Tavares JM, Jorge RM, Eds. Computational Vision and Medical Processing: Recent Trends. Springer 2010 (in press).
[50] Kaji H, Kawashima T, Nishizawa M. Patterning cellular motility using an electrochemical technique and a geometrically-confined environment. Langmuir 2006; 22: 10784-7.
[51] Kaji H, Hashimoto M, Kawashima T, et al. An electrochemical microsystem for manipulating living cells. In: Esashi M, Ishi K, Ohuchi N, Osumi N, Sato M, Yamaguchi T, Eds. Future Medical Engineering based on Bio-nanotechnology, ICP, 2007; pp.3-14.
[52] Kaji H, Sekine S, Hashimoto M, et al. Stepwise formation of patterned cell co-cultures in silicone tubing. Biotechnol Bioeng 2007; 98: 919-25.
[53] Lima R, Oliveira, MSN, Ishikawa T, et al. Axisymmetric PDMS microchannels for in vitro haemodynamics studies. Biofabrication 2009; 1, 3: 035005.
[54] Giddens D, Zarins C, Glagov S. The role of fluid mechanics in the localization and detection of atherosclerosis. Journal of Biomechanical Engineering 1993; 115: 588–94.
[55] Stanton A. Haemodynamics, wall mechanics and atheroma: a clinician’s perspective. Proc Inst Mech Engrs, H 1999; 213: 385-90.
[56] Slaaf D, Arts T, Jeurens T, et al. Electronic measurement of red blood cell velocity and volume flow in microvessels, In: Chayen J, Bitensky L, Eds. Investigative Microtechniques in Medicine and Biology, New York, Marcel Dekker 1984; pp. 327-64.
[57] Sugii Y, Nishio S, Okamoto K. In vivo PIV measurement of red blood cell velocity field in microvessels considering mesentery motion. Physiol. Meas. 2002; 23: 403-16.
[58] Chiu J, Chen C, Lee P, et al. Analysis of the effect of distributed flow on monocytic adhesion to endothelial cells. J Biomech 2003; 36: 1883-95.
[59] Bitsch L, Olesen LH, Westergaard CH, et al. Micro particle-image velocimetry of bead suspensions and blood flows. Exp Fluids 2005; 39: 505-11.
[60] Vennemann P, Kiger K, Lindken R, et al. In vivo micro particle image velocimetry measurements of blood-plasma in the embryonic avian heart. J Biomech 2006; 39: 1191-200.
[61] Kim GB, Lee SJ. X-ray PIV measurements of blood flows without tracer particles. Exp Fluids 2006; 41: 195-200. [62] Meinhart C, Wereley S, Gray H. Volume illumination for two-dimensional particle image velocimetry. Meas Sci Technol 2000; 11: 809-14.
[63] Meinhart C, Wereley S, Santiago J. PIV measurements of a microchannel flow. Exp Fluids 1999; 27: 414-9.
[64] Meinhart C, Wereley S, Santiago J. A PIV algorithm for estimating time-averaged velocity fields. J Fluids Eng 2000; 122: 285-9.
[65] Nguyen N, Wereley S. Fundamentals and applications of microfluidics, Norwood, MA: Artech House 2002.
[66] Ichihara A, Tanaami T, Isozaki K, et al. High-speed confocal fluorescent microscopy using a Nipkow scanner with microlenses for 3-D imaging of single fluorescent molecule in real time. Bioimages 1996; 4 (2) : 57-62.
[67] Tanaani T, Otsuki S, Tomosada N, et al. High-speed 1-frame/ms scanning confocal microscope with a microlens and Nipkow disks. Appl Optics 2002; 41 (22): 4704-8.
[68] Inoue S, Inoue T. Direct-view high-speed confocal scanner: the CSU-10. Cell Biological Applications of Confocal Microscopy. Academic Press, 2002; pp. 87-127.
[70] Park J, Kihm K. Use of confocal laser scanning microscopy (CLSM) for depthwise resolved microscale-particle image velocimetry (µ-PIV). Opt Laser Eng 2006; 44: 208-23.
[71] Lima R, Wada S, Tsubota K, Yamaguchi T. Confocal micro-PIV measurements of three dimensional profiles of cell suspension flow in a square microchannel. Meas Sci Technol 2006; 17: 797-808.
[72] Kinoshita H, Kaneda S, Fujii T, Oshima M. Three-dimensional measurement and visualization of internal flow of a moving droplet using confocal micro-PIV. Lab on a Chip 2007; 7: 338–346.
[73] Lima R, Wada S, Takeda M, Tsubota K, Yamaguchi T. In vitro confocal micro-PIV measurements of blood flow in a square microchannel: the effect of the haematocrit on instantaneous velocity profiles. J Biomech 2007; 40: 2752-7. [74] Lima R, Ishikawa T, Imai Y, Takeda M, Wada S, Yamaguchi T. Radial dispersion of red blood cells in blood flowing through glass capillaries: role of heamatocrit and geometry. J Biomech 2008; 41: 2188-96.
[75] Shevkoplyas S, Gifford S, Yoshida T, Bitensky M. Prototype of an in vitro model of the microcirculation. Microvasc Res 2003; 65: 132-6.
[76] Toner M, Irimia D. Blood on a chip. Annu Rev Biomed Eng 2005; 7: 77-103.
[77] Faivre M, Abkarian M, Bickraj K, Stone H. Geometrical focusing of cells in a microfluidic device: an approach to separate blood plasma. Biorheology 2006; 43: 147-59.
[78] Casson N. Rheology of Disperse System. London: Pergamon Press 1959.
[79] Youngren GK, Acrivos A. Stokes flow past a particle of arbitrary shape: a numerical method of solution. J. Fluid Mech., 1975; 69: 377–403.
[80] Rallison JM, Acrivos A. A numerical study of the deformation and burst of a viscous drop in an external flow. J. Fluid Mech 1978; 89, 191–200.
[81] Pozrikidis C. Interfacial dynamics for Stokes flow. J Comp Phys 2001; 169: 250–301.
[82] Pozrikidis C, ed. Modeling and simulation of capsules and biological cells. Chapman & Hall, 2003.
[83] Lac E, Barthes-Biesel D, Pelekasis NA, Tsamopoulos J. Spherical capsules in three-dimensional unbounded Stokes flows: effect of the membrane constitutive law and onset of buckling. J Fluid Mech 2004; 516: 303–34.
[84] Skalak A, Tozeren R, Zarda P, Chien S. Strain energy function of red blood cell membranes. Biophys J 1973; 13: 245-64
[85] Ramanujan S, Pozrikidis C. Deformation of liquid capsules enclosed by elastic membranes in simple shear flow: large deformations and the effect of fluid viscosities. J Fluid Mech 1998; 361: 117–43.
[86] Kwak S, Pozrikidis C. Effect of membrane bending stiffness on the deformation of capsules in uniaxial extensional flow. Phys Fluids 2001; 13: 1234–42.
[87] Pozrikidis C. Effect of membrane bending stiffness on the deformation of capsules in simple shear flow. J Fluid Mech 2001; 440: 269–91.
[88] Pozrikidis C. Numerical simulation of the flow-induced deformation of red blood cells. Ann Biomed Eng 2003; 31: 1194–205.
[89] Pozrikidis C. Numerical simulation of cell motion in tube flow. Ann Biomed Eng 2005; 33: 165–78.
[90] Lac E, Barthes-Biesel D. Deformation of a capsule in simple shear flow: effect of membrane pre-stress. Phys Fluids 2005; 17: 1–8.
[91] Chein S, Jan KM. Ultrastructural basis of the mechanism of rouleaux formation. Microvasc Res. 1973; 5: 155–66. [92] Neu B, Meiselman HJ. Depletion-mediated red blood cell aggregation in polymer solutions. Biophys J 2002; 83: 2482–90.
[93] Peskin CS. Numerical analysis of blood flow in the heart. J Comput Phys 1977; 25: 220–33.
[94] Univerdi SO, Tryggvason G. A front-tracking method for viscous, incompressible multi-fluid flows. J Comput Phys 1992; 100: 25–37.
[95] Tryggvason G, Bunner B, Esmaeeli A, et al. A front-tracking method for the computations of multiphase flow. J Comput Phys 2001; 169: 708–59.
[96] Eggleton CD, Popel AS. Large deformation of red blood cell ghosts in a simple shear flow. Phys Fluids 1998; 10: 1834–45.
[97] Bagchi P. Mesoscale simulation of blood flow in small vessels. Biophys J 2007; 92: 1858–77.
[98] Li X, Sarkar K. Front tracking simulation of deformation and buckling instability of a liquid capsule enclosed by an elastic membrane. J Comput Phys 2008; 227: 4998–5018.
[99] Zhang L, Gerstenberger A, Wang X, Liu WK. Immersed finite element method. Comput Methods Appl Engrg 2004; 193: 2051–67.
[100] Liu Y, Liu WK. Rheology of red blood cell aggregation by computer simulation. J Comput Phys 2006; 220: 139–54. [101] Liu WK, Jun S, Zhang YF. Reproducing kernel particle methods. Int J Numer Methods Fluids 1995; 20: 1081–106. [102] Liu WK, Liu Y, Farrell D, Hsu, H. Immersed finite element method and its applications to biological systems. Comput Methods Appl Engrg 2006; 195: 1722–49.
[103] Succi S. The lattice Boltzmann equation for fluid mechanics and beyond. Oxford: Clarendon Press 2001.
[104] Zhang J, Johnson PC, Popel AS. An immersed boundary lattice Boltzmann approach to simulate deformable liquid capsules and its application to microscopic blood flows. Phys Biol 2007; 4: 285–95.
[105] Sui Y, Chew YT, Roy P, Low HT. A hybrid method to study flow-induced deformation of three-dimensional capsules. J Comput Phys 2008; 227: 6351–71.
[106] Dupin MM, Halliday I, Care CM, et al. Modeling the flow of dense suspensions of deformable particles in three dimensions. Phys Rev E 2007; 75: 066707.
[107] Monagan JJ. An introduction to SPH. Comput Phys Commun 1988; 48: 89–96.
[108] Tanaka N, Takano T. Microscopic-scale simulation of blood flow using SPH method. Int J Comput Methods 2005; 2: 555–68.
[110] Kondo H, Imai Y, Ishikawa T, et al. Hemodynamic analysis of microcirculation in malaria infection. Ann Biomed Eng 2009; 37: 702-9.
![Figure 1: a) Schematic diagram of the circulatory system. b) Schematic diagram showing the changes in blood pressure and Re on the large arteries, capillaries and veins [1, 4, 15]](https://thumb-eu.123doks.com/thumbv2/123dok_br/16862377.753725/2.892.155.788.247.601/figure-schematic-diagram-circulatory-schematic-pressure-arteries-capillaries.webp)
![Figure 2: Scanning electron microscope image of human blood cells (adapted from [6] )](https://thumb-eu.123doks.com/thumbv2/123dok_br/16862377.753725/3.892.290.645.75.422/figure-scanning-electron-microscope-image-human-blood-adapted.webp)
![Figure 4: RBCs deformation a) in vivo capillaries [10], b) by computational simulation [11], c) through narrow microchannels](https://thumb-eu.123doks.com/thumbv2/123dok_br/16862377.753725/4.892.238.702.142.393/figure-rbcs-deformation-capillaries-computational-simulation-narrow-microchannels.webp)
![Figure 7: Relative viscosity of blood at 25°C as a function of Hct compared to that of suspensions of rigid spheres (adapted from [14])](https://thumb-eu.123doks.com/thumbv2/123dok_br/16862377.753725/6.892.276.658.223.482/figure-relative-viscosity-function-compared-suspensions-spheres-adapted.webp)
![Figure 9: Relative apparent viscosity of in vitro blood through glass capillaries with diameters between 3.3 µ m and 800 µ m (adapted from [19, 21, 22])](https://thumb-eu.123doks.com/thumbv2/123dok_br/16862377.753725/7.892.229.713.375.796/figure-relative-apparent-viscosity-vitro-capillaries-diameters-adapted.webp)
![Fig. 12 shows typical motions for rigid and deformable particles [1, 24, 25].](https://thumb-eu.123doks.com/thumbv2/123dok_br/16862377.753725/9.892.300.652.353.667/fig-shows-typical-motions-rigid-deformable-particles.webp)