Mariana de Campos Quirino dos Santos
Ferreira
Licenciada em Ciências da Engenharia do Ambiente
Landscape composition and climatic
parameters significant in the spread of an
invasive species (Pine wood Nematode)
Dissertação para obtenção do Grau de Mestre em Engenharia do Ambiente
Orientador: Maria Teresa Calvão, Professor Doutor,
Faculdade de Ciências e Tecnologia da Universidade Nova
de Lisboa
Co-orientador: Carla Pimentel, Investigadora, Instituto
Superior de Agronomia
Júri:
Presidente: Prof. Doutora Maria Paula Oliveira Sobral, FCT-UNL
Arguente: Prof. Doutora Cristina Maria Filipe Máguas da Silva Hanson, Faculdade de Ciências da Universidade de Lisboa
Vogal: Prof. Doutora Maria Teresa Calvão Rodrigues, FCT-UNL
iii
Landscape composition and climatic parameters significant in the spread of an invasive
species (Pine wood Nematode)
Copyright © Mariana de Campos Quirino dos Santos Ferreira, FCT/UNL, UNL
v
Agradecimentos
Queria agradecer a todas a pessoas, família, amigos e professores que de forma directa ou indirecta contribuíram para o sucesso do meu percurso académico e para a minha tese.
À minha orientadora Professora Doutora Teresa Calvão que durante as suas aulas conseguiu mostrar entusiasmo e gosto por estes temas, mas por acima de tudo conseguir passar-me esse gosto. Pelo apoio, encorajamento e ensinamentos durante esta tese, mas acima de tudo pela paciência que teve perante as dúvidas e peripécias que foram surgindo. Sem a sua ajuda isto não teria sido possível.
À minha co-orientadora Doutora Carla Pimentel pelo conhecimento, entusiasmo e disponibilidade mostrada ao longo da dissertação e do tema.
Ao Pedro Moreno pelo trabalho na digitalização dos mapas de Solos e à Alexandra Ricardo e ao Paulo Firmino pela ajuda prestada no decorrer da dissertação.
Aos meus amigos pelo apoio, companheirismo e paciência demostrada ao longo destes anos de curso e outros ao longo desta longa amizade. Um obrigado à Maisa Chaves e à Joana Trindade que mesmo estando a milhas de distância sempre foram importantes e deram apoio ao longo da minha vida e na faculdade não foi excepção. Ao Miguel Tomás, Bruno Gomes e Daniela Alves que ajudaram a manter Moçambique sempre perto com os inúmeros almoços de “família” e musica.
Aos meus colegas Lurdes Brandão, Vânia Ferro, Pedro Lopes, Denise Forte e Luís Ferreira pela ajuda ao longo deste longo percurso académico repleto de testes e trabalhos, mas acima de tudo pela integração e pelo companheirismo que sempre tiveram comigo
Ao Francisco Ferreira e ao João Ribeiro (Potter) por ajudarem na transição de países, a adaptação à vida portuguesa, por terem feito a vida na residência divertida e cheia de boas memórias, mas principalmente pelo enorme apoio que me deram nos momentos mais difíceis. Obrigado por serem grandes amigos e praticamente família.
vi
oportunidade e por sempre encorajar e motivar o sucesso no ensino superior. Para além disso pelas lições de vida e pelos bons exemplos que me incutiu durante a minha vida e pelo apoio incondicional dado mesmo estando longe.
Um ultimo e não menos importante obrigado para o meu namorado António Gomes (Tojo) que tem sido um pilar ao longo deste anos todos, por todo o apoio, ajuda, encorajamento e principalmente pela paciência que muitas vezes foi necessária, mas principalmente neste percurso académico que teve bons e maus momentos.
The work was funded by the Portuguese Science Foundation (FCT) through the project
vii
Resumo
Diversos estudos mostram que o número de invasões biológicas tem aumentado, e que a dispersão destas espécies da sua área geográfica para outros locais está directamente relacionada com o aumento do transporte e movimento de pessoas e mercadorias. O nematode da madeira do Pinheiro (Bursaphelenchus xylophilus) (NMP), a causa da doença da murchidão dos pinheiros, é um bom exemplo de uma invasão biológica. Esta espécie é nativa da América do Norte, onde não causa efeitos negativos nos pinheiros, mas tem-se tornado um problema na Eurásia.
O objectivo desta dissertação é compreender se parâmetros ambientais estão a determinar a mortalidade dos pinheiros bravos numa área afectada pelo NMP. O local de estudo está situado na zona centro de Portugal, onde a presença do NMP foi confirmada em 2009. Esta área é complexa em termos de topografia e solos, o que influencia a complexidade do clima e das condições ecológicas, sendo por isso um local ideal para estudar a interacção dos parâmetros ambientais e uma invasão biológica. Para avaliar a zona, diversos parâmetros ambientais foram analisados com recurso a SIGs e adicionalmente determinada a percentagem de árvores recentemente mortas em locais de amostragem determinados aleatoriamente.
A regressão binária logística indicou que a temperatura nos trimestres mais quentes é o parâmetro que melhor determina a probabilidade de mortalidade. Tendo em conta que os atuais modelos de alterações climáticas prevêem um aumento futuro da temperatura, os resultados obtidos no presente trabalho apontam para que os danos causados pelo NMP piorem nos próximos anos por causa da maior susceptibilidade dos pinheiros nestas condições.
ix
Abstract
Studies show that the number of biological invasions has increased. The spread of species from their native range to other places is directly related to the increase in transport and movement of people and their goods. The Pine Wood Nematode (Bursaphelenchus xylophilus) (PWN), the causal agent of the pine wilt disease, is an example of this problem, originated from North America, has become a serious pest on Eurasia.
This dissertation aims to understand if environmental factors are determining tree mortality in an area where the PWN has been confirmed since 2009. The study area is located in the centreal part of Portugal, a complex area regarding the topography and soil making it also complex concerning climatic and ecological conditions, providing a good study case on the possible interaction between a biological invasion and local environmental conditions. In order to evaluate the study area several of environmental parameters were determined, and analyzed in GIS. Additionally it was determined the proportion of recently dead trees in randomly selected pine forests within the study area.
The Binary logistic model showed that temperature in the warm trimester was the only parameter that better predicted the mortality. Climate change models predict an increase in the temperature in the future, thus indicating that the susceptability of Pinus pinaster to the PWN will increase.
xi
Index
1. INTRODUCTION ... 1
1.1. Objective ... 1
1.2. Organization ... 2
2. LITERATURE REVIEW... 3
2.1. Biological Invasions ... 3
2.2. Forest Ecosystems... 4
2.3. The Pine wood Nematode ... 5
3. METHODS ... 9
3.1 Study area ... 9
3.2 Sampling design and data collection ... 18
3.3 Statistical analysis ... 24
4. RESULTS ... 27
5. DISCUSSION ... 35
6. CONCLUSIONS AND FUTURE WORK ... 37
xiii
Figure Index
Figure 1 - Invasion process model. [Source: Lockwood et al., 2007] ... 3
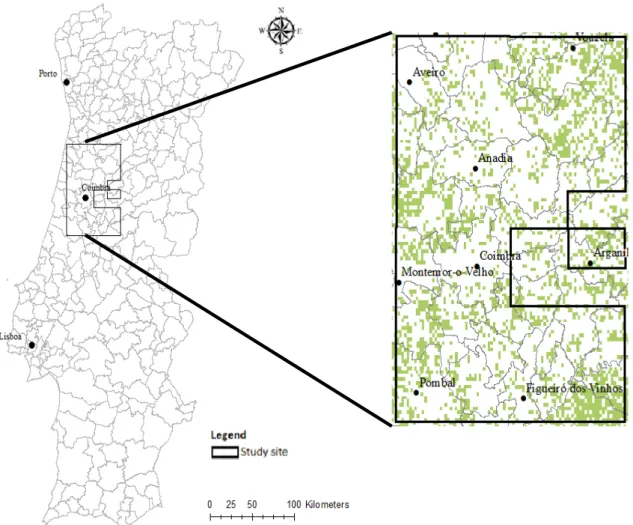
Figure 2 - Study area location (left) and Pinus pinaster distribution in the study area (right) [Fonte: Inventário Florestal Nacional (IFN)]. ... 9
Figure 3 – Altutude (m) in the study area. ... 10
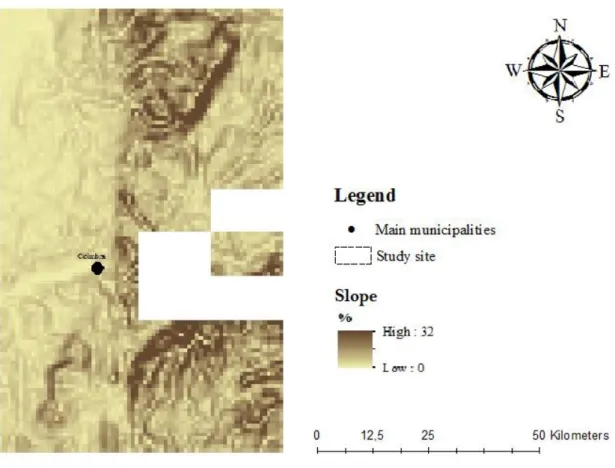
Figure 4 – Slope (%) in the study area. ... 11
Figure 5 - Mean Annual Precipitation (mm) in the study area. ... 12
Figure 6 - Mean annual Temperature (ºC) in the study area. ... 13
Figure 7 - Available Water Capacity (AWC) (mm) in the study area. The soil types found in the northwest area of the study area were not considered because there was no data for their AWC values. ... 14
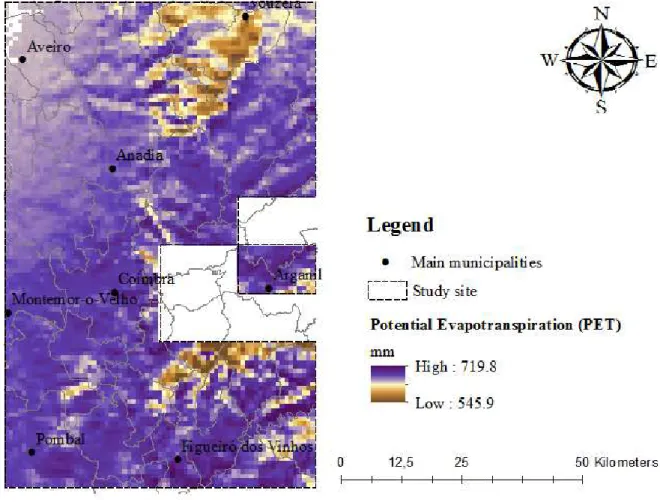
Figure 8 - Potential evapotranspiration (PET) (mm) of the study area. ... 15
Figure 9 – Actual evapotranspiration (AET) (mm) in the study area. Upper left corner of the study area has no values because of the AWC values that were used to generate this map. ... 16
Figure 10 – Climatic regions present in the study area. ... 17
Figure 11 - Soil textural triangle adapted to international limits of the granulometric fractions, by M.Pereira Gomes e A. Antunes da Silva. [Source: Costa, B., 1995]. ... 21
Figure 12 - Soil textural triangle adopted by the Department of Agriculture of the United States of America. [Source: Costa, B., 1995] ... 21
Figure 13 - Optical illusion created by the wedge prism when calculation basal area. ... 23
Figure 14 - Location of the sampling points. ... 24
Figure 15 - Percentage of mortality distribution along the study area... 27
xv
Table Index
Table 1 - Environmental parameters, resolution/scale, format, georeferencing system and source. ... 19
Table 2 - Pearson correlations between all pairs of parameters. P-values <0.01 A and 0.01<p<0.05 A..29
Table 3 – P-value for all environmental parameter at a significance level of 0.05. ... 30
Table 4 - Environmental parameters used in the Binary logistic regression model. ... 31
Table 5 - Omnibus Tests of Model Coefficients. ... 32
Table 6 - Variables in the equation after Backward likelihood ratio method. ... 33
xvii
Abbreviation List
AWC – Available Water Capacity
FAO – Food and Agriculture Organization GIS – Geographic Information System GPS – Global Positioning System IS – Intervention Sites
NFA – National Forestry Authority NFI5 – National Forestry Inventory PWN – Pine Wood Nematode RDP – Rural Development Program SAC – Spatial Autocorrelation UN – United Nations
1
1.
Introduction
Studies show that the number of species moved from their native range has increased, and this is mostly because of the increased transport and movement of people and their goods, taking species beyond their geographic boundary (Lockwood et al., 2007). With this comes an increase in the number of pest and invasive species that affect ecosystems worldwide (Campbell S., 2005). An example of this problem is the wilt disease caused by the Pine Wood Nematode (PWN) that has spread through Eurasia and has been confirmed in several countries that are geographically far away from each other, most likely due to the trade of forestry products (Futai, 2008).
To successfully protect plants and forests from biotic agents a coordinated international action is needed, due to the global dimension of this problem (FAO, 2011). The International Plant Protection Convention (IPPC) is an international agreement between countries to control pests and prevent their spread by implementing phytosanitary measures in order to ensure the quality of production and maintenance of ecosystem biodiversity, while permitting trade (FAO, 2011). Each country develops its national plant protection organization with phytosanitary measures that can be applied to forest products, prior, during and after import/export, measures that include inspections, different treatments and even quarantine (FAO, 2011). In Portugal the “Plano de Acção Nacional para o Controlo do Nemátodo da Madeira do Pinheiro” was implemented with several measures that would help manage and control this pest to ensure that it would not spread to other neighboring countries.
Even with all these measures the PWN has spread to other locations in Portugal, and to several other countries, indicating that more understanding and new ways to control this pest are necessary. In order to evaluate this problem, and more efficiently control it, it is crucial a good understanding of the factors involved in the invasive process and setting of the pine wilt disease, such as the biology of the pine host and the PWN, the environmental parameters that shape their ecosystem, and how these factors influence the mortality rate.
1.1.
Objective
2
1.2.
Organization
This dissertation is divided in seven parts. The first part addresses the increasing problem of biological invasions, the goals and the overall organization for this study.
The second part is a literature review focused on biological invasions, the way pests affect forests, how the pine wood nematode (PWN) acts, its geographical distribution and the effect it has had in Portugal.
The third part outlines the methodology that was adopted for the work and how data was collected and handled.
The fourth part presents the main results: some of the GIS maps generated from the different analysis as well as the statistical evaluation and models.
Then fifth part concentrates on the discussion of the results. In the sixth part conclusions are drawn on the viability of using GIS to detect and control pine wood nematode. The ideas of future work and the challenges faced during this study are also listed.
3
2.
Literature review
2.1.
Biological Invasions
According to Williamson (1996) a biological invasion is the process by which an organism arrives somewhere beyond its previous range. But just the arrival of these species doesn´t guaranty that the invasion will be successful, and on average only 10% of them are able to get established in their new environment.
The invasion process is complex and depends on several factors. In order to be successful, the non-native species must pass at least three stages before they are able to inflict ecological or economic harm (Figure 1; Lockwood et al., 2007) and while passing these stages they will have to overcome several ecological barriers (Williamson, 1996).
The invasion process starts with an individual that is transported from its native range to another location and then released. After this the non-native species must establish a self-sustaining population or they will become extinct. If they establish a viable population they must grow in abundance and expand their geographic range, otherwise they will have a local distribution with a low and stable population level. When the non-native species becomes widespread and abundant and causes ecological or economic impacts it is considered invasive (Lockwood et al., 2007).
This biological invasion depends on a transport vector, the manner in which a species is carried along, and a pathway, the rout between the native region and the location of release (Lockwood et al., 2007). Humans play a big role in the transport of these non-native species and
4
are thus considered a transport vector, either introducing them intentionally (domestic animals and ornamental plants) or unintentionally (byproduct of the movement of other goods) (FAO, 2011).
The type of invasive species also has an influence in the effects it produces on the ecosystem. They have been defined as drivers or passengers but Bauer (2012) suggests a new definition: back-seat drivers. While drivers are the direct cause of the decline of native species and alter the ecosystem (MacDougall & Turkington, 2005) and passengers are a symptom of a problem in the ecosystem, back-seat drivers act synergistically with ecosystem change (Bauer, 2012).
2.2.
Forest Ecosystems
Forests cover one third of the Earth’s land mass but are disappearing at an alarming rate
(UNEP, 2011), from 2001 through 2010 about 40 million hectares of primary forests were lost (FAO, 2010). Like in other countries, the Portuguese landscape has been altered along the years, due to the expansion of cities and human activities. In 2012 Portugal’s forests were about 3 564
hectares, 30% of which were pine tree forests (INE, 2012).
Pinus pinaster is the pine species most affected by the PWN in Portugal (Goncalves 2014). It is distributed throughout the Portugal, from the North (Minho and Trans-os-Montes) to the Setúbal Peninsula (Forey 1996).It occurs in areas with mean annual temperatures that range between 14-15 ° C, with an absolute minimum temperature of 15 ° C and maximum of 40 ° C, and with a mean annual precipitation of 800 mm, with at least 100 mm in the summer (Alves, 1988). It is resistant to drought (Gonzalez, 1995), but very sensitive to spring frost (Oliveira, 2000). In Portugal it is rarely found in an altitude above 800 mm, due to snow fall (Loureiro, 1993), but it can be found in 900-1000 mm of altitude in oceanic climates and 700 mm in continental climate (Alves, 1988).
Forests are complex ecosystems that provide a series of services, denominated by the United Nations 2004 Millennium Ecosystem Assessment (MEA) as ecosystem services (UNEP, 2011), like carbon sequestration, that have economic benefits (FAO, 2011). But throughout the years there has been an increase not only in their destruction but also in the emergence of numerous pests and invasive species that have negative effects when introduced (FAO, 2011; Lockwood et al., 2007), causing economic and ecological problems (Mooney et al., 2005), such as the loss of native species and ecosystem services (Lockwood et al., 2007).
5 degradation of forest ecosystems around the globe. It is estimated that outbreaks of forest insects can damage 35 million hectares of forests annually (FAO, 2010a).
The forest sector is very important to the Portuguese economy (Webster & Mota, 2008) and the PWN has a direct effect on the value of the goods provided by forests. There is no data that
relates the amount of money “lost” due to infected pine trees but it has been evaluated that from2001 to 2009 Portugal spent a total of 24 million euros to control the PWN. Other countries like Japan, where the PWN was first introduced as an invasive species 100 years ago, spend 10 million a year (FAO 2010, FAO 2011) to control the pest, without any hope of eradication, which illustrates the potential economic impact of this species.
2.3.
The Pine wood Nematode
The Pine wood Nematode (PWN) Bursaphelenchus xylophilus (Steiner & Buhrer, 1934) is the causal agent of the pine wilting disease (Mamiya, 1983). It is considered a threat to the pine wood forests for not only causing significant mortality, due to its high growth and spreading rate, but also because it devreases the commercial value of the trees (Webster & Mota, 2008). This disease was first reported in 1905 in south Japan, and in time it spread to most of the Japanese territory (Mamiya 1988, Futai, 2008). However, the causal agent, the PWN, was only discovered later in 1971 (Zhao et al., 2008). In 1979 the PWN was detected in the United States of America and then in 1983 in Canada. Further studies showed that this nematode is native to North America thus not affecting the native pine species. Because of this, it was possible to conclude that the PWN was introduced from North America to Asia (FAO, 2010a). In 1982/83 the PWN was detected in China and in Taiwan (Zhao, 2008) and later in 1988 it was discovered in South Korea (Shin, 2008). In Europe it was firstly reported in Portugal in 1999, in P. pinaster located on the Setúbal Peninsula (Mota et al., 1999; Mota & Vieira, 2008).
Despite several attempts to prevent the dispersal of the disease, in 2008 it was considered spread to all the country, and the Portuguese territory was considered a “Restriction Zone”
(Autoridade Florestal Nacional, 2013). In 2009 it was detected in the Madeira Island (Vicente et al., 2012), and in 2011, in the Galiza - Spain, becoming a real threat to European Pine forests (Vicente et al., 2012).
6
the genus Monochamus. The PWN can associate with different species of Monochamus, but in Portugal the only known vector is Monochamus galloprovincialis(Oliver) (Sousa et al., 2001).
The PWN life cycle is divided in a propagative and a dispersal cycle (Wingfield et al., 1981). The propagative cycle happens in the resin canals (Mamiya, Y. & Kiyohara, T., 1972) of the infected trees and takes 4 to 5 days, in optimal conditions (Ishibashi & Kondo, 1977). The dispersal cycle occurs when the PWN larvae move to the respiratory system of the vector (FAO, 2007) and it emerges from dead trees, in May or June (Mamiya and Enda 1972). The beetle then transmits the nematode either when it feeds on shoots of healthy pine (primary transmission), or when the female lays eggs in freshly cut timber or in a dying tree (oviposition) (FAO, 2007). In the case of transmission by feeding, infected tree starts to show the symptoms of the disease, like the decrease in oleoresin flow and arrest of transpiration, two and four weeks after the infection, respectively. After this the trees become chlorotic and die in approximately 3 months (Mamiya, 1976). The dead tree will now attract mature cerambycid beetles that will use it to deposit their eggs, restarting the cycle between the two (Wingfield et al., 1981).
Several countries around the globe implemented ways to manage and control the PWN. The European Union, including Portugal, started to implement rules in order to prevent the propagation of this pest in the affected countries, as well as preventing spreading to other countries (Autoridade Florestal Nacional, 2012). In order to control this invasive species, the Ministério da Agricultura, Mar, Ambiente e Ordenamento do Território, and the National Forestry Authority (NFA), have come up with a series of measures to help protect and minimize the dispersal risk, while maintaining viable forestry activity (Autoridade Florestal Nacional, 2012). This includes awareness campaigns about phytosanitary measures dictating the cut, process, handle and transport of wood in the affected areas. Complementary to this there is a regular monitoring of coniferous trees with symptoms of decay and also tree sampling. These operations are determined by the National Forestry Inventory (NFI5), in order to understand the dispersal of the PWN (Autoridade Florestal Nacional, 2012). Additionally a buffer zone of 20 km was established along the border with Spain, to prevent the spread of the PWN to other EU member-states (Autoridade Florestal Nacional, 2012).
7 found to be disease free, contributing to the increase in the numbers of sites along the years. (Autoridade Florestal Nacional, 2012).
9
3.
Methods
3.1 Study area
The study area chosen for this dissertation is located in the central part of Portugal and has an area of 5 632 km2 (Figure 2). This area was selected because the PWN was detected here, starting
in 2008 (Vicent et al. 2008) and preliminary surveys pointed to significant mortality of the P.pinaster forests. This is a complex area as regards to topography and soil type. The large variability in altitude promotes variations, within short distances, in slope, aspect, rain, shading and exposure to wind. Thus, it is a complex area as regards to micro-climatic and ecological conditions.
Figure 2 - Study area location (left) and Pinus pinaster distribution in the study area (right) [Fonte:
10
Altitude of the study area varies between 0 m and 1203 m (Figure 3), lower values found on the western part of the study stite and higher values in the east.
11 Slope in the study area (Figure 4) varies between flat areas and around 32% in mountainous areas (Figure 4).
12
Annual precipitation (Figure 5) varies from 855 mm in the south west to 1522 mm in the eastern mountainous areas, especially in the northeast.
13 Average annual temperature (Figure 6) varies from 8 ºC in the East to 14 ºC in the southwest, near Coimbra. It reaches a maximum (23.2 º C) in August and minimum (4.6 º C) in January.
14
Available Water Capacity (AWC) (Figure 7) ranges from 0 mm to 1034 mm and has a complex variation in the study area because it depends on the soil type.
15 Potential evapotranspiration (PET) (Figure 8) varies from 545.9 mm to 719.8 mm. The lowest values are found in the higher altitudes and highest values in the southwest part of the study area.
16
Actual Evapotranspiration (AET) (Figure 9) ranges from 410 mm in eastern mountainous areas to 650 mm in western flat areas.
17 The climatic conditions in the study area are very important factors because they can affect the conditions of the pine trees and thus their susceptibility to disease and pests such as the PWN. In the study are different types of climate are felt (Figure 10).
Figure 10 – Climatic regions present in the study area.
18
3.2 Sampling design and data collection
The development of the PWN and the incidence and severity of the wilting disease depend on the environmental conditions. To evaluate the parameters in the study area and the relationship between them a series of maps and in situ observations of the mortality were needed.
Environmental parameters
19
Table 1 - Environmental parameters, resolution/scale, format, georeferencing system and source.
Variable Spatial
Resolution/scale Format
Georeferencing
System Source
Annual Precipitation
(Prec) 1-Km Raster Datum WGS-1984, latitude/longitude Worldclim Precipitation in the humid
trimester (Prec_humid) 1-Km Raster Datum WGS-1984, latitude/longitude Worldclim Precipitation in the dry
trimester (Prec_dry) 1-Km Raster Datum WGS-1984, latitude/longitude Worldclim Precipitation in the warm
trimester (Prec_warm) 1-Km Raster Datum WGS-1984, latitude/longitude Worldclim Precipitation in the cold
trimester (Prec_cold) 1-Km Raster Datum WGS-1984, latitude/longitude Worldclim Annual Temperature
(Temp) 1-Km Raster Datum WGS-1984, latitude/longitude Worldclim Temperature in the humid
trimester (Temp_humid) 1-Km Raster Datum WGS-1984, latitude/longitude Worldclim Temperature in the dry
trimester (Temp_dry) 1-Km Raster Datum WGS-1984, latitude/longitude Worldclim Temperature in the warm
trimester (Temp_warm) 1-Km Raster Datum WGS-1984, latitude/longitude Worldclim Temperature in the cold
trimester (Temp_cold) 1-Km Raster Datum WGS-1984, latitude/longitude Worldclim Soil type 1/25 000 Vectorial Lisboa Hayford Gauss Igeoe CNROA SROA/
Altitude (Alt) 1-Km Raster Datum WGS-1984, latitude/longitude Calculated
Radiation (Rad) 1-Km Raster Datum WGS-1984, latitude/longitude Calculated
Slope 1-Km Raster Datum WGS-1984, latitude/longitude Calculated Available Water Capacity
(AWC) 1-Km Raster Datum WGS-1984, latitude/longitude Calculated Potential
Evapotranspiration
(PET) 1-Km Raster
Datum WGS-1984,
latitude/longitude Calculated Moisture
“supply-demand” (PE) 1-Km Raster Datum WGS-1984, latitude/longitude Calculated Actual
Evapotranspiration
(AET) 1-Km Raster
Datum WGS-1984,
latitude/longitude Calculated
20
have soil maps due to the fact that they were never published. Thus, in the maps presented in this study some white rectangular areas can be seen that correspond to missing information.
In total 17 maps were produced for each environmental parameters, and all of these were transformed to the European Terrestrial Reference System 1989 (ETRS 89), an European Union recommended frame of reference for geodata for Europe.
Available water capacity (AWC) expresses the quantity of water present in the soil available to plants (Costa, 1995). It is an important edaphic factor because it influences site water balance, which in turn affects plant activity. Thus it is a critical parameter that needs to be determined in the context of ecological studies. However this parameter was not originally included in the soil maps and in order to generate AWC data several procedures were followed. First all the soil families represented in the study area were identified, 223 families were accounted for.
Then soil texture was evaluated because it determines the relative capacity of soil to hold water that is available for uptake by plants. Texture can be assessed through data from the different soil particle-size classes (sand, silt, and clay) (Costa, 1995). Information regarding the fraction of the different soil particle-size classes of the various soil horizons was obtained for these families, mainly from Cardoso (1965). Since Cardoso (1965) did not have information regarding all the families, the textural class for several soil families was retrieved from the DGADR website (http://www.dgadr.mamaot.pt/nota-explicativa). Even after this literature review information for 58 families of soil was not found and subsequently the corresponding areas were considered as No Data.
21
Figure 11 - Soil textural triangle adapted to international limits of the granulometric fractions, by M.Pereira Gomes e A. Antunes da Silva. [Source: Costa, B., 1995].
22
AWC was determined for each horizon of the different soil families using a table by Allen et al. (1998; 2007) which relates texture class with soil water content. To determine final AWC for a given soil family AWC values for the different horizons were summed. AWC calculation in cases where more than one family of soil was present was based on the representativeness of the different families. Final soil AWC value was determined for a depth of 0-150 cm because, in general, pine trees have deep roots. All soil maps were converted into raster format for further processing.
Dyer (2009) developed the Water Balance Tool that enables the calculation of evapotranspiration and moisture stress using climatic, topographic and edaphic data in a GIS. This model runs as a Toolbox in ArcGis with maps in raster format.
Firstly the model calculates potential evapotranspiration (PET), a measure of moisture demand, which is the amount of water that can be evaporated and transpired from a vegetated surface if water is not a limiting factor. The model uses the Turc method (Equation 1) where PET is the monthly potential evapotranspiration in mm, T represents the mean monthly temperature in ºC, and Rs indicates monthly global radiation received at the earth’s surface, in cal/cm-2.
[( )] ( ) Equation 1
PET maps were produced for each month of the year. These maps enable the calculation of the
moisture “supply-demand” (P-PE) maps that compare the PET values with the respective precipitation for each month. Positive values mean precipitation is enough to meet the plants moisture needs and the negative values indicate that the plants use the soil moisture to meet their needs (Dyer, 2013).
The next step consists in the calculation of the soil moisture storage (monthly values, representing storage on the last day of the month) by dividing monthly values by the number of days in the month (Dyer, 2013). In this part of the model the soil AWC maps are used as input.
23
Field surveys
In order to evaluate maritime pine tree (Pinus pinaster) mortality in the study area a set of points for field survey evaluation were randomly generated with the help of ArcGis. Field surveys were conducted from July to December 2013. In each sampling point total basal area and basal area of dead standing trees were measured, at three spots along a 200 m transect, with the help of an English BAF 10x wedge prism. The wedge prism is used to scan along the basal area. It refracts the light at a specific offset angle creating an optical illusion of the tree trunk (Figure 13).
Figure 13 - Optical illusion created by the wedge prism when calculation basal area.
If the offset portion of the trunk viewed through the prism appears connected to the main trunk of the tree, then it is countable, if it appears to be borderline it counts as half a tree and if it looks completely away from the main trunk it is not countable. It is then necessary to multiply the total number of trees by the basal area factor of the prism, in this case 10. Tree mortality was calculated as the proportion of dead standing basal area over the total basal area.
24
Figure 14 - Location of the sampling points.
3.3 Statistical analysis
Univariate Moran’s I index, that indicates the statistical significance of spatial autocorrelation
(SAC), was calculated for all parameters in the study area. It was considered to occur SAC when the p-values were lower than 0.05 and the z-scores were higher than 1.96 (Vu et al., 2014). Positive Moran’s I index values for small distances and negative values for longer distances also indicate
the existence of SAC. This index was computed in IDRISI software for all the raster images corresponding to the different parameters.
25 The parameter percentage of mortality was not normally distributed and could not be normalized, and therefore could not be used for statistical analysis. Thus a Binary logistic regression was used with a binary parameter presence/absence of mortality as the dependent variable.
Then logistic binary regression models were developed to evaluate the relationship between the response variable, mortality, expressed as 1 for presence and 0 for absence, and its predictors, the 17 environmental parameters (independent variables). The logistic model is more suitable to explain presence/absence data (Augustin et al, 1996), because it combines the independent variables to estimate the probability of an event, in this case mortality (Equation 2).
( ) Equation 2
Where p is the probability of the event and varies between 0 and 1.
In computing the logistic regression the Backward Likelihood method was used in SPSS because it eliminates step by step the parameter with the highest p-value until only the significant and better fit remains to determine mortality.
27
4.
Results
With the values of the percentage of tree mortality observed in the sampling plots a map was generated to help visualize the distribution of this data (Figure 15).
Figure 15 - Percentage of mortality distribution along the study area.
Spatial autocorrelation
Univariate Moran’s I index values indicated that all parameters exhibit z-scores higher than 2.58, indicating a clustered pattern and a significant positive spatial autocorrelation at 95% level.
28
Pearson Correlation
29
Table 2 - Pearson correlations between all pairs of parameters. P-values <0.01 A and 0.01<p<0.05 A.
Variable 1 2 3 4 5 6 7 8 9 10 11 12 13 14 15 16 17 18
1 Mortality 1.00
2 Altitude -.136 1.00
3 Radiation -.188 .733 1.00
4 Slope -.152 .668 .501 1.00
5 Annual Temperature .213 -.949 -.740 -.679 1.00
6 Temperature in the cold
trimester .108 -.971 -.759 -.680 .961 1.00 7 Temperature in the warm
trimester .358 -.624 -.497 -.511 .816 .636 1.00 8 Temperature in the humid
trimester .052 -.967 -.736 -.646 .911 .975 .524 1.00 9 Temperature in the dry
trimester .358 -.595 -.480 -.481 .792 .603 .997 .491 1.00 10 Annual Precipitation -.150 .907 .725 .689 -.972 -.962 -.775 -.899 -.749 1.00
11 Precipitation in the cold
trimester -.141 .937 .738 .695 -.982 -.978 -.759 -.925 -.732 .997 1.00 12 Precipitation in the warm
trimester -.166 .601 .540 .552 -.771 -.725 -.765 -.611 -.752 .875 .832 1.00 13 Precipitation in the humid
trimester -.164 .926 .735 .691 -.983 -.971 -.779 -.912 -.753 .998 .999 .848 1.00 14 Precipitation in the dry
trimester -.084 .819 .672 .655 -.902 -.902 -.729 -.832 -.708 .974 .957 .938 .960 1.00 15 AWC -.182 -.061 -.157 -.015 .049 .070 -.028 .101 -.026 -.034 -.044 .001 -.038 -.059 1.00
16 PET .240 -.684 -.302 -.533 .775 .688 .760 .625 .743 -.749 -.746 -.644 -.753 -.684 -.133 1.00
17 PE -.169 .895 .683 .653 -.965 -.946 -.792 -.880 -.767 .994 .988 .882 .991 .970 -.020 -.782 1.00
30
Logistic regression
A preliminary binary model was run with all 17 independent parameters in order to determine if any parameter was significant with mortality. Only Temperature in the warm trimester and Temperature in the dry trimester are significant at a significance level of 0.05 (Table 3).
Table 3 – P-value for all environmental parameter at a significance level of 0.05.
Environmental
Parameters p-value
Altitude 0.33
Radiation 0.18
Slope 0.28
Annual Temperature 0.13 Temperature in the cold
trimester 0.44
Temperature in the warm
trimester 0.01
Temperature in the humid
trimester 0.71
Temperature in the dry
trimester 0.01
Annual Precipitation 0.28 Precipitation in the cold
trimester 0.31
Precipitation in the warm
trimester 0.24
Precipitation in the humid
trimester 0.24
Precipitation in the dry
trimester 0.55
Available water capacity
(AWC) 0.19
Potential
evapotranspiration (PET) 0.09 Moisture “supply
-demand” (PE) 0.23
Actual evapotranspiration
(AET) 0.63
31
coefficients (more than 90%) with more than one parameter were excluded until only
parameters with no high correlation were left. Nine environmental parameters were
eliminated in the following order: Annual Precipitation, Temperature in the dry trimester,
Precipitation in the humid trimester, Mean annual Temperature, Altitude, Precipitation in
the cold trimes
ter, Temperature in the cold trimester, Moisture “supply
-
demand” (PE) and
Precipitation in the dry trimester.
Only eight parameters remained as input to the binary logistic (
Table 4).
Table 4 - Environmental parameters used in the Binary logistic regression model.Environmental Parameters
Radiation Slope
Temperature in the warm trimester Temperature in the humid trimester
Precipitation in the warm trimester Available water capacity (AWC) Potential evapotranspiration (PET)
Actual evapotranspiration (AET)
With the eight remaining parameters a binary logistic model using the stepwise Backward likelihood method was developed to evaluate which combination revealed the best fit for the determination of the mortality in the maritime pine trees. In this method the first Step (Step 1) includes all independent parameters than in each Step the model progressively excludes the parameter with the highest value of p-value until the parameters left are all significant at a significance level of 0.05.
32
Table 5 - Omnibus Tests of Model Coefficients.
Step Environmental parameters
included Chi-square df Sig (p-value)
Step 1
Radiation Slope
Temperature in the warm trimester
Temperature in the humid trimester
Precipitation in the warm trimester
AWC PET AET Constant
14.918 8 0.061
14.918 8 0.061
14.918 8 0.061
Step 2
Radiation Slope
Temperature in the warm trimester
Temperature in the humid trimester
Precipitation in the warm trimester
AWC PET Constant
-0.235 1 0.628
14.683 7 0.040
14.683 7 0.040
Step 3
Radiation
Temperature in the warm trimester
Temperature in the humid trimester
Precipitation in the warm trimester
AWC PET Constant
-1.129 1 0.288
13.554 6 0.035
13.554 6 0.035
Step 4
Radiation
Temperature in the warm trimester
Temperature in the humid trimester
Precipitation in the warm trimester
AWC Constant
-.751 1 0.386
12.803 5 0.025
12.803 5 0.025
Step 5
Radiation
Temperature in the warm trimester
Temperature in the humid trimester
AWC
33 Constant
Step 6
Temperature in the warm trimester
Temperature in the humid trimester
AWC Constant
-1.798 1 0.180 9.750 3 0.021 9.750 3 0.021
Step 7
Temperature in the warm trimester
AWC Constant
-.941 1 0.332 8.809 2 0.012 8.809 2 0.012 Step 8
Temperature in the warm trimester
Constant
-1.889 1 0.169 6.920 1 0.009 6.920 1 0.009
The new model, Step 8, which only includes the temperature in the warm trimester, has a significantly reduced Chi-square compared to Step 1. This indicates that the new model is better at predicting the dependent variable and is statistically significant (p < 0.05).
The best binary logistic model for mortality estimation included only one independent parameter, temperature in the warm trimester (Table 6).
Table 6 - Variables in the equation after Backward likelihood ratio method.
Environmental
Parameters B S.E Wald df p-value Exp(B)
Temperature in the warm
trimester
0.850 0.359 5.619 1 .018 2.340
Constant -17.274 7.392 5.461 1 .019 0.000
The values indicate that Temperature in the warm trimester is statistically significant (p-value <0.05) and therefore there is statistical evidence that it contributed to the increase of mortality. The S.E. indicates how stable the estimated coefficient is, where high values mean that the coefficient is not well estimated and low values mean a fairly precise estimate. In this case Temperature in the warm trimester was well estimated.
The equation for the best fit model to determine probability of mortality of the maritime pine trees observed in the study is:
34
According to SPSS calculations this equation can predict 66.7% of the mortality, which is
more than the 54.9% in the “null model”, the model without environmental parameters involved.
That is, the model does better than chance at predicting mortality.
To measure the goodness-of-fit of the binary logistic model a Receiver Operating Characteristic (ROC) statistics needs to be calculated to validate the model (Figure 16; Table 7).
Figure 16 - ROC curve for the better fit model.
In order to evaluate if the parameters generated in the better fit model are good in predicting the maritime pine mortality, the area under the curve needs to be analyzed (Table 7).
Table 7 - Area Under the curve Results (Predicted probability).
Test Result Variable(s): Predicted probability
Area Under
the Curve
Std.
Errora Asymptotic Sig.b
Asymptotic 95% Confidence Interval
Lower
Bound Upper Bound
0.685 0.078 0.024 0.531 0.838
a. Under the nonparametric assumption
b. Null hypothesis: true area = 0.5
35
5.
Discussion
The results showed that only one parameter, Temperature in the warm trimester, was significant and can be used to predict the outcome of mortality by 66.7%. This confirmed that the methodology applied was suitable not only to predict the outcome better than by chance but also to increase the correct classification of infected sites.
The importance of spatial autocorrelation in the outcome of statistical analyses has generated different opinions. Some authors defend that spatial autocorrelations needs to be removed as it accounts for values that may be influencing the prediction model (Dormann et al, 2007) and inducing pseudoreplication (Hurlbert, 1984; Legendre, 1993). To deal with this problem, several methods have been developed to correct the effects of spatial autocorrelation, such as 1) Autocovariate regression; 2) Spatial eigenvector mapping (SEVM); 3) Generalized least squares (GLS); 4) Conditional autoregressive models (CAR); 5) Simultaneous autoregressive models (SAR); 6) Generalized linear mixed models (GLMM); and 7) Generalized estimation equations (GEE) (Dormann et al, 2007). The problem with these methods is that most of them use normally distributed data and the ones suitable for binary data showed different patterns when applied (Dormann et al, 2007), not reassuring that the elimination of the spatial autocorrelation improves the outcome. Other authors defend that spatial autocorrelation is ecologically significant, and if removed may omit important and relevant information in these type of studies such as ecological processes (Dormann, 2007; Austin, 2002). Dormann (2007) states that based on currently available evidence, spatial autocorrelation is relevant across all groups of organisms and all spatial scales and contains information one might not want to "correct for" (Dorman, 2007).
The results of the spatial autocorrelation analysis showed that all maps had a positive spatial autocorrelation. This might be due to the fact that environmental parameters, such as temperature, exhibit spatial autocorrelation because there is a higher probability of locations closer to each other (neighboring locations) to have similar conditions than places further apart (Cliff & Orde, 1973), and that the environmental factors can limit the dispersion of the organisms (Austin, 2002; Epperson, 2005; Karst et al., 2005; Lloyd et al., 2005; Jones et al., 2006; quoted in Dormann, 2007; Dormann et al., 2007).
36
In previous studies performed with trees in greenhouses, temperature has shown to be relevant, and that in high temperatures (25-30 °C) the decline of the infected tree is accelerated (Mendes, 2012; Colwell, 2013). In this study the outcome is in agreement with these studies and highlights that temperature is in fact an important parameter for tree mortality. In the Mediterranean climate the warmest trimester coincides with the driest one and is associated with the months of lower precipitation (Colwell, 2013). Even though the model only included temperature, this parameter might influence other parameters such as precipitation.
The increase of temperature will contribute to the acceleration of the decline of the tree especially when associated with a low water content. On the other hand, this increase provides better conditions for the development of the PWN and its vector.
From the results of this study it is not possible to know exactly if the mortality occurs from the decline of the vitality of the tree or if it is directly related to the PWN. However the results show that temperature is an important parameter in the mortality of the tree and therefore should be explored in future studies.
This study also indicates that temperature alone can be used to estimate the probability of mortality, which is an advantage to any study since it is widely available as it is measured in all weather stations. The only problem with this parameter is that the data is not recent and may not portray the present.
37
6.
Conclusions and future work
This study highlights the importance of high temperatures in the death of the pine trees associated with the PWN and it was possible to prove that in real conditions the parameter that influences the mortality the most is the same that was found in studies done in controlled situations.
The introduction of this parameter in the model decreases the errors associated with the determination of the mortality and demonstrates that the methods used are useful and can be used in other places to determine mortality and help assist the ongoing inspection of the spread of the disease.
Knowing that climate change will increase the temperature, the dispersion of this PWN to other areas that have not been infected, due to the absence of the optimal conditions for the settling of PWN, is a possibility.
As part of the climate change scenarios, the results are important since they allow to easily obtain values of probability of mortality.
Limitations and future work
The lack of information available about the exact places and the quantity of PWN found in each intervention site (IS) made it hard to compare the relationship of the data with the actual PWN. The fact that only the mortality basal area was evaluated and that it was not possible to collect samples from the sampling plots to classify if the death of the tree was due to the presence of the PWN, making it difficult to identify the true cause of the tree decay.
The soil data presented some limitations due to the lack of data or the different types of soil. This was an issue in the computation of several parameters in the Water Balance Toolbox, because some of them required the soil map, leading to the exclusion of these areas.
38
The determination of the effect that climate change will have on the dispersion of the PWN, due to the increase of the vulnerability of the pine forests, and how it will affect the mortality rate.
39
7.
References
Allen, C. D., Macalady, A.K., Chenchouni, H., Bachelet, D., McDowell, N., Vennetier, M., Kitzberger, T., Rigling, A., Breshearsi, D.D., et al. (2010), A global overview of drought and heat-induced tree mortality reveals emerging climate change risks for forests, Forest Ecology Management, 259:660–684;
Allen, R.G., Pereira, L.S., Raes, D., Smith, M. (1998), Crop Evapotranspiration, Guidelines for Computing Crop Water Requirements, FAO Irrigation and Drainage Paper 56, FAO, Rome, Italy;
Allen, R.G., Wright, J.L., Pruitt, W.O., Pereira, L.S., Jensen, M.E. (2007), Water Requirements. In: Hoffman, G.J., Evans, R.G., Jensen, M.E., Martin, D.L., Elliot, R.L. (eds.) Design and Operation of Farm Irrigation Systems (2nd Edition), ASABE, St. Joseph, MI, 208-288;
Alves, A.A.M. (1988), Técnicas de Produção Florestal, Instituto Nacional de Investigação Científica, 2ª Edição, Lisboa, Portugal;
Augustin, N.H., Mugglestone, M.A. & Buckland, D.T. (1996), An autologistic model for spatial distribution of wildlife, Journal of Applied Ecology, 33: 339-347;
Austin, M.P. (2002), Spatial prediction of species distribution: an interface between ecological theory and statistical modelling, Ecological Modelling, 157: 101–118;
Mendes, A.R.A (2012), Avaliação das condições ambientais que contribuem para o estabelecimento do nematode da madeira do pinheiro (Bursaphelenchus Xylophilus), Dissertação, Departamento de Biologia Animal, Faculdade de Ciências da Universidade de Lisboa;
Autoridade Florestal Nacional (2012), Nematode da Madeira do Pinheiro – Actividades realizadas no âmbito do seu controlo: Ações de prospecção, Amostragem erradicação e sensibilização, realizadas no Plano de acção e controlo do Nematode da Madeira do Pinheiro;
Autoridade Florestal Nacional (2013), Plano de ação nacional para o controlo do NMP – Plano de acção nacional para o controlo do Nematode da Madeira do Pinheiro para o período de 2013-2017;
40
Campbell S. (2005), A global perspective on forest invasive species: the problem, causes, and consequences. In: The unwelcome guests, Proceedings of the Asia-Pacific Forest Invasive Species Conference, Asia-Pacific Forestry Commission;
Cardoso, J. V. C. (1965), Os solos de Portugal - sua classificação, caracterização e génese - 1- A sul do rio Tejo, Secretaria de estado da agricultura, Direcção-Geral dos Serviços Agrícolas;
Cliff, A.D. & Ord, J.K. (1973), Spatial autocorrelation, Pion Limited, London
Colwell, F.J (2013), A influência do stress hídrico e da eutrofização do solo na doença da murchidão do pinheiro, Dissertação de Mestrado em Biologia da Conservação, Departamento de Biologia Animal, Faculdade de Ciências da Universidade de Lisboa;
Costa, J.B. (1975), Caracterização e Constituição do solo, Fundação Calouste Gulbenkian, Edição, Lisboa;
Dormann, C.F. (2007), Effects of incorporation spatial autocorrelation into the analysis of species distribution data, Global Ecology and Biogeography, 16: 129-138;
Dormann, C.F., McPherson, J.M., Araújo, M.B., Bivand, R., Bolliger, J., Carl, G., Davies, R.G., Hirzel, A., Jetz, W., Kissling, W.D., Kǖhn, I., Ohlemǖller, R., Prese-Neto, P.R., Reineking, B., Schrooder, B., Schurr, F.M. & Wilson, R. (2007), Methods to account for spatial autocorrelation in the analysis of species distributional data: a review, Ecography, 30:609-628. DOI: 10.1111/j.2007.0906-7590.05171.x
Dyer, J.M. (2009), Accessing topographic patterns in moisture use and stress using a water balance approach, Landscape Ecology, 24: 391-403. DOI: 10.1007/s10980-008-9316-6;
Dyer, J.M (2013), User’s Guide for Water Balance Toolbox (v.2) for ArcGis, Department of Geography, Ohio University;
FAO (2007), Newsletter of the Asia-Pacific Forest Invasive Species Network (APFISN), 8. Available at: http://apfisn.net/sites/default/files/feb07.pdf;
FAO (2010), Global Forest Resources Assessment 2010, United Nations Food and Agriculture Organization. Available at: http://www.fao.org/docrep/013/i1757e/i1757e.pdf;
41 FAO (2011), Guide to implementation of phytosanitary standards in forestry, FAO forestry paper, No 164 In: FAO Forestry Department;
Forey, P. (1996), "Árvores", colecção "Pequenos Guias da Natureza", Plátano Edições Técnicas, Lisboa, 106;
Futai, K. (2008), Pine Wilt in Japan: From First Incidence to the Present. In: Zhao, B.G., Futai, K., Sutherland, J.R. & Takeucchi, eds. Pine Wilt disease, Springer Japan, 5-12;
Gonçalves, E.V.P (2014), Avaliação da resistência de espécies de Pinus Bursaphelenchus xylophilus pela análise de fitoquímicos, Dissertação de Mestrado em Biologia da Conservação, Departamento de Biologia Animal, Faculdade de Ciências da Universidade de Lisboa;
Gonzalez, L. G. (1995), La Guia de Incafo de los Arboles y Arbustos de la Peninsula Iberica, 6ª edición, Madrid, Spain
Hurlbert, S.H. (1984), Pseudoreplication and the design of ecological experiments, Ecological Monographs, 54: 187–211;
Instituto Nacional de Estatística (INE) (2012), Estatísticas Agrícolas 2011, Lisboa;
Ishibashi, N. and Kondo, E. (1977), Occurrence and survival of the dispersal of the pine wood nematode, Bursaphelenchus lignicolus Mamiya and Kyohara, Applied Entomology and Zoology, 12: 293-302;
Legendre, P. (1993), Spatial autocorrelation: trouble or new paradigm?, Ecology, 74: 1659– 1673.
Lockwood J. L., Hoopes M. F. & Marchetti M. P. (2007), Invasion Ecology, Blackwell Publishing Ltd;
Loureiro, A. (1993), A Floresta de Portugal e a CE, IV Jornadas Luso-Galaicas de Ciência e Desenvolvimento, UTAD/RAGC, Vila Real, 16;
MacDougall, A.S & Turkington, R. (2005), Are invasive species the drivers or passengers of change in degraded ecosystems?, Ecology, 86: 42-55. DOI: 10.1890/04-0669;
42
Mamiya, Y. (1988), History of the Pine Wood Disease in Japan, Journal of Nematology, 20: 219-226;
Mamiya, Y. & Kiyohara, T. (1972), Description of Bursaphelenctus lignicolus n.sp. (nematode:Aphelenchoididae) from pine wood and histopathology of nematode-infested trees, Nematologica, 18: 120-124. DOI: 10.1163/187529272X00296;
Mamiya, Y. & Enda, N (1972), Transmition of Bursaphelenctus lignicolus (nematode:Aphelenchoididae) by Monochamus alternatus (Coleoptera:Cerambycidae), Nematologica, 18: 159-162. DOI: 10.1163/187529272X00395;
Mamiya, Y. (1976), Pine wilting disease caused by the pine wood nematode, Bursaphelencus lignicolus, in Japan;
Mooney, H.A., Mack, R.N., MacNeely, J.A., Neville, L.E., Schei, P.J. & Waage, J.K. (2005), Invasive alien species: a new synthesis, Island Press, Washington DC;
Mota, M.M., Braasch, H., Bravo, M.A., Penas, A.C., Burgermeister, W., Metge, K., Sousa, E. (1999), First report of Bursaphelencus xylophilus in Portugal and Europe, Nematology, 1: 727-734;
Mota, M.M. & Vieira, P.C. (2008), Pine wilt disease in Portugal. In: Zhao, B.G., Futai, K., Sutherland, J.R. & Takeucchi, eds. Pine Wilt disease, Springer Japan: 33-38. DOI: 10.1007/978-4-431-75655-2_6;
Oliveira, A.M.C.; Pereira, J.S., Correia, A.V. (2000), "A silvicultura do pinheiro bravo", Centro Pinus, Lisboa;
Raimundo, R.J.C (2004), Condicionantes ambientais na distribuição de anfíbios e répteis em Portugal Continental, Dissertação em Mestrado em Gestão e Política Ambiental, Universidade de Évora;
Sala, O.E., Chapin, F.S., Armesto, J.J., Berlow, E., Bloomfield, J., Dirzo, R. et al. (2000), Global Biodiversity Scenarios for the year 2100, Science, 287: 1770-1774
Sousa, E., Bravo, M.A., Pires, J., Naves, P., Penas, A.C., Bonifácio, L. & Mota, M. (2001) Bursaphelenchus xylophilus (Nematoda: Aphelenchoididae) associated with Monochamus galloprovincialis (Coleoptera: Cerambycidae) in Portugal, Nematology, 3: 89–91;
43 Swets, K. A. (1988). Measuring the accuracy of diagnostic systems, Science, 240: 1285-1293; UNEP (United Nations Environment Programme) (2011), Reporting Forests: A journalist’s guide to the role of forests in sustainable development and human well-being. In: www.unep.org/forests;
Vicente, C., Espada, M., Vieira, P. & Mota, M. (2012), Pine wilt disease: a threat to European forestry, European Journal of Plant Pathology, 113: 89-99. DOI: 10.1007/s10658-011-9924-x;
Vu, Q.M., Le, Q.B., Frossard, E. & Vlek, P.L.G. (2014), Socio-economic and biophysical determinants of land degradation in Vietnam: An integrated causal analysis at the national level, Land Use Policy, 36: 605-617. DOI:10.1016/j.landusepol.2013.10.012
Webster, J. & Mota, M. (2008), PineWilt Disease: Global Issues, Trade and Economic Impact. In: Mota MM, Vieira P, eds. Pine wilt disease: A worldwide threat to Forest Ecosystems;
Williamson, M. (1996), Biological Invasions, Population and Community Biology Series, 15, Springer;
Wingfield, M. J., Blanchette, R.A., Nicholls, T.H. & Robbins, K. (1982), The pine wood nematode: a comparison of the situation in the United States and Japan, Canadian Journal of Forest Research, 12: 71-75;
Zhao, B.G., Futai, K., Sutherland, J.R. & Takeucchi, Y (2008), Pine Wilt disease, Springer Japan, 2-4. DOI: 10.1007/978-4-431-75655-2_2;
![Figure 1 - Invasion process model. [Source: Lockwood et al., 2007]](https://thumb-eu.123doks.com/thumbv2/123dok_br/16667701.742549/21.892.249.646.482.769/figure-invasion-process-model-source-lockwood-et-al.webp)