Food Science and Technology
DO:
D https://doi.org/10.1590/fst.23317
OSSN 1678-457X (Dnline)
1 Introduction
Flavonoids are a large group of phenolic secondary metabolites that are widespread in plants and have many biological functions (Yang et al., 2015; Brickman et al., 2014). Flavonoids have a wide range of biochemical and pharmacological properties and are commonly considered major bioactive constituents in traditional Chinese medicine (TCM) (Yang et al., 2018). Chlorogenic acid, one of the most abundant dietary polyphenols in many plants, is an ester in which the acid is bound to the hydroxyl group at position 5’ of quinic acid (Naczk & Shahidi, 2006; Yan et al., 2017). These two active substances are widely found in plants and have important biological functions. Recently, there have been many methods demonstrating the qualitative and quantitative control of various herbs. These methods have been widely utilized in evaluating both food and medicinal resources, such as Chrysanthemum indicum flower (He et al., 2016), Rosa flower (Riffault et al., 2014), ginkgo leaf (Van Beek & Montoro, 2009), and green tea (Alaerts et al., 2012). Thus, a trend has emerged in seeking novel, low-cost and safe (Sindhi et al., 2013) plant-based resources for use in healthcare products.
Acer truncatum Bunge, a member of the Aceracae family, is endemic to China, Korea and Japan but is also found in Europe and North America (Guo et al., 2014; Moore & White, 2003). On China,
A. truncatum is planted as an ecological and commercial tree that is often used for hill afforestation or as a scenic species (Honma et al., 2010). The seed kernel in its samara is extracted to produce a superior oil that is rich in nervonic acid (Wang et al., 2006) and has been officially declared an edible oil by the Ministry of Health of the People’s Republic of China. Moreover, A. truncatum leaves (ATL) are traditionally used as a substitutional tea and have been reported
to inhibit the activity of fatty acid synthase (Zhao et al., 2014b). There have been many phytochemical investigations focusing on
Acer truncatum, as this species has great commercial value and numerous applications in traditional Chinese medicine and tea production. Acer truncatum leaves (ATLs) have long been used in China as a substitutional tea with health benefits (Yang et al., 2018). Tea is one of the most popular and widely consumed beverages all over the world. Tea extracts are rich sources of flavonoid and phenolic compounds, which are potentially beneficial for health because they are both strong antioxidant agents and efficacious pharmaceutical agents (Zhao et al., 2014a).
Dur previous studies have shown that ‘Luhong No. 1’ is the optimal strain of Acer truncatum in terms of leaf quality. However, due to the differences in the medicinal value of the many strains bred by our research group, the total flavonoids and chlorogenic acid contents were determined in the leaves of 17 Acer truncatum
strains. Through these experiments, we screened the superior medicinal strains of Acer truncatum, aiming to provide a basis for the qualitative evaluation and comprehensive utilization of
Acer truncatum resources.
2 Materials and methods
2.1 Plant materials
The test material was based on years of field surveys. On total, four individual plants were selected from eleven distinct individual plants with good leaf shape and color
Comparison and correlation analysis of flavonoids and chlorogenic acid contents in
different strains of
Acer truncatum
Hongjian REN1, Zhen FENG1*
Received 21 July, 2017 Accepted 02 Apr., 2018
1 College of Forestry, Shandong Agricultural University, Tai’an, Shandong, China
*Corresponding author: fengzn408 @qq.com
Abstract
The morphological characteristics, total flavonoid content (TFC) and chlorogenic acid (CGA) contents of leaves from different strains of Acer truncatum were analyzed with the goal of providing guidance for the development and utilization of Acer truncatum
leaves (ATLs) and a selection system for the medicinal cultivar of Acer truncatum species. The morphological characteristics of the ATLs were determined using conventional methods, and TFC and CGA were used to determine the ATL extract by UV spectrophotometry and HPLC. The results showed that most traits significantly differed among the ATL morphologies of different strains and that considerable variability was found between different strains in both TFC (15.04 to 35.18 mg/g) and CGA (0.17 to 0.77 mg/g). The CGA content of ATLs could be improved by selecting for leaf lobe length (Pearson correlation coefficient of 0.551*). Principal component analysis showed that the variations in the ATLs were primarily determined by four comprehensive factors: shape, TFC, angle, and petiole. The TDPSOS method was used to obtain the quality of medicinal
Acer truncatum resources: Clone No. ‘1-6’, Clone No. ‘1-7’ and Clone No. ‘5-4’.
Keywords:Acer truncatum leaves; total flavonoids; chlorogenic acid; correlation; classification; TDPSOS method.
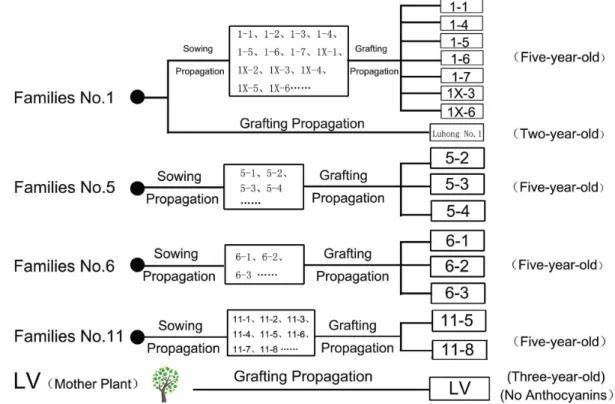
(‘Luhong No. 1’, ‘No. 5’, ‘No. 6’ and ‘No. 11’). For example, ‘Luhong No. 1’ seeds were cultivated as follows: first, seeds from the ‘Luhong No. 1’ original tree were collected, sown and grown as No. 1 family seedlings. Next, superior single seedlings were selected with offspring numbers 1-1, 1-2, 1-3, 1-4, 1-5, 1-6, 1-7, 1X-1, 1X-2, 1X-3, 1X-4, 1X-5, 1X-6 etc. Then, offspring numbers 1-1, 1-4, 1-5, 1-6, 1-7, 1X-3, and 1X-6 were cloned by grafting as clones 1-1, 1-4, 1-5, 1-6, 1-7, 1X-3, and 1X-6. The eight groups of plants numbered 5-2, 5-3, 5-4, 6-1, 6-2, 6-3, 11-5 and 11-8 were also generated via this process. On this test, the ‘Luhong No. 1’ plants were 2-year-old clones obtained by grafting of the original ‘Luhong No. 1’ tree. The grafting rootstocks were the seedlings from the same batch of Acer truncatum seedlings whose seeds were collected from more than 15-year-old Acer truncatum
trees on the campus of the Shandong Agricultural University. LV (no Anthocyanin) were 3-year-old clones that were generated used the grafting method described above. This clone has small, yellowish-green new leaves in the spring, and then, the leaves change to dark green. The genealogical relationship of the plants in this test was clear (Figure 1).
2.2 Plant sample collection
The leaf samples were collected from the landscape plant experimental station of Shandong Agricultural University, Taian, China on 15/5/2017. The collected leaf samples were kept at 4 °C.
2.3 Morphological measurements
First, the leaves were collected from different strains of
Acer truncatum. The requirements for collecting leaves were as follows: a total of 3-5 plants were randomly selected from each
strain; from every tree, 50 leaves from the branches facing east, south, west, and north were picked; and from the selection of the intact leaves, 20 leaves were selected for the measurement and calculation of morphological characteristics. The leaf area and leaf base angle were calculated after scanning the leaves through the ‘WAN SHEN’ leaf area scanner, and the remaining indexes were measured and calculated using Vernier calipers.
2.4 Measurements of total flavonoids and chlorogenic acid
Flavonoids
The UV spectrophotometric determination is one of the most widely used methods for quantification of the total flavonoid content (TFC) in raw plant materials due to its simplicity, low cost of implementation and wide availability in laboratories for quality control. The TFC was quantified according to the methodology described by Jian-rong et al. (2004). The specific steps included obtaining 50 g leaf samples and removing the pigment, resin and other impurities by degreasing with petroleum ether. Then, the leaf samples were treated for 1.5 h with 70% ethanol 3 times to extract the flavones. The combined filtrate was decompressed and concentrated, and the filter residue was washed repeatedly until the flavone was completely dissolved. The combination of filtrate, extract and recovery solvent was concentrated as a liquid with methanol at a constant volume. Using rutin as the standard sample, we accurately weighed 2 mg of standard dry rutin in a 50-mL volumetric flask containing 30% ethanol (w/v). Then, 0.50 mL, 1.00 mL, 1.50 mL, 2.00 mL, or 3.00 mL of standard solution was added to a 10 mL volumetric flask, and 30% ethanol was added to a final volume of 5 mL. Then, 0.3 mL of 50% NaND2 was added, and the solution was
shaken. After 5 min, 0.3 mL of 10% Al (ND3)3 was added; 2 mL of 4% NaDH solution was then added after 6 min, and then, 30% ethanol was added to obtain a final volume. After 10 min, the reagent was used as a blank for the colorimetric determination. The spectrophotometer was used at 510 nm, and the standard curve was prepared by colorimetric determination with the reagent as a blank. Dne mL of the extraction liquid was fixed with methanol, a final volume of 10 mL was obtained by adding 30% ethanol, and the absorbance was measured at a wavelength of 510 nm. The flavonoid content was calculated based on the standard curve (standard flavonoid curve: Y = 2.51X + 0.0007, R2 = 0.9996).
Chlorogenic acid
CGA content was measured by a modified method described by Yang et al. (2015). Approximately 0.2 g of ATLs was placed into the mortar and ground. The sample was then added to 6 mL of pre-cooled 50% methanol in water and sonicated for 30 min. The solution was allowed to cool, and 50% methanol in water was added to make up the reduced volume. The extract was centrifuged at 10,000 rpm for 10 min, and the supernatant to be measured was transferred to another EP tube using an appropriate needle filter attached to a sample bottle with an inner lining. A Rigol L3000 HPLC system was used with a Kromasil C18 (250 mm × 4.6 mm, 5 μm) reverse phase column. The mobile phase was composed of methanol and 1% acetic acid aqueous solution. For the detection method, the injection volume was
10 μl; the flow rate was 1.0 mL/min; the column temperature was 30 °C; the aliasing time was 60 min; the detection wavelength was 327 nm (standard curve of chlorogenic acid: Y = 12.479X-52.531, R2 = 0.9994, retention time: 31.7 min).
2.5 Data analysis
The coefficient of variation (%) was determined as an indicator of variability. The characteristics of ATLs and the analyses of different strains were performed using SPSS 22 statistical software. The correlation coefficients between the characteristics were calculated using Pearson’s correlation coefficient. Principal component analysis (PCA) and cluster analysis were performed using R statistical software. The varieties were selected using the TDPSOS method based on all indexes of ATLs.
3 Results and discussion
3.1 Differences among strains
Morphological comparison
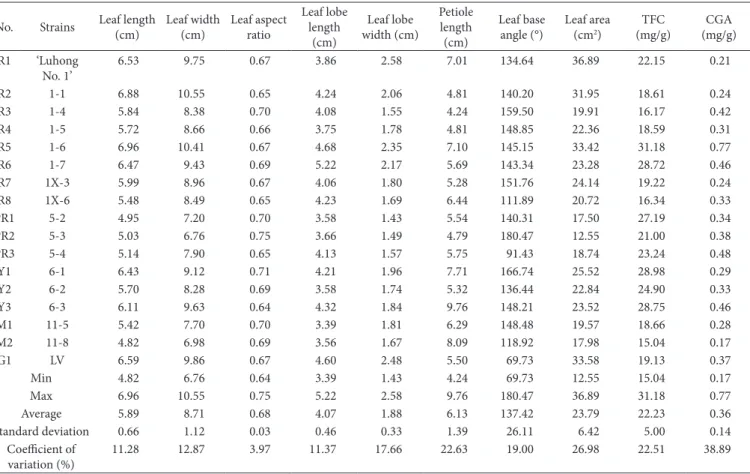
On this study, the morphological characteristics of ATLs were detected among the studied strains (Table 1). The changes ranged from 12.55 (No. PR2) to 36.89 (No. R1) cm2 in leaf area,
from 4.24 (No. R3) to 9.76 (No. Y3) cm in petiole length, and from 0.64 (No. Y3) to 0.75 (No. PR2) in leaf aspect ratio. Due to the genetic differences in the tested strains, most of the traits showed significant differences among the strains. The highest coefficient of variation (CV) was in leaf area (26.98%), whereas
Table 1. Comparison of morphological traits and two medicinal components of 17 Acer truncatum strains.
No. Strains Leaf length (cm)
Leaf width (cm)
Leaf aspect ratio
Leaf lobe length
(cm)
Leaf lobe width (cm)
Petiole length (cm)
Leaf base angle (°)
Leaf area (cm2)
TFC (mg/g)
CGA (mg/g) R1 ‘Luhong
No. 1’
6.53 9.75 0.67 3.86 2.58 7.01 134.64 36.89 22.15 0.21
R2 1-1 6.88 10.55 0.65 4.24 2.06 4.81 140.20 31.95 18.61 0.24
R3 1-4 5.84 8.38 0.70 4.08 1.55 4.24 159.50 19.91 16.17 0.42
R4 1-5 5.72 8.66 0.66 3.75 1.78 4.81 148.85 22.36 18.59 0.31
R5 1-6 6.96 10.41 0.67 4.68 2.35 7.10 145.15 33.42 31.18 0.77
R6 1-7 6.47 9.43 0.69 5.22 2.17 5.69 143.34 23.28 28.72 0.46
R7 1X-3 5.99 8.96 0.67 4.06 1.80 5.28 151.76 24.14 19.22 0.24
R8 1X-6 5.48 8.49 0.65 4.23 1.69 6.44 111.89 20.72 16.34 0.33
PR1 5-2 4.95 7.20 0.70 3.58 1.43 5.54 140.31 17.50 27.19 0.34
PR2 5-3 5.03 6.76 0.75 3.66 1.49 4.79 180.47 12.55 21.00 0.38
PR3 5-4 5.14 7.90 0.65 4.13 1.57 5.75 91.43 18.74 23.24 0.48
Y1 6-1 6.43 9.12 0.71 4.21 1.96 7.71 166.74 25.52 28.98 0.29
Y2 6-2 5.70 8.28 0.69 3.58 1.74 5.32 136.44 22.84 24.90 0.33
Y3 6-3 6.11 9.63 0.64 4.32 1.84 9.76 148.21 23.52 28.75 0.46
M1 11-5 5.42 7.70 0.70 3.39 1.81 6.29 148.48 19.57 18.66 0.28
M2 11-8 4.82 6.98 0.69 3.56 1.67 8.09 118.92 17.98 15.04 0.17
G1 LV 6.59 9.86 0.67 4.60 2.48 5.50 69.73 33.58 19.13 0.37
Min 4.82 6.76 0.64 3.39 1.43 4.24 69.73 12.55 15.04 0.17
Max 6.96 10.55 0.75 5.22 2.58 9.76 180.47 36.89 31.18 0.77
Average 5.89 8.71 0.68 4.07 1.88 6.13 137.42 23.79 22.23 0.36
Standard deviation 0.66 1.12 0.03 0.46 0.33 1.39 26.11 6.42 5.00 0.14
Coefficient of variation (%)
the lowest CV was observed in the leaf aspect ratio (3.97%). A similar trend was reported for the mean of varieties of coffee (Schmildt et al., 2015) and in different pedunculate oak genotypes (Ouercus robur L) (Nikolic et al., 2006). On the same environment, the leaf area of different strains of the same species was the trait showing the largest change among the leaf morphology traits. Yang (2008) pointed out that the leaf aspect ratio was affected by multiple gene results, as the genetic efficiency was low in the study of the genetic structure of the Medicago truncatula
population. Thus, the CV of the leaf area was high. As the lowest CV was observed for the leaf aspect ratio, this morphological trait of ATLs was determined to be relatively stable.
Total flavonoid content and chlorogenic acid contents
The TFC and CGA (mg/g) contents were detected among the ATLs of 17 strains, as shown in Table 1. The CV of the TFC was 22.51% and varied from 15.04 to 31.18 mg/g (22.23 mg/g on average). Tan et al. (2017) reported that in 58 white tea varieties, the TFC was 2.3-8.5 g/kg. Therefore, the actual content of TFC should be lower than that indicated by our data. However, using the same method used in our study, Lee et al. (2016) and Bizuayehu et al. (2016) determined the TFC in green tea and obtained highly similar results (2320 and 2340 mg catechin equivalent/100 g, respectively). Ot could be concluded that the total flavonoids in ATLs (mg/100 g) were similar to those in green tea and that ATLs were suitable for processing green tea for drinking. The CV of the CGA content was 38.89%, which was the highest CV among the measured leaf traits. The CGA contents ranged from 0.17 to 0.77 mg/g for the 17 strains (0.36 mg/g on average). Though green tea extract contained 292.3 µg/g chlorogenic acid (Tang et al., 2016), the levels in the ATLs were much higher and quite noticeable when compared with those of the main tea plants. Therefore, it can be concluded that in our study, CGA in ATLs were relatively high among the main tea or substitutional tea products. Notably, No. R5 (1-6:0.77 mg/g) had the maximum
CGA, which suggested that this ATL should be a worthwhile candidate for chlorogenic acid products.
Numerous studies have been performed to determine the medicinal constituents of ATL, including TFC and CGA. Le (2010) detected chlorogenic acid contents of approximately 3% in ATLs. Jian-rong et al. (2004) tested the ATLs of Shanxi and showed that in May, the TFC and CGA contents were 4.24% and 2.36%, respectively. The differences between our results and those of previous studies are mainly due to the differences in material genotype, differences in the test site, differences in the acquisition month, and other factors. Graham (1992) reported that the season, climate and leaf age also influence the composition of the teas.
Total flavonoid content and chlorogenic acid contents in the ATLs of different strains
Large differences were found in the TFC among the 17 strains. The strain with the highest amount (No. R5) contained almost more than twice that in the strain with the lowest amount (No. M2) of TFC (Figure 2A). Moreover, differences were found in the autumn colors of the ATLs of the 17 strains. Specifically, No. PR3 and No. Y1 were yellow, whereas No. G1 was lighter yellow. Shi et al. (2012) reported that in Ginkgo biloba, the total flavonoid contents increased in the order of green, green-yellowish and yellow leaves. Therefore, the differences in leaf color between different strains are associated with differences in their flavonoid contents.
The trend observed for CGA was almost the same as that of observed for the TFC. However, the strain with the highest amount of CGA (R5) contained approximately 4.5 times more than the strain with the lowest amount (M2) of CGA. Strain R5 was approximately 3.2 times higher in CGA than that of R2 or R7, although they belong to the same family. On terms of the relationships among the groups of test materials, Families No. 1, No. 5, No. 6, No. 11 and LV belong to different families. The TFC
Figure 2. Total flavonoids and chlorogenic acid contents in the ATLs of different strains. The total flavonoid contents in the ATLs of 17 strains
of Family No. 6 was higher than that of the other families, making Family No. 6 suitable for creating a TFC series. The CGA content of Family No. 5 was richer than that of the other families; thus, Family No. 5 was suitable for creating a CGA series. However, Family No. 1 contained strains with higher contents of CGA. These results indicated that there were significant differences in the contents of these components among the different families and even among different clones of the same family.
On autumn, Families No. 1 and No. 5 of the Acer truncatum
strains (including R1, R2, R3, R4, R5, R6, R7, R8, PR1, PR2 and PR3) turned red, whereas the remaining lines were yellow. However, since there were no correlations between the levels of the two medicinal components and these color changes, it was difficult to screen for strains of Acer truncatum with high TFC or CGA contents according to the leaf color characteristics.
Chlorogenic acid is an important phenolic substance and plays an important role in plants. Phenols widely exist in a variety of plants; Dsorio-Tobón et al. (2016) and Cruz et al. (2017) reported that the phenolic profile widely exists in different plants and that these compounds have important pharmacological effects, such as acting as potent antioxidants, and they have been recognized for their biological activity associated with anticancer, antibacterial, antiviral, chemopreventive and chemotherapeutic activities. Ot is of great interest to explore the profile of these phenolic compounds since the quantities found were high, especially in flavonoids. Therefore, our next focus is a detailed study of these test materials containing phenols and their contents to be able to more comprehensively evaluate the active ingredients of ATLs to assess their medicinal quality and to optimize the application of Acer truncatum resources.
3.2 Correlation analysis
Correlative analysis of leaf morphology among the ATLs of different strains
Gao et al. (2016) studied the phenotypic traits of
Scutellaria baicalensis from different strains and pointed out that it is essential to study the correlation between traits in breeding research. The correlation coefficients between the morphological traits of ATLs were higher due to the reciprocal
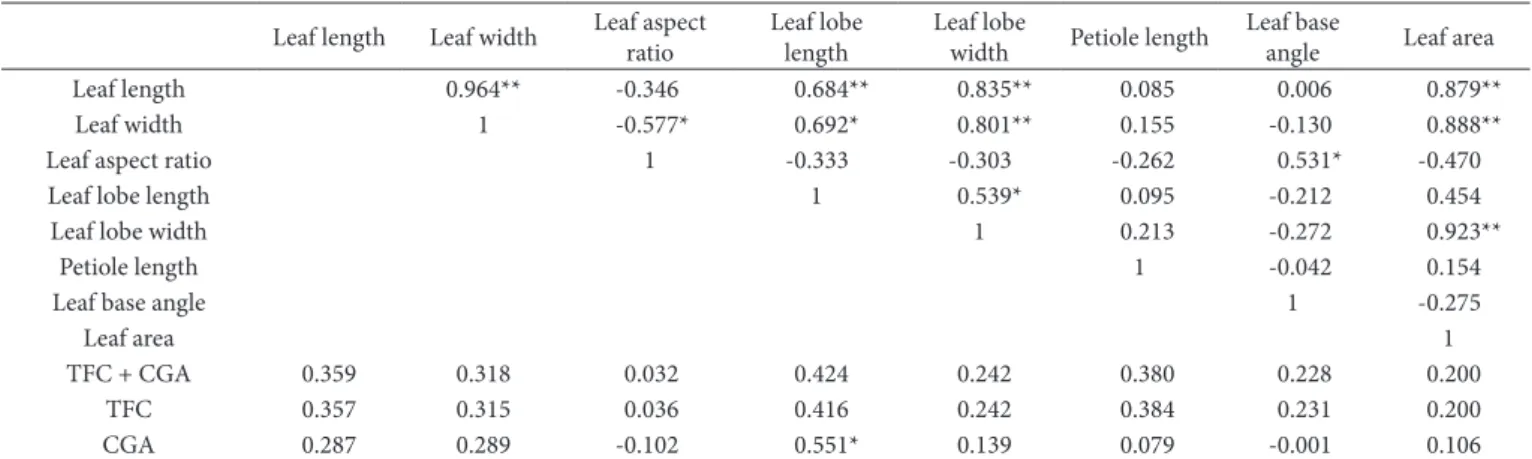
relationship among the morphological characteristics of ATL. For example, as shown in Table 2, leaf length and width, leaf lobe length, leaf lobe width, and leaf area were significantly correlated. The correlation coefficient of the leaf length and leaf width was 0.964**, which was the highest correlation between two traits. This result suggested that the shape of Acer truncatum became stabilized in the same growth environment. Since leaf area was determined by leaf length and leaf width, the correlation coefficient between leaf width and leaf area was 0.888**, and the correlation was extremely significant. Petiole length was not directly related to the rest of the leaf traits; thus, the correlation coefficients were not significant.
Correlative analysis of medicinal components among the ATLs of different strains
The chemical composition and some plant morphological measurements can reflect the merits of potential medicinal materials. Chemical composition and morphological measurements are two different parameters used in plant identification and evaluation that, if combined, would be of great significance to the quality control of medicinal materials (Guo et al., 2016; Li et al., 2013; Sá et al., 2016). Thus, the correlations between medicinal components (TFC and CGA) and morphological measurements of ATLs were evaluated. As shown in Table 2, there were significant correlations among these traits of ATLs. The CGA content was significantly correlated with the leaf lobe length of ATLs (Pearson correlation coefficient = 0.551*). This result indicated that the CGA content could be simply and rapidly estimated based on the leaf lobe length. Longer leaf lobe lengths were correlated with higher CGA contents, whereas lower CGA contents were found in ATLs with shorter leaf lobes. However, the remaining morphological characteristics of ATLs were not significantly related to these two components.
3.3 Principal component analysis and cluster analysis
The resources of 17 strains of Acer truncatum were analyzed using principal component analysis, and the resulting component matrix is shown in Table 3. The key ATL indexes were as follows: the first principal component was the shape, the second was TFC, the third was the angle, and the last was the petiole. Previously,
Table 2. Correlation analyses of ATL morphological characteristics and between medicinal components and ATL morphological characteristics.
Leaf length Leaf width Leaf aspect ratio
Leaf lobe length
Leaf lobe
width Petiole length
Leaf base
angle Leaf area
Leaf length 0.964** -0.346 0.684** 0.835** 0.085 0.006 0.879**
Leaf width 1 -0.577* 0.692* 0.801** 0.155 -0.130 0.888**
Leaf aspect ratio 1 -0.333 -0.303 -0.262 0.531* -0.470
Leaf lobe length 1 0.539* 0.095 -0.212 0.454
Leaf lobe width 1 0.213 -0.272 0.923**
Petiole length 1 -0.042 0.154
Leaf base angle 1 -0.275
Leaf area 1
TFC + CGA 0.359 0.318 0.032 0.424 0.242 0.380 0.228 0.200
TFC 0.357 0.315 0.036 0.416 0.242 0.384 0.231 0.200
CGA 0.287 0.289 -0.102 0.551* 0.139 0.079 -0.001 0.106
Yang (2010) performed a principal component analysis of only the external shape of the ATL, and they reported the key leaf morphological indexes: the first principal component was the size, the second principal component was the shape, and the third principal component was the angle.
To evaluate the likely similarities and relationships among and within the 17 strains of Acer truncatum studied, a cluster analysis was performed based on the ten main components with measured traits. The cluster analysis results are presented in the form of a dendrogram in Figure 3A. As shown in Figure 3B, the first and second principal components explained 65.001% of the total variance of the data set and were used for classification of the samples; the result of the PCA classification was the same as that of the clustering classification. The samples were noticeably clustered in different domains, which represented the “similarities” and “differences” between different samples. Group 2 showed larger leaf areas, and the common feature of Group 3 was a high TFC content. The performance of the ATL traits in Group 1 was different from that in Groups 2 and 3. The results of the PCA classification and the clustering classification were
important for the selection of genetic breeding and high-quality germplasm. For example, Tohidi et al. (2017) studied the essential oil composition, total phenolic contents, flavonoid contents, and antioxidant activity of the Thymus species, and Cheng et al. (2010) combined principal component analysis, hierarchical cluster analysis and linear discriminant analysis for the classification and differentiation of Peganum sp. indigenous to China. However, it should be noted that since we did not have a sufficiently large dataset in the current study, the predictive ability of this assessment was limited. Of many new samples become available in the future, then supervised discrimination analysis can be performed to test the predictive performance.
3.4 Quality evaluation
The basic principle of the TDPSOS method was to sort out the ideal solution and negative ideal solution by performing a multi-objective decision analysis to evaluate the pros and cons of the research object (Hwang & Yoon, 1981). This method is often used for quality evaluation of traditional Chinese medicines (Wang et al., 2017; Jiang-yong et al., 2016) according
Figure 3. Classification of 17 different Acer truncatum strains according to the principal components 1 and 2 (A). Cluster analysis of the leaf trait
variation of Acer truncatum (B). The designations R1..., PR1..., Y1..., M1... and G1 represent the strains in Families No. 1, No. 5, No. 6, No. 11, and Clone LV.
Table 3. Results of principal component analysis of leaf trait variation of Acer truncatum.
Principal component
Eigenvector of different traits
Eigenvalues Contribution rate (%) Leaf
length Leaf width
Leaf aspect
ratio
Leaf lobe length
Leaf lobe width
Petiole length
Leaf base angle
Leaf
area TFC CGA
First 0.427 0.442 -0.254 0.352 0.401 0.121 -0.120 0.411 0.199 0.187 4.713 47.135 Second 0.039 -0.050 0.349 0.171 -0.121 0.132 0.470 -0.195 0.576 0.471 1.787 17.866 Third 0.307 0.139 0.443 -0.106 0.201 -0.494 0.484 0.206 -0.173 -0.297 1.230 12.297 Fourth 0.015 0.079 0.027 -0.364 0.157 0.726 0.277 0.149 0.144 -0.442 1.037 10.369
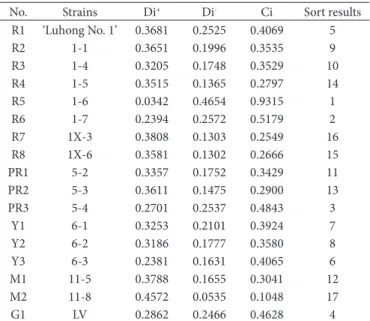
to the weight of each index of ATL. The results of evaluating the quality of different strains of Acer truncatum by the TDPSOS method Table 4 showed that the highest quality of medicinal
Acer truncatum resources was found in the lines Clone No. ‘1-6’, Clone No. ‘1-7’ and Clone No. ‘5-4’. These three lines can be considered high-quality medicinal strains of Acer truncatum.
4 Conclusion
There has been no previous report describing either the TFC or CGA contents in different strains of Acer truncatum
or the selection of high-quality Acer truncatum leaf contents. The results of this study indicate that there were significant differences in the TFC and CGA contents among different families of Acer truncatum and even among different clones in the same family. The results of the correlation analysis also demonstrated that the CGA content of ATLs could be identified by selecting for leaf lobe length. On addition, the 17 Acer truncatum strains studied were divided into well-defined groups based directly on PCA, which included shape, TFC, angle, and petiole as the variables, in terms of the log-transformed relative contents of the major components. By classification analysis, the above strains were divided into 3 categories, each of which had a relatively close relationship. The nearest strains were closest in the contents of medicinal components, and leaf shape and color were also close. The TDPSOS method was used to screen for the quality of germplasm resources, which were identified in the lines of Clone No. ‘1-6’, Clone No. ‘1-7’ and Clone No. ‘5-4’. This research was conducted using different clones from each family, which provided a sufficient genetic basis for future selection and breeding of Acer truncatum.
Acknowledgements
The authors thank the Shandong Agricultural Seeds Engineering Project: Omprovement and Demonstration of New Varieties
with High Quality and High Yield for Medicinal Trees—Acer
truncatum (2016LZGC014) and the Funds of Shandong “Double Tops” Program for financial support of Shandong provincial department of finance.
References
Alaerts, G., Van Erps, J., Pieters, S., Dumarey, M., van Nederkassel, A. M., Goodarzi, M., Smeyers-Verbeke, J., & Vander Heyden, Y. (2012). Similarity analyses of chromatographic fingerprints as tools for identification and quality control of green tea. Journal of Chromatography. B, Analytical Technologies in the Biomedical
and Life Sciences, 910(31), 61-70. http://dx.doi.org/10.1016/j.
jchromb.2012.04.031. PMid:22672846.
Bizuayehu, D., Atlabachew, M., & Ali, M. T. (2016). Determination of some selected secondary metabolites and their invitro antioxidant activity in commercially available Ethiopian tea (Camellia sinensis).
SpringerPlus, 5(1), 1-9.
http://dx.doi.org/10.1186/s40064-016-2056-1. PMid:27069832.
Brickman, A. M., Khan, U. A., Provenzano, F. A., Yeung, L. K., Suzuki, W., Schroeter, H., Wall, M., Sloan, R. P., & Small, S. A. (2014). Enhancing dentate gyrus function with dietary flavanols improves cognition in older adults. Nature Neuroscience, 17(12), 1798-1803. http://dx.doi.org/10.1038/nn.3850. PMid:25344629.
Cheng, X. M., Zhao, T., Yang, T., Wang, C. H., Bligh, S. W., & Wang, Z. T. (2010). HPLC fingerprints combined with principal component analysis, hierarchical cluster analysis and linear discriminant analysis for the classification and differentiation of Peganum sp. indigenous to China. Phytochemical Analysis, 21(3), 279-289. http://dx.doi. org/10.1002/pca.1198. PMid:20020435.
Cruz, R. G. D., Vieira, T. M. F. S., & Lira, S. P. (2017). Potential antioxidant of brazilian coffee from the region of cerrado. Food Science and
Technology. On press. http://dx.doi.org/10.1590/1678-457x.08017.
Gao, X. X., Chen, J., Xu, R., Yu, J., Yang, C. M., Peng, F., Zhang, Y. Q., & Peng, Y. L. (2016). Variation and correlation analysis on phenotypic traits of Scutellaria baicalensis from different strains. Zhongguo
Zhongyao Zazhi, 41(2), 205-210. PMid:28861964.
Graham, H. N. (1992). Green tea composition, consumption, and polyphenol chemistry. Preventive Medicine, 21(3), 334-350. http:// dx.doi.org/10.1016/0091-7435(92)90041-F. PMid:1614995. Guo, X., Wang, R., Chang, R., Liang, X., Wang, C., Luo, Y., Yuan, Y., & Guo,
W. (2014). Effects of nitrogen addition on growth and photosynthetic characteristics of Acer truncatum seedlings. Dendrobiology, 72, 151-161. http://dx.doi.org/10.12657/denbio.072.013.
Guo, Y., Lv, B., Wang, J., Liu, Y., Sun, S., Xiao, Y., Lu, L., Xiang, L., Yang, Y., Qu, L., & Meng, Q. (2016). Analysis of Chuanxiong Rhizoma and its active components by Fourier transform infrared spectroscopy combined with two-dimensional correlation infrared spectroscopy.
Spectrochimica Acta Part A Molecular & Biomole, 153, 550-559. http://
dx.doi.org/10.1016/j.saa.2015.09.036. PMid:26439523.
He, J., Wu, X., Kuang, Y., Wang, T., Bi, K., & Li, Q. (2016). Quality assessment of Chrysanthemum indicum Flower by simultaneous quantification of six major ingredients using a single reference standard combined with HPLC fingerprint analysis. Asian Journal of
Pharmaceutical Sciences, 11(2), 265-272. http://dx.doi.org/10.1016/j.
ajps.2015.08.010.
Table 4. Results of the quality evaluation of different Acer truncatum
strains using TDPSOS.
No. Strains Di+ Di- Ci Sort results
R1 ‘Luhong No. 1’ 0.3681 0.2525 0.4069 5
R2 1-1 0.3651 0.1996 0.3535 9
R3 1-4 0.3205 0.1748 0.3529 10
R4 1-5 0.3515 0.1365 0.2797 14
R5 1-6 0.0342 0.4654 0.9315 1
R6 1-7 0.2394 0.2572 0.5179 2
R7 1X-3 0.3808 0.1303 0.2549 16
R8 1X-6 0.3581 0.1302 0.2666 15
PR1 5-2 0.3357 0.1752 0.3429 11
PR2 5-3 0.3611 0.1475 0.2900 13
PR3 5-4 0.2701 0.2537 0.4843 3
Y1 6-1 0.3253 0.2101 0.3924 7
Y2 6-2 0.3186 0.1777 0.3580 8
Y3 6-3 0.2381 0.1631 0.4065 6
M1 11-5 0.3788 0.1655 0.3041 12
M2 11-8 0.4572 0.0535 0.1048 17
G1 LV 0.2862 0.2466 0.4628 4
Spectrochimica Acta Part A Molecular & Biomole, 94(8), 271-276. http://dx.doi.org/10.1016/j.saa.2012.03.078. PMid:22522302. Sindhi, V., Gupta, V., Sharma, K., Bhatnagar, S., Kumari, R., & Dhaka,
N. (2013). Potential applications of antioxidants: a review. Journal
of Pharmacy Research, 7(9), 828-835. http://dx.doi.org/10.1016/j.
jopr.2013.10.001.
Tan, J., Engelhardt, U. H., Lin, Z., Kaiser, N., & Maiwald, B. (2017). Flavonoids, phenolic acids, alkaloids and theanine in different types of authentic Chinese white tea samples. Journal of Food Composition
and Analysis, 57, 8-15. http://dx.doi.org/10.1016/j.jfca.2016.12.011.
Tang, W., Li, G., Row, K. H., & Zhu, T. (2016). Preparation of hybrid molecularly imprinted polymer with double-templates for rapid simultaneous purification of theophylline and chlorogenic acid in green tea. Talanta, 152, 1-8. http://dx.doi.org/10.1016/j.talanta.2016.01.046. PMid:26992488.
Tohidi, B., Rahimmalek, M., & Arzani, A. (2017). Essential oil composition, total phenolic, flavonoid contents, and antioxidant activity of Thymus species collected from different regions of Oran. Food Chemistry, 220, 153-161. http://dx.doi.org/10.1016/j. foodchem.2016.09.203. PMid:27855883.
Van Beek, T. A., & Montoro, P. (2009). Chemical analysis and quality control of Ginkgo biloba leaves, extracts, and phytopharmaceuticals.
Journal of Chromatography. A, 1216(11), 2002-2032. http://dx.doi.
org/10.1016/j.chroma.2009.01.013. PMid:19195661.
Wang, M. W., Li, S., & Li, M. (2017). Comprehensive evaluation on medicinal quality of angelica sinensis radix of different cultivars (strains) by entropy TDPSOS model. Zhongguo Shiyan Fangjixue
Zazhi, 5(23), 63-68.
Wang, X. Y., Fan, J. S., Wang, S. Y., & Sun, R. C. (2006). A new resource of nervonic acid from purple blow maple (Acer truncatum) seed oil.
Forest Products Journal, 56(11-12), 147-150.
Yan, Y., Liu, N., Hou, N., Dong, L., & Li, J. (2017). Chlorogenic acid inhibits hepatocellular carcinoma in vitro and in vivo. The Journal of
Nutritional Biochemistry, 46(7), 68-73. http://dx.doi.org/10.1016/j.
jnutbio.2017.04.007. PMid:28458139.
Yang, C., Gundala, S. R., Mukkavilli, R., Vangala, S., Reid, M. D., & Aneja, R. (2015). Synergistic interactions among flavonoids and acetogenins in Graviola (Annona muricata) leaves confer protection against prostate cancer. Carcinogenesis, 36(6), 656-665. http://dx.doi. org/10.1093/carcin/bgv046. PMid:25863125.
Yang, K. (2010). The researches on variation of leaf color, leaf and samara
shape in Acer truncatum Bunge. Taian: Shandong Agriculture University.
Yang, L., Yin, P., Li, K., Fan, H., Xue, Q., Li, X., Sun, L., & Liu, Y. (2018). Seasonal dynamics of constitutive levels of phenolic components lead to alterations of antioxidant capacities in Acer truncatum
leaves. Arabian Journal of Chemistry, 11(1), 14-25. http://dx.doi. org/10.1016/j.arabjc.2017.01.009.
Yang, Z. (2008). The research about structural analysis of population
genetic and way of genetic mapping construnction of M. truncatula.
Lanzhou: Gansu Agricultural University.
Zhao, F., Lin, H. T., Zhang, S., Lin, Y. F., Yang, J. F., & Ye, N. X. (2014a). Simultaneous determination of caffeine and some selected polyphenols in Wuyi Rock tea by high-performance liquid chromatography.
Journal of Agricultural and Food Chemistry, 62(13), 2772-2781.
http://dx.doi.org/10.1021/jf4056314. PMid:24625357.
Zhao, W., Wang, Y., Hao, W., Zhao, M., & Peng, S. (2014b). On vitro inhibition of fatty acid synthase by 1,2,3,4,6-penta-D-galloyl-beta-D-glucose plays a vital role in anti-tumour activity. Biochemical and
Biophysical Research Communications, 445(2), 346-351. http://dx.doi.
org/10.1016/j.bbrc.2014.01.191. PMid:24508804. Honma, A., Koyama, T., & Yazawa, K. (2010). Anti-hyperglycemic
effects of sugar maple Acer saccharum and its constituent acertannin.
Food Chemistry, 123(2), 390-394. http://dx.doi.org/10.1016/j.
foodchem.2010.04.052.
Hwang, C. L., & Yoon, K. (1981). Multiple attribute decision making:
methods and applications, a state-of-the-art survey. New York:
Springer-Verlag. http://dx.doi.org/10.1007/978-3-642-48318-9. Jiang-yong, Y. U., Qi-yun, H. U. A. N. G., & Su-juan, Z. H. D. U.
(2016). Application of grey correlation TDPSOS method in quality evaluation of Zingiberis Rhizoma. Zhongguo Shiyan Fangjixue
Zazhi, 18(22), 56-59.
Jian-rong, S., Xiang, L., Wen-yun, Y., & Jiang, D. (2004). A study on the seasonal variation of the contents of flavonoid and cholorogenic acid in the leaf of Acer truncatum. Forest Research, 17(4), 496-499. Le, W. (2010). Extraction separation and purification of Chlorogenic acid
from Acer truncatum Bunge. Xian: Northwest University.
Lee, B. H., Nam, T. G., Park, N. Y., Chun, D. K., Koo, S. O., & Kim, D. D. (2016). Estimated daily intake of phenolics and antioxidants from green tea consumption in the Korean diet. International Journal of
Food Sciences and Nutrition, 67(3), 344-352. http://dx.doi.org/10.3
109/09637486.2016.1153612. PMid:26940374.
Li, S., Liu, J., Gong, X., Yang, X., Zhu, Y., & Cheng, Z. (2013). Characterizing the major morphological traits and chemical compositions in the bulbs of widely cultivated Fritillaria species in China. Biochemical
Systematics and Ecology, 46, 130-136. http://dx.doi.org/10.1016/j.
bse.2012.09.014.
Moore, D., & White, J. (2003). Cassell’s trees of Britain and Northern
Europe. London: Weidenfeld Nicolson Ollustrated.
Naczk, M., & Shahidi, F. (2006). Phenolics in cereals, fruits and vegetables: occurrence, extraction and analysis. Journal of Pharmaceutical and
Biomedical Analysis, 41(5), 1523-1542. http://dx.doi.org/10.1016/j.
jpba.2006.04.002. PMid:16753277.
Nikolic, N., Krstic, B., Pajevic, S., & Drlovic, S. (2006). Variability of leaf characteristics in different pedunculate oak genotypes (Ouercus
robur L). Zbornik Matice Srpske za Prirodne Nauke, (111), 95-105.
http://dx.doi.org/10.2298/ZMSPN0611095N.
Dsorio-Tobón, J. F., Carvalho, P. O., Barbero, G. F., Nogueira, G. C., Rostagno, M. A., & Meireles, M. A. (2016). Fast analysis of curcuminoids from turmeric (curcuma longa l.) by high-performance liquid chromatography using a fused-core column. Food Chemistry, 200, 167-174. http://dx.doi.org/10.1016/j.foodchem.2016.01.021. PMid:26830575.
Riffault, L., Destandau, E., Pasquier, L., Andre, P., & Elfakir, C. (2014). Phytochemical analysis of Rosa hybrida cv. ‘Jardin de Granville’ by HPTLC, HPLC-DAD and HPLC-ESO-HRMS: polyphenolic fingerprints of six plant organs. Phytochemistry, 99, 127-134. http:// dx.doi.org/10.1016/j.phytochem.2013.12.015. PMid:24461781. Sá, S., Fiuza, T. S., Borges, L. L., Ferreira, H. D., Tresvenzol, L. M.
F., Ferri, P. H., Rezende, M. H., & Paula, J. R. (2016). Chemical composition and seasonal variability of the essential oils of leaves and morphological analysis of Hyptis carpinifolia. Revista Brasileira
de Farmacognosia, 26(6), 688-693. http://dx.doi.org/10.1016/j.
bjp.2016.05.011.
Schmildt, E. R., Amaral, J A T. D., Santos, J. S., & Schmildt, D. (2015). Allometric model for estimating leaf area in clonal varieties of coffee
(Coffea canephora). Revista Ciencia Agronomica, 46(4), 740-748.
http://dx.doi.org/10.5935/1806-6690.20150061.
Shi, J., Zou, X., Zhao, J., Mel, H., Wang, K. L., Wang, X., & Chen, H. (2012). Determination of total flavonoids content in fresh Ginkgo