Diffusion of anti-VEGF injections in
the Portuguese National Health System
Ana Patrícia Marques,1António Filipe Macedo,2Julian Perelman,3Pedro Aguiar,3 Amândio Rocha-Sousa,4Rui Santana3
To cite:Marques AP, Macedo AF, Perelman J,et al. Diffusion of anti-VEGF injections in the Portuguese National Health System.BMJ Open2015;5:e009006. doi:10.1136/bmjopen-2015-009006
▸ Prepublication history and additional material is available. To view please visit the journal (http://dx.doi.org/ 10.1136/bmjopen-2015-009006).
Part of this work has been presented in ARVO2014 annual meeting, Orlando, Florida. APM, AFM, ARS and RS are part of the
Portuguese visual impairment study group (PORVIS-GROUP).
Received 6 June 2015 Revised 2 September 2015 Accepted 15 October 2015
For numbered affiliations see end of article.
Correspondence to Dr Ana Patrícia Marques; ap. marques@ensp.unl.pt
ABSTRACT
Objectives:To analyse the temporal and geographical diffusion of antivascular endothelial growth factor (anti-VEGF) interventions, and its determinants in a National Health System (NHS).
Setting:NHS Portuguese hospitals.
Participants:All inpatient and day cases related to eye diseases at all Portuguese public hospitals for the period 2002–2012 were selected on the basis of four International Classification of Diseases 9th revision, Clinical Modification (ICD-9-CM) codes for procedures: 1474, 1475, 1479 and 149.
Primary and secondary outcome measures:We measured anti-VEGF treatment rates by year and county. The determinants of the geographical diffusion were investigated using generalised linear modelling. Results:We analysed all hospital discharges from all NHS hospitals in Portugal (98 408 hospital discharges corresponding to 57 984 patients). National rates of hospitals episodes for the codes for procedures used were low before anti-VEGF approval in 2007 (less than 12% of hospital discharges). Between 2007 and 2012, the rates of hospital episodes related to the
introduction of anti-VEGF injections increased by 27% per year. Patients from areas without ophthalmology departments received fewer treatments than those from areas with ophthalmology departments. The availability of an ophthalmology department in the county increased the rates of hospital episodes by 243%, and a 100-persons greater density per km2raised the rates by 11%.
Conclusions:Our study shows a large but unequal diffusion of anti-VEGF treatments despite the universal coverage and very low copayments. The technological innovation in ophthalmology may thus produce unexpected inequalities related to financial constraints unless the implementation of innovative techniques is planned and regulated.
INTRODUCTION
Age-related macular degeneration (AMD) is a chronic, progressive disease and the most common cause of visual impairment in devel-oped countries in patients older than 65 years.1–7AMD requires lifelong observation and interventions.8AMD can be divided into two stages: early AMD, characterised by
subretinal pigmented epithelium deposits (drusen) and pigmentary changes and advanced AMD.5Advanced AMD has atrophic and neovascular forms. Although neovascular AMD comprises only 10% of the burden of the disease, it is responsible for 90% of severe vision loss.1 9–12 Vision loss leads to reduced quality of life and autonomy, and is associated with large costs for health systems and the society.10 13–15
Before the introduction of antivascular endothelial growth factor (anti-VEGF) treat-ments, AMD was largely untreatable.16 Anti-VEGF therapy for neovascular AMD has substantially changed the management of the disease.16 17 These drugs are injected into the vitreous chamber to reduce neovas-cular formation in the macula.2 Currently the most common anti-VEGF therapies in Portugal are: (1) Ranibizumab (Lucentis, Novartis) which was licensed for the treat-ment of neovascular AMD by the Food and Drug Administration (FDA) in 2006 and by the European Medicines Agency (EMA) in 2007. In Portugal, ranibizumab has been covered by the National Health Service (NHS) since 2008. Ranibizumab is the most
Strengths and limitations of this study
▪ A unique analysis of temporal and geograph-ical patterns of the diffusion of antivascular endothelial growth factor (anti-VEGF) treat-ments for eye diseases during one decade including all public hospitals in a National Health System.
▪ Results raise awareness to inequalities in eye care that can lead to irreversible sight loss caused by treatable eye diseases.
▪ The study points some determinants that can be modified to ensure that all patients with progres-sive eye conditions are treated equally.
▪ The lack of specific codes for anti-VEGF injections.
widely used approved anti-VEGF drug in Europe;1 3 18 (2) Bevacizumab (Avastin, Roche) was licensed in 2004 by the FDA, and by EMA in 2005 for the treatment of metastatic colorectal cancer. It has been widely used for the treatment of neovascular AMD as an off-label alter-native;16 (3) Pegaptanib sodium (Macugen, Eyetech/ Pfizer) was approved by FDA in 2004 and by EMA in
2006 for the treatment of neovascular AMD. It is less commonly used in clinical practice as it is not as effect-ive as ranibizumab or bevacizumab.2 19 In Portugal this therapy was approved but not marketed; (4) Aflibercept
(Eylea, Bayer) was approved for wet AMD treatment by FDA in 2011 and by the EMA in 2012. Aflibercept is
covered by the Portuguese NHS since 2014.
Several clinical trials have shown that intravitreal injec-tions prevent vision loss in the majority of patients and in some cases, significantly improved vision16 20–22 with
low numbers of serious adverse effects.8 Subsequently, anti-VEGF therapy has become the standard clinical option to treat patients with AMD.18 20 21 In 2011, anti-VEGF therapy was also introduced as treatment for diabetic macular oedema and central retinal vein occlusion.1 18 23
New therapies, such as anti-VEGF injections, improve the clinical course of diseases but represent substantial expenditures for healthcare systems.24 To face rising costs of healthcare, copayments have been introduced during the period of this study in public Portuguese hospitals. If not exempt due to special cir-cumstances, such as being disabled, patients receiving anti-VEGF injections have to pay typically €7.5 per
appointment with their physician at the hospital. In the context of economic recession and tight public budgets, the introduction and diffusion of these treat-ments can face substantial barriers.25 Despite the strong equity commitment of the Portuguese NHS, one of the expected barriers is likely to be geograph-ical due to unequal distribution of resources across areas.
The aim of this study was to examine the diffusion of anti-VEGF drugs in the Portuguese NHS by analysing the temporal and geographical diffusion patterns and its determinants. We conducted a longitudinal study in order to measure the evolution of hospital episodes related to anti-VEGF treatments per county from 2002 to 2012.
METHODS
Data sources and extraction strategies
We used an administrative database that includes demo-graphic, administrative and clinical information from all inpatient and day case episodes performed at all Portuguese NHS hospitals during the years 2002–2012. Authorisation to use these information was obtained by the Institutional Review Board (IRB) from Escola Nacional de Saúde Pública/Universidade Nova de Lisboa. In order to select the episodes related to
intravitreal injections for anti-VEGF treatments, we used the following International Classification of Diseases 9th
revision, Clinical Modification (ICD-9-CM) codes for
procedures: 1474, 1475, 1479, 149. These codes have been commonly used in the literature but they are likely to capture other treatments such as injectable antibiotics or corticosteroids.1Cases were excluded even if the diagnosis was likely to be associated with anti-VEGF treatment but the code of procedure was outside the selected group specified above. For
example, for thefive diagnoses shown in figure 2, there were 13 750 cases excluded from further analysis due to this filter. Effects to our estimation caused by the poor
specificity of the code were reduced using two methods:
(1) years 2002–2006 were included as baseline as before 2006 intravitreal anti-VEGF treatments for ophthalmo-logical use were not licensed; and (2) we crossed infor-mation of age with principal diagnosis. Baseline years provide the picture of the number of cases associated with the codes but not related with anti-VEGF treat-ments. We considered that AMD only affects people in the age range 50–59 years or above,26 and anti-VEGF are used for specific diagnosis such as AMD or
diabetic macular oedema. Online supplementary tables S1 and S2 show how this information was used in our methods. For the period studied, the only approved anti-VEGF drugs for use in public hospitals were Ranibizumab (Lucentis, Novartis) and Bevacizumab (Avastin).
We used the indicators given below:
▸ The absolute values of the number of hospital
epi-sodes per year. Epiepi-sodes were then disaggregated by: (1) sex, (2) age of the patients (under/over 60 years), (3) principal diagnosis.
▸ The number of patient treated per year. To calculate
the number of patients, we considered one treatment per person per year, regardless of the number of epi-sodes of care (number of treatments) that occurred in each year.
▸ The yearly rates of hospital episodes per 100 000
population ((number of episodes per year/annual average resident population per year)×100 000).
▸ The age-standardised rates of hospital episodes per
100 000 population by counties per year ((number of episodes by county and year/annual average resident population per county and year)×100 000) using general demographic information published by Statistics Portugal.27 County of residence was obtained from the administrative database used in the study. We used the direct method of standardisa-tion as described by Beaghole et al28 for standard
Portuguese population. The age standardisation was necessary to control the effect of age heterogeneity across populations living in different counties. Mainland Portugal is divided into 248 counties that correspond to local prefectures with specific
adminis-trative and political competences defined by the
Study analysis
We first evaluated the diffusion of treatments across
areas using the mean, minimum and maximum values of the rates of hospital episodes per 100 000 population in 2002, 2006 and 2012. The relative variation coefficient
was used to measure the dispersion of the diffusion. Three time points were selected because these corre-sponded to: 2002—the first year included in this study,
2006—the year before the approval of intravitreal injec-tions with anti-VEGF by EMA, and 2012 because it was the latest available information when this study started.
To investigate the determinants of geographical diffusion of anti-VEGF treatments we used generalised linear modelling. Considering the longitudinal nature of the data and its non-normal distribution, we used gener-alised estimating equations (GEE).29 The dependent variable was defined as the yearly rate of hospital
epi-sodes per county per 100 000 population. We defined as
independent variables: (1) the years during which the geographical diffusion was analysed (a linear trend); (2) a dichotomous variable to indicate the year when the drug was authorised in the European Union by EMA (anti-VEGF therapy availability: 0-not available; 1–able); (3) a dichotomous variable to indicate the avail-ability of an ophthalmology department in the hospital of the patient’s county of residence (Ophthalmology department availability: 0-no ophthalmology depart-ment; 1–ophthalmology department), and (4) popula-tion density ( populapopula-tion per km2) in the county. Information about the availability of ophthalmology departments was obtained in October 2014 from the Health Ministry official website.30 The referral pathway
for ophthalmology starts with the general practitioner (GP) according to the local referral guidelines. The circuit of the treatment does not interfere with our cal-culations because we compute treatment ratios based in the country of origin of the patient and this is independ-ent of the hospital where treatmindepend-ent was administered.
The model was defined asγlog link distribution
regres-sion model as the rate was expected to be positively skewed with an autoregressive first order matrix
repre-senting time dependence within the repeated subject.31 A total of 278 counties were considered as‘subjects’with repeated measures. Year and dichotomous variable ‘anti-VEGF availability’ were defined as within-subject
independent variables. Dichotomous variable ‘Ophthalmology department availability’ and ‘popula-tion density rates’ were defined as between-subject
vari-ables. The analysis was performed using IBM SPSS Statistics V.21.0.
RESULTS
The final sample included 98 408 hospital episodes.
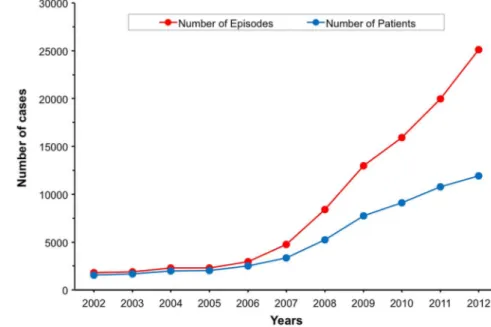
Figure 1 shows that the total number of episodes increased from 1815 in 2002 to 25 106 in 2012. This cor-responds to a mean annual increase of 32%.
In 2012, the number of treated patients was six times higher than in 2002, corresponding to a mean annual increase of 24%. The ratio number of episodes/number of patients was 1.16 in 2002, 1.17 in 2006 and 2.1 in 2012. The most relevant demographic information was the percentage of patients treated who were older than 60 years of age. Thefigures changed from about 60% in
2002 to 80% in 2012.
Figure 2shows thefive principal diagnoses responsible
for the episodes detected. The figure is expected to
provide a picture of the growth of the number of epi-sodes per year and number of patients treated per diag-nosis. The most common diagnosis was exudative AMD, followed by diabetic macular oedema (diabetes with ophthalmic complications), oedema of the retina, retinal neovascularization and non-specific AMD. The
cumulative percentage of episodes associated with these
five diagnoses was 73% in 2012, in contrast with only
16% in 2002. These values corresponded to an increase
in the yearly rates of hospital episodes per 100 000 indi-viduals from 17.4 in 2002 to 238.77 in 2012.
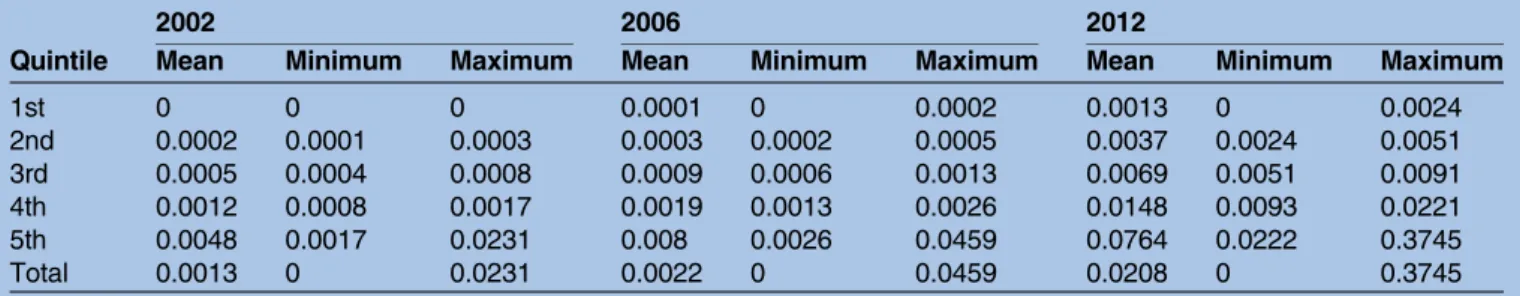
Table 1 gives a summary of the mean, minimum and maximum values in three specific years of the rates of
hospital episodes per 100 000 population. Both maximum and minimum rate values increased over time. The relative variation coefficient varied from 200%
in 2002, to 204% in 2006 and 209% in 2012. The relative coefficient of variation indicates that rates per county
have a great dispersion and that this dispersion did not reduce over time. Thefirst quintile always contains rates
equal to zero, which means that there are counties without events. In 2002, there were 58 counties in the
first quintile (without episodes). The number of
coun-ties without episodes reduced over time to 33 in 2006 and 3 in 2012. All the mean values per quintile rose in the period analysed.
Results of the regression analysis are summarised in table 2. In agreement with the initial prediction and consistent with the introduction of the new treatment with anti-VEGF, the model shows a significant effect of
the variable ‘year’, p<0.0001. For each additional year, the rate of hospital episodes increased by 28%. The rate was significantly higher after the EMA approval; table 2
shows results for ‘anti-VEGF therapy availability’,
p<0.0001. With the approval of this treatment, the rates of hospital episodes increased by 27%. The availability of an ophthalmology department in the hospital of the county (in table 2, results for ‘Ophthalmology depart-ment availability’) significantly increased the rates of
hospital episodes by 243%, p<0.0001 (compared with counties without). The positive association between the variable ‘Ophthalmology department availability’ and our dependent variable indicates that anti-VEGF treat-ments were more frequent for patients living near hospi-tals with ophthalmology departments, which are typically located in areas of median/high population density. There was a positive association between the dependent variable and population density. An increase of 100 persons per km2 raised the rates of hospital episodes by 11%. This results show that patients living in rural areas were less frequently treated.
DISCUSSION
With this study, we wanted to investigate the diffusion of anti-VEGF treatments for eye disease in Portugal looking for possible determinates and/or barriers. We per-formed this investigation by characterising the temporal and geographical distribution of anti-VEGF treatments Figure 2 Number of hospital
episodes associated with the top five diagnoses by year.
Table 1 Age-standardised rates of hospital episodes per 100 000 populations per county in the year 2002, 2006 and 2012
Quintile
2002 2006 2012
Mean Minimum Maximum Mean Minimum Maximum Mean Minimum Maximum
1st 0 0 0 0.0001 0 0.0002 0.0013 0 0.0024
2nd 0.0002 0.0001 0.0003 0.0003 0.0002 0.0005 0.0037 0.0024 0.0051
3rd 0.0005 0.0004 0.0008 0.0009 0.0006 0.0013 0.0069 0.0051 0.0091
4th 0.0012 0.0008 0.0017 0.0019 0.0013 0.0026 0.0148 0.0093 0.0221
5th 0.0048 0.0017 0.0231 0.008 0.0026 0.0459 0.0764 0.0222 0.3745
Total 0.0013 0 0.0231 0.0022 0 0.0459 0.0208 0 0.3745
using codes for specific type of procedures from all
epi-sodes performed in public hospitals. Our results show that the number of episodes for the codes analysed was low before the introduction of anti-VEGF treatments. The numbers of episodes rose significantly since the
treatment was introduced in the country in 2007. The most relevant finding was that patients from small areas
without ophthalmology departments near their resi-dence received fewer treatments as revealed by the geo-graphical distribution of episodes. The unequal distribution is puzzling, given the equity-oriented nature of the Portuguese NHS.
We consider three possible barriers for the equitable anti-VEGF diffusion related to legal, technical andfi
nan-cial factors. Following the EMA approval of this treat-ment in 2007 and the NHS coverage decision in 2008, the treatment became legally available at all ophthalmol-ogy departments in Portugal. One can thus say that the legal problem was sorted out. However, technical condi-tions were imposed for the use of this treatment that included extra training for doctors and that the proced-ure needed to be performed in the operation theatre.18 These technical requirements possibly created financial
and service capacity pressures on ophthalmology depart-ments.1 4 Indeed, higher rates of treatment were observed mostly in areas around big cities and specia-lised centres. Smaller hospitals may have taken longer to adopt this treatment due to budget limitations or tech-nical conditions. It should also be mentioned that anti-VEGF therapy was first introduced to treat AMD,
and then expanded to diabetic macular oedema and central retinal vein occlusion treatment. This certainly increased the rate of hospital episodes, but the effect is expected to be similar in all counties.
Regarding financial barriers, we can speculate about
two main budget limitations that reduced the speed of diffusion of anti-VEGF treatments. The first financial
challenge is the cost of the treatment of approximately
€1913 per episode, a figure similar to the USA.25 32 In
Portugal, hospitals receive a global budget from the gov-ernment that covers the cost of all drugs and medical
devices.18 During the period included in this study, the
financing methodology used to allocate resources to the
Portuguese NHS hospitals has been subject to several changes. This included the introduction of different unit payments and new incentive programmes that rely on quality and cost indicators. These changes to hospital budgets and pressure for cost containment may have reduced the availability of anti-VEGF treatments in small hospitals, concentrating patients in big centres with limited capacity. A second financial barrier for hospitals
is the fact that the intravitreal injections need to be administered in an operating room by an ophthalmolo-gist. Typically, patients receive three injections in the
first 3 months, followed by monthly visits for assessment
and further injections, as necessary.22 These surgical procedures and monthly appointments impose high demands on hospitals (staff and facilities). In a period of tight budgets, expansions in the medical staff or facil-ities are difficult to implement; these problems have
been recently reported by Marko Hawlina, a retinal spe-cialist form Slovenia, quoting results of a survey of the European Union of Medical Specialists.33 Thus, some hospitals may have delayed the start of these treatments or these may still not be available.
The reasons outlined above have implications for the geographical diffusion of the treatment leading to inequalities. Patients referred from distant cities or rural areas may have delayed access to treatments. The lower rate of treatments for patients living in areas of low population density may also indicate that these patients are more likely to miss follow-up appointments. Travelling distances may be a barrier to attending appointments as reported by other studies.34–36 These
findings are causes of concern because lost vision
caused by eye diseases for which anti-VEGF treatments are indicated cannot be restored. That is, reduced number of treatments might lead to an increased number of people becoming permanently visually impaired due to treatable causes.
During this study we found some limitations: the lack of specific codes for anti-VEGF injections, the inability to
Table 2 Results of the Generalised Estimating Equation for the rate of hospital episodes per 100 000 population per year and independent variables were: year, anti-VEGF therapy availability (separating years before and after the drug was authorised by EMEA); Ophthalmology department availability (representing the availability of ophthalmology departments in the hospitals of county of residence), and population density (population per km2in the county).
Parameter IRR* p Value
95% CI†
Lower Upper
Year (from 2002 to 2012) 1.281 <0.001 1.263 1.299
Anti-VEGF therapy availability (0—not available; 1—available) 1.270 <0.001 1.183 1.362 Ophthalmology department availability (0—no ophthalmology department;
1—ophthalmology department)
3.430 <0.001 2.566 4.583
Density rate (per 100 persons) 1.113 <0.001 1.095 1.132
Total number of counties is 278. *Incidence Rate Ratio.
†Waldχ2test of significance (95% CI).
follow patients across different years, the exclusion of the activity in the private sector and the absence of individual data. Limitations caused by non-specific codes have been
described in methods. The inability to follow patients across years might have had an impact on the ratio of epi-sodes/patient that we found. Nevertheless, the county of residence remained unchanged across years ensuring temporal and geographical accuracy of treatment diffu-sion. Other studies analysing equivalent temporal periods also report treatment ratios under 3 per year. These authors explained the low ratios by a higher concentra-tion of patients treated as required.1 Numbers from private treatments were likely to be small because this treatment is expensive and patients tend to look for care in the National Health System where treatment is almost free. The lack of individual data limited our analysis of socioeconomic determinants, such as patient income or education level or other clinical conditions that could restrict the prescription of anti-VEGF therapy. However, with the available data we were able to construct a complex and multivariable model to explain the geo-graphical diffusion and time variation based on a nation-ally representative database with many types of hospital settings and geographic areas; this would have been diffi
-cult to perform with a limited sample number of cases. In brief, the use of anti-VEGF drugs in ophthalmology marked the beginning of effective treatments for age-related eye diseases that can lead to severe visual impairment. This study shows that the number of intravi-treal procedures increased substantially since anti-VEGF treatments were approved in Portugal, but that the diffu-sion was inequitably distributed. Local restrictions to the temporal and geographical diffusion seem mostly imposed byfinancial aspects. Thesefinancial constraints
may arise not only from cuts in budgets in the health-care system but also from difficulties for families to fund
travel costs. With the ageing of the population and the expected growth in conditions, such as diabetic retinop-athy and age-related macular degeneration, the demand for these treatments is likely to increase.7 The combin-ation of these factors will maintain pressure on ophthal-mology departments delivering eye care. Health authorities need to consider equitable distribution when planning human and material resources for ophthalmol-ogy departments.
Author affiliations
1Escola Nacional de Saúde Pública, Universidade NOVA de Lisboa, Lisbon,
Portugal
2Vision Rehabilitation Lab, Departamento/Centro de Física, Universidade do
Minho, Braga, Portugal
3Centro de Investigação em Saúde Pública (CISP), Escola Nacional de Saúde
Pública, Universidade NOVA de Lisboa, Lisboa, Portugal
4Departamento de Órgãos dos Sentidos, Faculdade de Medicina da
Universidade do Porto, Alameda Professor Hernâni Monteiro, Porto, Portugal
AcknowledgementsThe authors would like to thank the Portuguese Health System Central Administration (ACSS) for providing the administrative database and Elizabeth Pearce for proof-reading of the manuscript.
Contributors APM, AFM and RM conceived and designed the study, collected and analysed the data, and drafted the manuscript. PA advised on the statistical analysis and the presentation of results. ARS participated in the design of the study, in the discussions and provided the clinical critical feedback. JP advised on the analysis and presentation of results, and provided critical feedback to the manuscript. All the authors revised the manuscript for important intellectual content, contributed to the data interpretation and writing, and critically reviewed the manuscript at all stages and approved the final copy. Funding This study was supported by FCT (COMPETE/QREN) grant reference PTDC/DPT-EPI/0412/2012 in the context of the Prevalence and Costs of Visual Impairment in Portugal: PC-VIP study.
Competing interests None declared.
Provenance and peer review Not commissioned; externally peer reviewed. Data sharing statement No additional data are available.
Open Access This is an Open Access article distributed in accordance with the Creative Commons Attribution Non Commercial (CC BY-NC 4.0) license, which permits others to distribute, remix, adapt, build upon this work non-commercially, and license their derivative works on different terms, provided the original work is properly cited and the use is non-commercial. See: http:// creativecommons.org/licenses/by-nc/4.0/
REFERENCES
1. Keenan TD, Wotton CJ, Goldacre MJ. Trends over time and geographical variation in rates of intravitreal injections in England.Br J Ophthalmol2012;96:413–18.
2. Moutray T, Chakravarthy U. Age-related macular degeneration: current treatment and future options.Ther Adv Chronic Dis
2011;2:325–31.
3. Rofagha S, Bhisitkul RB, Boyer DS,et al. Seven-year outcomes in ranibizumab-treated patients in ANCHOR, MARINA, and HORIZON: a multicenter cohort study (SEVEN-UP).Ophthalmology
2013;120:2292–9.
4. Brechner RJ, Rosenfeld PJ, Babish JD,et al. Pharmacotherapy for neovascular age-related macular degeneration: an analysis of the 100% 2008 medicare fee-for-service part B claims file.Am J Ophthalmol2011;151:887–95.e1.
5. Buitendijk GH, Rochtchina E, Myers C,et al. Prediction of age-related macular degeneration in the general population: the Three Continent AMD Consortium.Ophthalmology
2013;120:2644–55.
6. Klein R, Klein BE, Linton KL. Prevalence of age-related maculopathy. The Beaver Dam Eye Study.Ophthalmology
1992;99:933–43.
7. Rein DB, Wittenborn JS, Zhang X,et al. Forecasting age-related macular degeneration through the year 2050: the potential impact of new treatments.Arch Ophthalmol2009;127:533–40.
8. Singer MA, Awh CC, Sadda S,et al. HORIZON: an open-label extension trial of ranibizumab for choroidal neovascularization secondary to age-related macular degeneration.Ophthalmology
2012;119:1175–83.
9. Muñoz B, West SK, Rubin GS,et al. Causes of blindness and visual impairment in a population of older Americans: the Salisbury Eye Evaluation Study.Arch Ophthalmol2000;118:819–25.
10. Bonastre J, Le Pen C, Anderson P,et al. The epidemiology, economics and quality of life burden of age-related macular degeneration in France, Germany, Italy and the United Kingdom.
Eur J Health Econ2002;3:94–102.
11. Weih LM, VanNewkirk MR, McCarty CA,et al. Age-specific causes of bilateral visual impairment.Arch Ophthalmol2000;118:264–9. 12. Steinbrook R. The price of sight—ranibizumab, bevacizumab, and
the treatment of macular degeneration.N Engl J Med
2006;355:1409–12.
13. Coleman AL, Yu F, Ensrud KE,et al. Impact of age-related macular degeneration on vision-specific quality of life: follow-up from the 10-year and 15-year visits of the Study of Osteoporotic Fractures.
Am J Ophthalmol2010;150:683–91.
14. Wood JM, Lacherez P, Black AA,et al. Risk of falls, injurious falls, and other injuries resulting from visual impairment among older adults with age-related macular degeneration.Invest Ophthalmol Vis Sci2011;52:5088–92.
15. Gragoudas ES, Adamis AP, Cunningham ET Jr,et al. Pegaptanib for neovascular age-related macular degeneration.N Engl J Med
16. Lim LS, Mitchell P, Seddon JM,et al. Age-related macular degeneration.Lancet2012;379:1728–38.
17. Kodjikian L, Souied EH, Mimoun G,et al. Ranibizumab versus bevacizumab for neovascular age-related macular degeneration: results from the GEFAL noninferiority randomized trial.
Ophthalmology2013;120:2300–9.
18. Michels S, Becker M, Wachtlin J,et al. The intravitreal injection: variations in regulations, cost and reimbursement in Europe.
Spektrum Augenheilkd2012;26:2–6.
19. Zampros I, Praidou A, Brazitikos P,et al. Antivascular endothelial growth factor agents for neovascular age-related macular degeneration.J Ophthalmol2012;2012:319728. 20. Saeed MU, Gkaragkani E, Ali K. Emerging roles for
antiangiogenesis factors in management of ocular disease.Clin Ophthalmol2013;6:533–43.
21. Kovach JL, Schwartz SG, Flynn HW Jr,et al. Anti-VEGF treatment strategies for wet AMD.J Ophthalmol2012;2012:786870. 22. Thetford C, Hodge S, Harding S,et al. Living with age-related
macular degeneration treatment: patient experiences of being treated with ranibizumab (Lucentis)(R) intravitreal injections.Br J Vis Impairm2013;31:89–101.
23. Cheung N, Lam DS, Wong TY. Anti-vascular endothelial growth factor treatment for eye diseases.BMJ2012;344:e2970. 24. Stein JD, Hanrahan BW, Comer GM,et al. Diffusion of
technologies for the care of older adults with exudative age-related macular degeneration.Am J Ophthalmol2013;155:688–96, 696. e1–2.
25. Ip MS, Scott IU, Brown GC,et al. Anti–vascular endothelial growth factor pharmacotherapy for age-related macular degeneration: a report by the American Academy of Ophthalmology.
Ophthalmology2008;115:1837–46.
26. Ferris FL III, Wilkinson CP, Bird A,et al. Clinical classification of age-related macular degeneration.Ophthalmology
2013;120:844–51.
27. INE. Censos–Resultados definitivos. Portugal—2011, 2014 (cited 28 April 2014). http://www.ine.pt/xportal/xmain?
xpid=INE&xpgid=ine_publicacoes&PUBLICACOESpub_ boui=73212469&PUBLICACOESmodo=2
28. Beaghole R, Bonita R, Kjellstrom T.Basic epidemiology. Updated reprint ed. Geneva: World Health Organization, 1993.
29. Ballinger GA. Using generalized estimating equations for longitudinal data analysis.Organ Res Methods2004;7:127–50.
30. Ministry of Health.Portal da Saúde. Lisboa: Health Ministry, 2014 (cited 10 January 2014). http://www.portaldasaude.pt/portal 31. Azuero A, Pisu M, McNees P,et al. An application of longitudinal
analysis with skewed outcomes.Nurs Res2010;59:301–7. 32. Hutton D, Newman-Casey PA, Tavag M,et al. Switching to less
expensive blindness drug could save medicare part B $18 billion over a ten-year period.Health Aff (Millwood)2014; 33:931–9.
33. Hawlina M.UEMS survey highlights accessibility disparities, inconsistent policies for anti-VEGF treatment across Europe. Ocular Surgery News Europe Edition, 2015:5.
34. Koppens JM, Dai S, Mora J. Factors related to non-attendance in a public eye clinic.Clin Experiment Ophthalmol2005;33:553–4. 35. Larson SL, Fleishman JA. Rural-urban differences in usual source of
care and ambulatory service use: analyses of national data using urban influence codes.Med Care2003;41(Suppl 7): III65–74.
36. Ng M, Nathoo N, Rudnisky CJ,et al. Improving access to eye care: teleophthalmology in Alberta, Canada.J Diabetes Sci Technol
Portuguese National Health System
Diffusion of anti-VEGF injections in the
Aguiar, Amândio Rocha-Sousa and Rui Santana
Ana Patrícia Marques, António Filipe Macedo, Julian Perelman, Pedro
doi: 10.1136/bmjopen-2015-009006
2015 5:BMJ Open
http://bmjopen.bmj.com/content/5/11/e009006
Updated information and services can be found at:
These include:
Material
Supplementary
006.DC1
http://bmjopen.bmj.com/content/suppl/2015/11/23/bmjopen-2015-009
Supplementary material can be found at:
References
http://bmjopen.bmj.com/content/5/11/e009006#ref-list-1
This article cites 32 articles, 4 of which you can access for free at:
Open Access
http://creativecommons.org/licenses/by-nc/4.0/ non-commercial. See:
provided the original work is properly cited and the use is
non-commercially, and license their derivative works on different terms, permits others to distribute, remix, adapt, build upon this work
Commons Attribution Non Commercial (CC BY-NC 4.0) license, which This is an Open Access article distributed in accordance with the Creative
service
Email alerting
box at the top right corner of the online article.
Receive free email alerts when new articles cite this article. Sign up in the
Collections
Topic
Articles on similar topics can be found in the following collections(2402) Public health
(107) Ophthalmology
(1600) Health services research
(692) Health policy
Notes
http://group.bmj.com/group/rights-licensing/permissions
To request permissions go to:
http://journals.bmj.com/cgi/reprintform
To order reprints go to:
http://group.bmj.com/subscribe/