doi: 10.3389/fpls.2017.00307
Edited by: Bernd Mueller-Roeber, University of Potsdam, Germany
Reviewed by: Andrew Wood, Southern Illinois University Carbondale, USA Dirk K. Hincha, Max Planck Institute of Molecular Plant Physiology (MPG), Germany
*Correspondence: José C. Ramalho [email protected]; [email protected]
†
These authors have contributed equally to the work.
Specialty section: This article was submitted to Plant Abiotic Stress, a section of the journal Frontiers in Plant Science
Received:22 December 2016 Accepted:20 February 2017 Published:07 March 2017 Citation: Martins MQ, Fortunato AS, Rodrigues WP, Partelli FL, Campostrini E, Lidon FC, DaMatta FM, Ramalho JC and Ribeiro-Barros AI (2017) Selection and Validation of Reference Genes for Accurate RT-qPCR Data Normalization in Coffea spp. under a Climate Changes Context of Interacting Elevated [CO2] and Temperature. Front. Plant Sci. 8:307. doi: 10.3389/fpls.2017.00307
Selection and Validation of Reference
Genes for Accurate RT-qPCR Data
Normalization in
Coffea
spp. under a
Climate Changes Context of
Interacting Elevated [CO
2
] and
Temperature
Madlles Q. Martins1, 2 †, Ana S. Fortunato1 †, Weverton P. Rodrigues1, 3, Fábio L. Partelli4,
Eliemar Campostrini3, Fernando C. Lidon5, Fábio M. DaMatta6, José C. Ramalho1, 5* and
Ana I. Ribeiro-Barros1, 5
1Plant-Environment Interactions and Biodiversity Lab (PlantStress&Biodiversity), Linking Landscape, Environment, Agriculture
and Food, Departmento de Recursos Naturais, Ambiente e Território, Instituto Superior de Agronomia, Universidade de Lisboa (ULisboa), Oeiras, Portugal,2Programa de Pós-Graduação em Genética e Melhoramento, Centro de Ciências Agrárias e Engenharias, Universidade Federal do Espírito Santo, Alegre, Brazil,3Setor Fisiologia Vegetal, Centro de Ciências e Tecnologias Agropecuárias, Universidade Estadual Norte Fluminense-Darcy Ribeiro, Rio de Janeiro, Brazil,4Departmento de Ciências Agrárias e Biológicas, Centro Universitário Norte do Espírito Santo, Universidade Federal Espírito Santo, São Mateus, Brazil,5GeoBioTec, Departmento de Ciências da Terra, Faculdade de Ciências e Tecnologia, Universidade NOVA de Lisboa, Monte da Caparica, Portugal,6Departmento de Biologia Vegetal, Universidade Federal Viçosa, Viçosa, Brazil
World coffee production has faced increasing challenges associated with ongoing climatic changes. Several studies, which have been almost exclusively based on temperature increase, have predicted extensive reductions (higher than half by 2,050) of actual coffee cropped areas. However, recent studies showed that elevated [CO2]
can strongly mitigate the negative impacts of heat stress at the physiological and biochemical levels in coffee leaves. In addition, it has also been shown that coffee genotypes can successfully cope with temperatures above what has been traditionally accepted. Altogether, this information suggests that the real impact of climate changes on coffee growth and production could be significantly lower than previously estimated. Gene expression studies are an important tool to unravel crop acclimation ability, demanding the use of adequate reference genes. We have examined the transcript stability of 10 candidate reference genes to normalize RT-qPCR expression studies using a set of 24 cDNAs from leaves of three coffee genotypes (CL153, Icatu, and IPR108), grown under 380 or 700µL CO2 L−1, and submitted to increasing temperatures from
25/20◦C (day/night) to 42/34◦C. Samples were analyzed according to genotype, [CO
2],
temperature, multiple stress interaction ([CO2], temperature) and total stress interaction
(genotype, [CO2], and temperature). The transcript stability of each gene was assessed
use, followed by ACT and S15, whereas α-TUB and CYCL showed the least stable
mRNA contents. Using the coffee expression profiles of the gene encoding the large-subunit of ribulose-1,5-bisphosphate carboxylase/oxygenase (RLS), results from the in silico aggregation and experimental validation of the best number of reference genes showed that two reference genes are adequate to normalize RT-qPCR data. Altogether, this work highlights the importance of an adequate selection of reference genes for each single or combined experimental condition and constitutes the basis to accurately study molecular responses ofCoffeaspp. in a context of climate changes and global warming.
Keywords: climate changes, coffee, increased air [CO2], global warming, heat stress, normalization of transcriptomic studies, quantitative real-time PCR, reference genes
INTRODUCTION
Impacts from recent climate-related extremes, such as heat and cold waves, droughts and strong rainfall events, reveal remarkable vulnerability of agricultural systems. Estimated future climate changes are expected to further amplify the existing climate-related risks and create new ones (IPCC, 2013). Within this context, it is important to assess crop ability to adapt their vital processes at a speed compatible with these environmental changes, allowing the selection and breeding of elite genotypes.
Coffee is one of the most important agricultural traded commodities, growing in more than 60 tropical countries. It is estimated thatca. 25 million farmers produce coffee in over 1 million ha, with a majority of smallholders whose livelihoods depend on this crop (Waller et al., 2007). In the last years, worldwide crop yields were above 8 million tons of green coffee beans (ICO, 2014a), generating an income of ca. US$ 173,000 million (ICO, 2014b), and involving approximately 100 million people considering the entire chain of value of coffee (Bunn et al., 2015).
Coffee production and quality are highly dependent on a regular sequence of climate events; temperature and water availability are considered the most important limiting environmental variables to this crop (DaMatta and Ramalho, 2006). Also, several modeling studies on the global impact of climate changes, mostly focused on increased air temperatures, have predicted reductions of suitable areas for Arabica coffee (up to ca. 50%) by 2,050 (Bunn et al., 2015; Magrach and
Ghazoul, 2015), compromising the livelihoods of millions of
small householders.
Under field conditions, the superimposition of environmental events is the most common situation, as is expected to be the case of elevated [CO2] and enhanced temperatures predicted along this century. In fact, depending on anthropogenic greenhouse gas emission scenarios, [CO2] might reach between 421 and 936 µL CO2 L−1 by 2,100, accompanied by a global warming up to between 2.6 and 4.8◦C relative to 1986–2005 (IPCC, 2013, 2014). However, it was recently shown that increased [CO2] in the atmosphere strengthens the coffee plant by reinforcing its
Abbreviations:RT-qPCR, quantitative real-time polymerase chain reaction.
photosynthetic performance (Ramalho et al., 2013; Ghini et al.,
2015; DaMatta et al., 2016). Furthermore, enhanced [CO2] has
a crucial role in the mitigation of heat impact, and, therefore, in the resilience of coffee plant to supra-optimal temperatures, with positive repercussions ranging from mineral nutrition (Martins et al., 2014) to the triggering of defense mechanisms and altered gene expression (Martins et al., 2014; Rodrigues et al., 2016). Therefore, the catastrophic predictions on the future of the coffee crop, that are based almost exclusively on temperature drift
(Rodrigues et al., 2016), should be reconsidered. In addition,
results fromRodrigues et al. (2016)strongly suggest the need to study the single and superimposed effects of elevated [CO2] and supra-optimal temperatures at all plant levels, from morphology up to the molecular assessment.
The release of Coffea sp. expressed sequence tag (EST) databases (e.g.,Poncet et al., 2006; Vieira et al., 2006; Mondego
et al., 2011) and Coffea canephora genome
Goulao et al., 2012; Imai et al., 2014; da Costa et al., 2015; Llanos et al., 2015). However, their expression levels may vary with the experimental conditions (Petriccione et al., 2015), and their use as internal reference genes should be taken with caution (Gutierrez
et al., 2008a,b). For instance,GAPDHhas been indicated as one
of the most stable genes during single abiotic stresses (Tian et al., 2015), whereas it appeared to be the least stable gene during the plant development (Wang et al., 2016). In addition, the species-dependent stability of reference gene transcripts was observed, for example, inTUB-A, which is the most stable reference gene during celery development (Li et al., 2016) in contrast with what has been observed during the development of cherry (Ye et al., 2015).
In a context of advancing our knowledge regarding the plant responses to estimated climate changes and global warming, this work examined, for the first time, the transcript stability of candidate reference genes to accurately perform the normalization of RT-qPCR data from expression studies ofCoffea
spp. plants exposed to conditions mimicking predicted future environmental conditions. For that, single and combined impacts of elevated [CO2] and heat were considered.
MATERIALS AND METHODS
Plant Material and Growth Conditions
Plant materials and experimental design was previously described in detail (Rodrigues et al., 2016). Briefly, three widely cropped coffee genotypes from the two main producing species were used:Coffea arabicaL. cv. Icatu (an introgressed variety from
C. canephoraPierre ex A. Froehner),C. arabicaL. cv. IPR108,
andC. canephoracv. Conilon Clone 153 (CL153). Potted plants
of 1.5 years in age were transferred from a greenhouse (ambient [CO2]) into walk-in growth chambers (EHHF 10,000, ARALAB, Portugal) differing in air [CO2] supply: 380 µL CO2 L−1 (380-plants) or 700 µL CO2 L−1 (700-plants). Both groups of plants were then grown for 10 months in 28 L pots for
ca. 10 months under controlled environmental conditions of temperature (25/20◦C, day/night), RH (75%), irradiance (ca.
700–800µmol m−2s−1), photoperiod (12 h), without limitations of nutrients (Ramalho et al., 2013), water and space for root growth, the latter evaluated by visual examination at the end of the experiment, after removing the plants from their pots.
After that 10 months period, air temperature was gradually increased at a rate of 0.5◦C day−1, from 25/20◦C up to 42/34◦C,
with a 7 day stabilization at 31/25, 37/30 and 42/34◦C to perform
several evaluations (Martins et al., 2014, 2016; Rodrigues et al., 2016). Leaf material was collected from newly matured leaves, of both plagiotropic and orthotropic branches of the upper (illuminated) part of the plant, from five to eight plants per genotype and immediately frozen in liquid nitrogen and stored at−80◦C until RNA extraction.
Total RNA Isolation and cDNA Synthesis
Total RNA was isolated and quantified as described inGoulao
et al. (2012) for each of the following 24 conditions: three
genotypes (CL153, Icatu, IPR108), four temperature regimes (25/20◦C, 31/25◦C, 37/30◦C, 42/34◦C), and two [CO2] (380, 700 µL CO2 L−1), using the RNeasy Plant Mini Kit (Qiagen,
Germany) according to the manufacturer’s protocol. In order to avoid eventual genomic DNA contaminations, RNA samples were digested with AmbionR DNA-freeTM DNase (Ambion, USA). RNA integrity was verified in 1.5% agarose—TAE gel electrophoresis containing GelRed Nucleic Acid Gel Stain (Biotium, USA). All RNA samples were individually analyzed for the possible presence of DNA contamination by standard PCR reactions (35 cycles) using primers designed for ubiquitin (UBQ) gene (Table 1), in the absence of cDNA synthesis. Total RNA concentration and purity were further verified through BioDrop Cuvette (BioDrop, UK) measurements to guarantee the same amount of starting material in subsequent cDNA synthesis. RNA concentrations ranged between 333 and 1,056 ng/µl, with OD 260:280 ratios always above 1.98.
One microgram of DNA-free total RNA was used to synthesize first-strand cDNAs using oligo-(dT)18primer and the SuperScript II first-strand synthesis system (Invitrogen, USA).
Selection of Reference Gene Sequences
and Primer Design
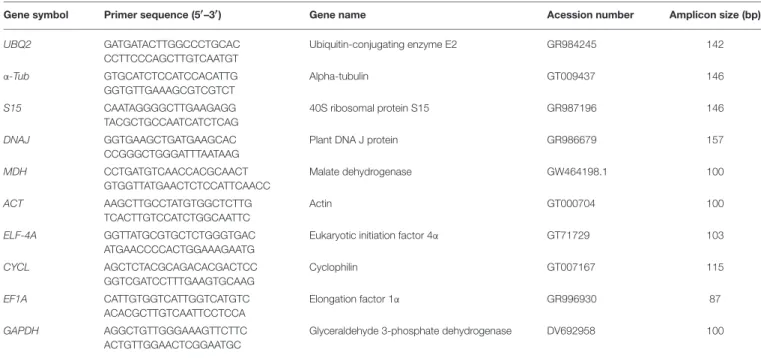
A set of 10 candidate genes were selected, comprising several frequently used reference genes, based on previous reports in (a) coffee plants (Cruz et al., 2009; Goulao et al., 2012; Carvalho et al., 2013): actin (ACT), glyceraldehyde 3-phosphate dehydrogenase (GAPDH), eukaryotic initiation factor 4α(Elf4A), elongation factor 1α (EF1A), cyclophilin (CYCL), and malate dehydrogenase (MDH); and (b) other plants (Cseke et al., 2009; El Kelish et al., 2014; Watanabe et al., 2014; Yan et al., 2014): 40S ribosomal protein subunit 15A (S15), DNAJ-like (DNAJ), ubiquitin-conjugating enzyme E2(UBQ2), and a alpha tubulin (α -TUB). The corresponding gene sequences were retrieved from published literature and the NCBI databases (Cruz et al., 2009; Vidal et al., 2010; Mondego et al., 2011; Goulao et al., 2012;
Carvalho et al., 2013). Primers were designed using Primer3
software (Rozen and Skaletsky, 2000). The length of the primers was set to be between 19 and 26 bp, with a GC content ranging from 45 to 60% and a melting temperature (Tm-value) between 62◦and 65◦C. Amplicon length ranges were set to be between 100 and 150 bp. The probability of formation of hairpin structures and primer dimerization was subsequently checked using the Oligo Calculator (version. 3.26) algorithm (Kibbe, 2007). Primer sequences are given inTable 1.
Quantitative Real-Time Polymerase Chain
Reaction Conditions
RT-qPCR reactions were performed in 96-well plates using iQTM SYBRR Green Supermix (BioRad, USA). Reactions were prepared in volumes of 25µl containing 150 ng of cDNA and 3 µM each primer, in 1×iQTMSYBRR Green Supermix. Reactions were run on the iQTM 5 Real-Time Detection System (BioRad, USA) using the following parameters: hot start activation of the TaqDNA polymerase at 95◦C for 10 min, followed by 40 cycles of denaturation 95◦C for 15 s; annealing at 60◦C for
30 s; elongation at 72◦C for 30 s; and plate read. To verify
TABLE 1 | Primer sequences and amplicon characteristics for each of the 10 candidate reference genes under evaluation.
Gene symbol Primer sequence (5′–3′) Gene name Acession number Amplicon size (bp)
UBQ2 GATGATACTTGGCCCTGCAC
CCTTCCCAGCTTGTCAATGT
Ubiquitin-conjugating enzyme E2 GR984245 142
α-Tub GTGCATCTCCATCCACATTG GGTGTTGAAAGCGTCGTCT
Alpha-tubulin GT009437 146
S15 CAATAGGGGCTTGAAGAGG
TACGCTGCCAATCATCTCAG
40S ribosomal protein S15 GR987196 146
DNAJ GGTGAAGCTGATGAAGCAC
CCGGGCTGGGATTTAATAAG
Plant DNA J protein GR986679 157
MDH CCTGATGTCAACCACGCAACT
GTGGTTATGAACTCTCCATTCAACC
Malate dehydrogenase GW464198.1 100
ACT AAGCTTGCCTATGTGGCTCTTG
TCACTTGTCCATCTGGCAATTC
Actin GT000704 100
ELF-4A GGTTATGCGTGCTCTGGGTGAC
ATGAACCCCACTGGAAAGAATG
Eukaryotic initiation factor 4α GT71729 103
CYCL AGCTCTACGCAGACACGACTCC
GGTCGATCCTTTGAAGTGCAAG
Cyclophilin GT007167 115
EF1A CATTGTGGTCATTGGTCATGTC ACACGCTTGTCAATTCCTCCA
Elongation factor 1α GR996930 87
GAPDH AGGCTGTTGGGAAAGTTCTTC
ACTGTTGGAACTCGGAATGC
Glyceraldehyde 3-phosphate dehydrogenase DV692958 100
technical replicates were used for each biological replicate and the mean Ct was used for data analyses. The full sample set was always included in each technical replicate to exclude any artifacts consequential of between-run variations. No signals were detected in non-template controls run in parallel for each primer set. Two negative controls were included for each primer pair, in which cDNA was replaced by water or total RNA.
Calculation of PCR Efficiencies
Five-fold serial dilutions (1:1–1:625) of pooled cDNAs, which included equal-molar quantities of all samples independently for each genotype, were quantified in triplicates to generate standard curves for each primer pair. Based on the slopes of the standard curves, the PCR efficiency of each gene, for each genotype, was determined from the respective logarithm of the cDNA dilution, plotted against the mean threshold cycle (Ct) values. The reaction efficiency was calculated using the equation: E (%)=(10−(1/slope)−1)×100 (da Costa et al., 2015), where E is the efficiency, in percentage, and slope is the gradient of the best-fit line in the linear regression.
Selection of Reference Genes
The global transcript variability of each candidate reference gene was analyzed through statistical parameters using Box Plot. The variation of gene expression was calculated by means of coefficient of variation (CV), whereCV =(standard deviation mean)×100. These analyzes were performed using the statistical program R Core Team (2016). In order to select the best reference genes for the experimental conditions, expression stability was analyzed using geNorm (Vandesompele et al., 2002), NormFinder (Andersen et al., 2004) and BestKeeper
(Pfaffl et al., 2004). The final rank of reference genes was
determined with the RefFinder program (Xie et al., 2012), a web-based user-friendly comprehensive tool that integrates geNorm, Normfinder, BestKeeper, and the comparative Ct method.
Determination of the Minimum Number of
Reference Genes for Data Normalization
The pairwise variations (V-values) were calculated using the final ranking determined by RefFinder, through pairwise variation (Vn/Vn+1) of two consecutively serial log2-transformed normalization factor (NF) ratios, based on stepwise addition of the subsequent more stable reference gene (NFn relative to NFn+1reference genes;Vandesompele et al., 2002). The SD of the array generated by the log2-transformed NF ratios was calculated for each NF combination (Vn/Vn+1). Vn/Vn+1were then plotted, representing changes in expression stability of NF. The optimal number of reference genes to exact standards was determined by calculating values as a pair of variation (Vn/Vn+ 1) between two normalization factors consecutively classified (NC) after the gradual addition of more subsequent stable reference gene (NFN and NFN+1), as proposed byVandesompele et al. (2002), included in GeNorm package. A cut off value<0.15 was adopted (da Costa et al., 2015; Niu et al., 2015; Petriccione et al., 2015; Yang et al., 2015).
Validation of Reference Gene Analysis
The evaluation of the transcript levels from the RLS gene, encoding the ribulose 1,5-bisphosphate carboxylase/oxygenase (RuBisCO) large subunit, along the imposed temperatures (25/20◦C, 31/25◦C, 37/30◦C, 42/34◦C), and under both growth
statistical analysis were performed using the REST 2,009 software developed by Pfaffl (Technical University Munich) and Qiagen (Germany). Rest analysis takes into account PCR efficiencies and normalization gene, using the test hypothesis P (H1), i.e., the probability of difference between target and control groups be by chance. P (H1) performs at least 2,000 times of random reallocations of target samples and controls between the groups. Statistical differences were considered significant whenP<0.001 (∗∗∗),P<0.01 (∗∗), andP<0.05 (∗).
RESULTS AND DISCUSSION
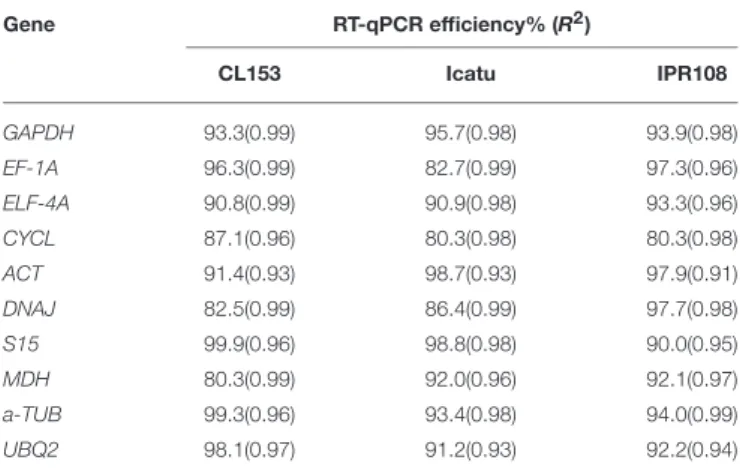
A total of 10 candidate genes (CG) to obtain an accurate validation of RT-qPCR data were assessed considering the individual comparison groups, i.e., genotype, [CO2] and temperature, multiple stress interaction ([CO2] and temperature) and total stress interaction (genotype, [CO2] and temperature). To determine the specificity of the primer pairs used in this study, melting curve analysis was performed after 40 cycles of amplification. The single peak obtained confirmed the specificity of the amplicon. No signal was detected in the negative controls of all tested primers. The standard curve method using a pool of all cDNA samples was performed to calculate RT-qPCR efficiency (E) and the correlation coefficient (R2) of each primer pair (Table 2). The raw quantification cycle (Ct) values ranged from 21.2 to 38.2 across all of the tested samples, with their minimal and maximal means falling between 24.1±1.8 and 34.1±2.1 (Figure 1). The results showed thatGAPDHandα-TUBwere the most and least abundantly expressed genes with mean Ct of 24.4 and 30.7, respectively.EF-1Ashowed the most variable levels of expression. Collectively, these results indicate that the transcript levels of the several candidate genes (CG) varied across different experimental samples confirming the need to screen the most appropriate reference genes for each experimental condition to accurately normalize RT-qPCR gene expression data. This result is common in plants given that most reference genes are involved in functions other than basal cell metabolism (Goulao et al., 2012; da Costa et al., 2015).
According to the Coefficient of Variation (CV) method, the most stable genes wereACT(for genotype and total stress,CV
=5.91 in both cases),UBQ2(for temperature,CV=5.50 and [CO2], CV = 5.71), and S15 (for multiple stress, CV =5.58; Table 3).EF-1Awas ranked as the least stable gene for genotype (CV =8.49), temperature (CV =8.34) and overall stress (CV
=8.49), ranking in the 6th place for [CO2] and multiple stress. DNAJandTUBwere the less stable genes for [CO2] (CV=9.68) and multiple stress treatments (7.95). Because the CV method alone is not sufficiently accurate to estimate the stability of the mRNA levels (Goulao et al., 2012), a complementary analysis was performed based on three algorithms, geNorm, NormFinder, and BestKeeper. According to the geNorm algorithm, the average expression stability (M-value) of all CG was below the default limit of 1.5 for genotype, temperature, [CO2] and their respective interactions, therefore indicating a considerable high stability level (Table 4). GAPDHwas consistently classified as the most stable gene for the five comparison groups whileCYCLwas the least stable gene for all groups with the exception of genotype,
TABLE 2 | Efficiency values and correlation coefficient for each candidate reference genes under evaluation.
Gene RT-qPCR efficiency% (R2)
CL153 Icatu IPR108
GAPDH 93.3(0.99) 95.7(0.98) 93.9(0.98)
EF-1A 96.3(0.99) 82.7(0.99) 97.3(0.96)
ELF-4A 90.8(0.99) 90.9(0.98) 93.3(0.96)
CYCL 87.1(0.96) 80.3(0.98) 80.3(0.98)
ACT 91.4(0.93) 98.7(0.93) 97.9(0.91)
DNAJ 82.5(0.99) 86.4(0.99) 97.7(0.98)
S15 99.9(0.96) 98.8(0.98) 90.0(0.95)
MDH 80.3(0.99) 92.0(0.96) 92.1(0.97)
a-TUB 99.3(0.96) 93.4(0.98) 94.0(0.99)
UBQ2 98.1(0.97) 91.2(0.93) 92.2(0.94)
whereMDH was the least sable gene. On the other hand, the ranking obtained with NormFinder was clearly dependent on the comparison group:MDHwas the most stable for genotype,
UBQ2for temperature,GAPDHfor [CO2] andELFAfor multiple and total stress groups. Such differences are due probably to different stability measures, i.e., while geNorm calculates gene expression stability based on the average pairwise expression ratio, NormFinder estimates the overall expression variation to provide individual stability values (Kozera and Rapacz, 2013). Nevertheless, similarly to geNorm, NormFinder also ranked
CYCLas the least stable gene for all groups, with the exception for genotype (whereα-TUB was the least stable CG).
In order to consolidate the data obtained with geNorm and NormFinder, we have included in the analysis the BestKeeper algorithm, which calculates the expression stabilities of the CG in accordance with SD and CV values. The calculated results classifiedACTas the most stable gene for the genotype (together with MDH) and S15 for the [CO2] group. For temperature, multiple stress and overall stress groups the most stable gene was
MDH.α-TUB, EF-1A, andCYCLwere ranked as the least stable
genes, always below the 6th place and usually in the three last positions. Despite the differences between the ranking obtained with the CV method and the three algorithms, which are related to the individual classification criteria,CYCLandα-TUBwere consistently ranked in the bottom five positions.
The consensus ranking obtained with RefFinder (Table 5), classifiedMDHas the most stable gene for all comparison groups, therefore constituting a good choice for the studies of Coffea
FIGURE 1 | Box plot representing the expression profiling variations of each candidate reference gene.The primer pairs of each gene were used to examine all samples (n=24;Table 1).Boxesindicate the 25th and 75th percentiles;lines across the boxrepresent the medianCt-values;whisker capsrepresent the minimum and maximum values; andspotsrepresent the outliers.
TABLE 3 | Ranking of candidate reference genes according to its coefficient of variation (CV%), considering the variables genotype, temperature, [CO2] and their interaction.
Rank Genotypes Temperature [CO2] Multiple stress Total stress
Gene CV Gene CV Gene CV Gene CV Gene CV
1 ACT 5.91 UBQ2 5.50 UBQ2 5.71 S15 5.58 ACT 5.91
2 ELF-4A 6.49 S15 5.82 ACT 5.73 ELF-4A 5.72 ELF-4A 6.49
3 S15 6.66 ACT 5.87 ELF-4A 5.76 ACT 6.19 S15 6.66
4 UBQ2 6.84 MDH 6.15 MDH 6.64 MDH 6.25 UBQ2 6.84
5 MDH 7.04 ELF-4A 6.38 S15 6.65 DNAJ 6.69 MDH 7.04
6 α-TUB 7.17 DNAJ 6.54 EF-1A 6.86 EF-1A 7.15 a-TUB 7.17
7 DNAJ 7.65 CYCL 6.75 α-TUB 6.96 CYCL 7.33 DNAJ 7.65
8 CYCL 7.68 GAPHD 6.93 CYCL 7.52 UBQ2 7.44 CYCL 7.68
9 GAPHD 8.45 α-TUB 7.22 GAPHD 8.94 GAPHD 7.74 GAPHD 8.45
10 EF-1A 8.49 EF-1A 8.34 DNAJ 9.68 α-TUB 7.95 EF-1A 8.49
the environmental stressful condition, again highlighting the importance of a proper and accurate selection of reference genes for each single experimental condition.
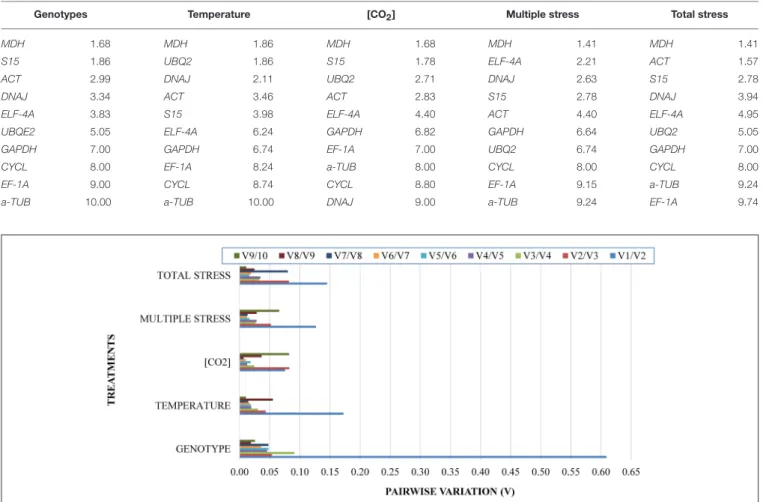
For all comparison groups at V2/V3 the Pairwise variation (V) value was already below 0.15 (Figure 2), indicating that the use of two genes guarantee a strong accuracy for the normalization of RT-qPCR data. It is noteworthy to mention that for all treatments the pairwise variation values were<0.10 (except for the use of just one reference gene), indicating low expression instability of the selected genes tested for these environmental conditions.
In order to validate the consensus ranking, we have examined the relative expression of RLS, encoding the large-subunit of RuBisCO. The choice of this enzyme was related to its central role in the C-assimilation pathway, considering that improved crop photosynthetic efficiency under high temperature might be achieved through the replacement of a number of candidate amino acid substitutions to improve RuBisCO performance (Orr
et al., 2016). Moreover, theRLSgene was selected based on the
fact that, according to structural-functional analyses, most of the important amino acid residues necessary for catalysis are present in the large subunits (Morita et al., 2014). The consensus ranking established by RefFinder identifiedMDH,UBQ2,andDNAJ as the best stable genes to temperature, whereasa-TUB,CYCLand
EF-1A where the least stable ones. Given that the increase in
atmospheric temperature has proven to be the most disturbing variable to metabolism performance, mineral nutrition and acclimation limitation under predicted future environmental conditions (Martins et al., 2014, 2016; Rodrigues et al., 2016), with particular strong negative implications to RuBisCO catalytic ability (Rodrigues et al., 2016), we decided to use the most/least stable genes to temperature forRLSvalidation.
TABLE 4 | Stability of candidate reference genes according to GeNorm, NormFinder and BestKeeper, considering the variables genotype, temperature, [CO2], and their interaction.
Group Ranking geNorm NormFinder BestKeeper
Gene Stability Gene Stability Gene R
Genotype 1 GAPDH 0.24 MDH 0.005 ACT 0.97***
2 ACT 0.26 DNAJ 0.009 MDH 0.97***
3 EF-1A 0.27 UBQ2 0.010 ELF-4A 0.96***
4 ELF-4A 0.28 S15 0.011 S15 0.95***
5 UBQ2 0.29 ELF-4A 0.013 DNAJ 0.93***
6 α-TUB 0.32 ACT 0.016 UBQ2 0.93***
7 S15 0.33 EF-1A 0.020 GAPDH 0.93***
8 CYCL 0.42 CYCL 0.026 CYCL 0.85***
9 DNAJ 0.53 GAPDH 0.027 α-TUB 0.82***
10 MDH 0.62 α-TUB 0.030 EF-1A 0.81**
Temperature 1 GAPDH 0.14 UBQ2 0.041 MDH 0.98***
2 UBQ2 0.14 ELF-4A 0.057 DNAJ 0.97***
3 ELF-4A 0.16 GAPDH 0.060 UBQ2 0.96***
4 ACT 0.16 DNAJ 0.071 ACT 0.96***
5 S15 0.17 EF-1A 0.076 S15 0.95***
6 α-TUB 0.17 α-TUB 0.082 ELF-4A 0.94***
7 DNAJ 0.18 ACT 0.083 EF-1A 0.92***
8 EF-1A 0.18 MDH 0.084 GAPDH 0.91***
9 MDH 0.19 S15 0.086 CYCL 0.86***
10 CYCL 0.37 CYCL 0.246 α-TUB 0.84***
[CO2] 1 GAPDH 0.15 GAPDH 0.019 CAS15 1.00***
2 UBQ2 0.16 ELF-4A 0.030 ACT 0.99***
3 ELF-4A 0.17 UBQ2 0.036 MDH 0.99***
4 S15 0.18 S15 0.070 ELF-4A 0.98***
5 α-TUB 0.18 EF-1A 0.076 UBQ2 0.98***
6 ACT 0.19 α-TUB 0.077 GAPDH 0.97***
7 EF-1A 0.19 ACT 0.082 DNAJ 0.94**
8 MDH 0.23 MDH 0.105 α-TUB 0.91*
9 DNAJ 0.31 DNAJ 0.180 EF-1A 0.91*
10 CYCL 0.53 CYCL 0.357 CYCL 0.47
Multiple stress 1 GAPDH 0.16 ELF-4A 0.028 MDH 0.97***
2 ELF-4A 0.16 UBQ2 0.053 DNAJ 0.96***
3 α-TUB 0.17 α-TUB 0.060 S15 0.96***
4 ACT 0.18 GAPDH 0.062 ELF -4A 0.96***
5 UBQ2 0.18 DNAJ 0.074 ACT 0.95***
6 S15 0.18 ACT 0.077 EF-1A 0.90***
7 DNAJ 0.20 S15 0.082 UBQ2 0.90***
8 MDH 0.21 MDH 0.094 GAPDH 0.88***
9 EF-1A 0.27 EF-1A 0.164 CYCL 0.83***
10 CYCL 0.43 CYCL 0.288 α-TUB 0.50*
Total stress 1 GAPDH 0.16 ELF-4A 0.040 MDH 0.97***
2 UBQ2 0.18 UBQ2 0.044 S15 0.96***
3 ELF-4A 0.18 GAPDH 0.055 ELF-4A 0.95***
4 S15 0.19 S15 0.085 ACT 0.95***
5 ACT 0.19 ACT 0.095 DNAJ 0.94***
6 α-TUB 0.22 DNAJ 0.105 UBQ2 0.93***
7 DNAJ 0.23 MDH 0.111 GAPDH 0.92***
8 MDH 0.23 α-TUB 0.112 CYCL 0.82***
9 EF-1A 0.24 EF-1A 0.123 EF-1A 0.79***
10 CYCL 0.44 CYCL 0.295 α-TUB 0.73***
TABLE 5 | Overall ranking of the most stable genes within each treatment made through RefFinder program, considering the variables genotype, temperature, [CO2] and their interaction.
Genotypes Temperature [CO2] Multiple stress Total stress
MDH 1.68 MDH 1.86 MDH 1.68 MDH 1.41 MDH 1.41
S15 1.86 UBQ2 1.86 S15 1.78 ELF-4A 2.21 ACT 1.57
ACT 2.99 DNAJ 2.11 UBQ2 2.71 DNAJ 2.63 S15 2.78
DNAJ 3.34 ACT 3.46 ACT 2.83 S15 2.78 DNAJ 3.94
ELF-4A 3.83 S15 3.98 ELF-4A 4.40 ACT 4.40 ELF-4A 4.95
UBQE2 5.05 ELF-4A 6.24 GAPDH 6.82 GAPDH 6.64 UBQ2 5.05
GAPDH 7.00 GAPDH 6.74 EF-1A 7.00 UBQ2 6.74 GAPDH 7.00
CYCL 8.00 EF-1A 8.24 a-TUB 8.00 CYCL 8.00 CYCL 8.00
EF-1A 9.00 CYCL 8.74 CYCL 8.80 EF-1A 9.15 a-TUB 9.24
a-TUB 10.00 a-TUB 10.00 DNAJ 9.00 a-TUB 9.24 EF-1A 9.74
FIGURE 2 | Pairwise variation analysis to determine the optimal number of reference genes for RT-qPCR data normalization.
group. Noticeably, due to the high SD of Ct values in many cases variations in RLSexpression along the stress imposition were not reported as statistically significant. The patterns ofRLS
expression were nearly the same in RT-qPCR reactions calibrated with two or three genes. Independently of the stability of RLS
mRNA, the increase in temperature generally resulted in up-regulation ofRLSexpression at standard [CO2] of 380µL CO2 L−1 in all genotypes, except in IPR108 at 31/25◦ and 37/30◦C whereRLSexpression was nearly the same as the control. For the 700 µL CO2 L−1 comparison group, the use of the most stable reference genes produced different results from those obtained with the least stable genes at 25/20◦and 31/25◦C. Thus,
when reactions were normalized with the most stable genes, a consistent decrease in the steady-state amounts ofRLSmRNA (which is the net result of transcription and degradation) was observed at these temperatures in all genotypes, while the use of the least stable genes indicated a positive regulation of RLS
expression. For 37/30◦C and 42/34◦C, normalization of RT-qPCR with the most or the least stable genes produced similar up-regulated expression patterns of RLS. Notably, such an up-regulation occurred when RuBisCO activity begin to decrease
(37/30◦C) or was severely depressed (42/34◦C) (Rodrigues et al., 2016). Such apparent discrepancy was also noted in chloroplastic ascorbate peroxidase (APX). APX activity was the most reduced (to about 10% of the control) at 42/34◦C among the studied
enzymes, contrasting to the largest increase inAPX transcripts amongst all studied genes (Martins et al., 2016). Such large increases in gene transcripts may be related to an attempt of the plants to compensate the severe decline of enzyme activity, and further highlights the need of integrated experiments that include gene expression and enzyme activity studies.
Given the facts described above, the reference genes used in this study were quite stable under the applied experimental conditions, as pairwise variation values were<0.10. The results obtained in the groups 700-25/20◦C and 700-31/25◦C call up for the importance to select the best reference genes. Altogether, despite the low instability ofa-TUB, CYCL,andEF-1A, the use of reference genes showing a high stability of their mRNA amount is the best option for the correct interpretation of data from transcriptional studies (Roy et al., 2011; Kozera and Rapacz, 2013). Also importantly, this corroborates with previous studies
TABLE 6 | Analysis ofRLSexpression by RT-qPCR, calibrated with the two most (MDHandUBQ2) and the two least (a-TUBandCYCL) genes for the temperature group/treatment.
Reference genes MDH and UBQ2 a-TUB and CYCL
Genotype Temperature [CO2] RLS expression RLS expression
CL 153 25/20◦C 380 1.00 1.00
700 0.361 1.768
31/25◦C 380 1.353 5.665
700 0.504 3.559
37/30◦C 380 1.581 12.556
700 1.467 12.86
42/34◦C 380 4.565 25.922
700 8.889 25.114
Icatu 25/20◦C 380 1.00 1.00
700 0.781 1.553
31/25◦C 380 1.900** 3.604*
700 1.505 2.546*
37/30◦C 380 3.423* 6.957*
700 2.776* 5.742*
42/34◦C 380 5.220* 19.923*
700 7.097* 32.153*
IPR 108 25/20◦C 380 1.00 1.00
700 0.249* 0.603
31/25◦C 380 0.778 1.345
700 0.801* 1.720*
37/30◦C 380 0.844 1.851***
700 1.070 2.172
42/34◦C 380 4.940* 21.732**
700 1.399 4.01
For sake of simplicity, only significant differences were indicated (***P<0.001;**P<0.01;
*P<0.05).
for an accurate RT-qPCR normalization should be performed accordingly to each for specific condition (Cruz et al., 2009; Goulao et al., 2012; Carvalho et al., 2013; Yuyama et al., 2016).
CONCLUSIONS
In summary, our study reinforces the importance of the
Minimum Information for Publication of Quantitative
Real-Time PCR Experiments(MIQE) guidelines (Bustin et al., 2009)
to normalize RT-qPCR data. The consensus ranking obtained with RefFinder showed that the transcript stability of the evaluated reference candidate genes changed according to the conditions/interactions, althoughMDH was the best one in all treatments, therefore, constituting a good common basis for RT-qPCR data normalization. However, the Pairwise variation analysis showed the need to use two reference genes, with the second most stable gene changing according to the genotypes and imposed environmental conditions:S15for genotype and [CO2], UBQ2 for temperature, EJF-4A for multiple stress, and ACT
for multiple stress. Using the expression profiles of coffeeRLS, results from thein silicoaggregation and experimental validation
TABLE 7 | Analysis ofRLSexpression by RT-qPCR, calibrated with the three most (MDH, UBQ2andDNAJ) and the three least (a-TUB, CYCLand EF-1A) genes for the temperature group/treatment.
Reference genes MDH, UBQ2, α-TUB, CYCL
and DNAJ and EF-1A
Genotype Temperature [CO2] RLS expression RLS expression
CL 153 25/20◦C 380 1.00 1.00
700 0.410 1,347
31/25◦C 380 1,424 2,780
700 0.522 1,747
37/30◦C 380 1,730 5,701
700 1,435 6,357
42/34◦C 380 4,214 10,853
700 6,527 10,782
Icatu 25/20◦C 380 1.00 1.00
700 0.744 1, 449
31/25◦C 380 1.608* 2.807**
700 1,215 2.170*
37/30◦C 380 2.726* 5.250*
700 2.219* 3.955*
42/34◦C 380 4.087* 9.637*
700 5.389* 12.979*
IPR 108 25/20◦C 380 1.00 1.00
700 0.249* 1, 059
31/25◦C 380 0.697* 1.307*
700 1,123 2.865*
37/30◦C 380 0.759 1,495
700 1, 093 3,453
42/34◦C 380 4.950* 11.012*
700 1,759 4,645
For sake of simplicity, only significant differences were indicated (***P<0.001;**P<0.01;
*P<0.05).
confirmed that the use of two reference genes is an adequate procedure to normalize RT-qPCR data.
AUTHOR CONTRIBUTIONS
According to their competences, all authors contributed transversally to the several stages of the work, including its design, data acquisition, analysis and interpretation, critically review of the manuscript, and approval of the submitted version. Furthermore, they agree to be accountable for all aspects of the work in ensuring that questions related to the accuracy or integrity of any part of the work were appropriately investigated and resolved.
FUNDING
through the grant SFRH/BPD/47563/2008 (AF) co-financed through the POPH program subsidized by the European Social Fund. Brazilian funding from CAPES (grants PDSE: 000427/2014-04, WR; 0343/2014-05, MM), CNPq and Fapemig (fellowships to FD, FP, and EC) are also greatly acknowledged.
ACKNOWLEDGMENTS
The authors would like to thank DELTA Cafés (Portugal) for technical assistance, and Profs. T. Sera (IAPAR) for supplying IPR108 material. Thanks are also due to M. Costa, and N. Duro, for technical help.
REFERENCES
Andersen, C. L., Jensen, J. L., and Orntoft, T. F. (2004). Normalization of real-time quantitative reverse transcription-PCR data: a model-based variance estimation approach to identify genes suited for normalization, applied to bladder and colon cancer data sets.Cancer Res.64, 5245–5250. doi: 10.1158/0008-5472.CAN-04-0496
Artico, S., Nardeli, S. M., Brilhante, O., Grossi-de-Sa, M. F., and Alves-Ferreira, M. (2010). Identification and evaluation of new reference genes in Gossypium hirsutum for accurate normalization of real time quantitative RT-PCR data. BMC Plant Biol.10:49. doi: 10.1186/1471-2229-10-49
Bunn, C., Läderach, P., Ovalle-Rivera, O., and Kirschke, D. (2015). A bitter cup: climate change profile of global production of Arabica and Robusta coffee. Clim. Change129, 89–101. doi: 10.1007/s10584-014-1306-x
Bustin, S. A., Benes, V., Garson, J. A., Hellemans, J., Huggett, J., Kubista, M., et al. (2009). The MIQE guidelines: minimum information for publication
of quantitative real-time PCR experiments. Clin. Chem. 55, 611–622.
doi: 10.1373/clinchem.2008.112797
Carvalho, K., Bespalhok Filho, J. C., dos Santos, T. B., de Souza, S. G., Vieira, L. G., Pereira, L. F., et al. (2013). Nitrogen starvation, salt and heat stress in coffee (Coffea arabicaL.): identification and validation of new genes for qPCR normalization.Mol. Biotechnol.53, 315–325. doi: 10.1007/s12033-012-9529-4 Cruz, F., Kalaoun, S., Nobile, P., Colombo, C., Almeida, J., Barros, L.,
et al. (2009). Evaluation of coffee reference genes for relative expression
studies by quantitative real-time RT–PCR. Mol. Breed. 23, 607–616.
doi: 10.1007/s11032-009-9259-x
Cseke, L. J., Tsai, C.-J., Rogers, A., Nelsen, M. P., White, H. L., Karnosky, D. F., et al. (2009). Transcriptomic comparison in the leaves of two aspen genotypes having similar carbon assimilation rates but different partitioning patterns under elevated [CO2]. New Phytol. 182, 891–911. doi: 10.1111/j.1469-8137.2009.02812.x
da Costa, M., Duro, N., Batista-Santos, P., Ramalho, J. C., and Ribeiro-Barros, A. I. (2015). Validation of candidate reference genes for qRT-PCR studies in symbiotic and non-symbioticCasuarina glaucaSieb. ex Spreng. under salinity conditions.Symbiosis66, 21–35. doi: 10.1007/s13199-015-0330-6
DaMatta, F. M., Godoy, A. G., Menezes-Silva, P. E., Martins, S. C. V., Sanglard, L. M. V. P., Morais, L. E., et al. (2016). Sustained enhancement of photosynthesis in coffee trees grown under free-air CO2enrichment conditions: disentangling the contributions of stomatal, mesophyll, and biochemical limitations.J. Exp. Bot.67, 341–352. doi: 10.1093/jxb/erv463
DaMatta, F. M., and Ramalho, J. C. (2006). Impacts of drought and temperature stress on coffee physiology and production: a review.Theor. Exp. Plant Physiol. 18, 55–81. doi: 10.1590/S1677-04202006000100006
Die, J. V., Román, B., Nadal, S., and González-Verdejo, C. I. (2010). Evaluation of candidate reference genes for expression studies in Pisum sativum under different experimental conditions. Planta 232, 145–153. doi: 10.1007/s00425-010-1158-1
El Kelish, A., Zhao, F., Heller, W., Durner, J., Winkler, J. B., Behrend, H., et al. (2014). Ragweed (Ambrosia artemisiifolia) pollen allergenicity: SuperSAGE transcriptomic analysis upon elevated CO2and drought stress.BMC Plant Biol. 14:176. doi: 10.1186/1471-2229-14-176
Ghini, R., Torre-Neto, A., Dentzien, A. F. M., Guerreiro-Filho, O., Lost, R., Patrício, F. R. A., et al. (2015). Coffee growth, pest and yield responses to free-air CO2enrichment.Clim. Chang.132, 307–320. doi: 10.1007/s10584-015-1422-2
Goulao, L. F., Fortunato, A. S., and Ramalho, J. C. (2012). Selection of reference genes for normalizing quantitative real-time PCR gene expression data
with multiple variables in Coffea spp. Plant Mol. Biol. Rep.30, 741–759. doi: 10.1007/s11105-011-0382-6
Gutierrez, L., Mauriat, M., Guenin, S., Pelloux, J., Lefebvre, J.-F., Louvet, R., et al. (2008b). The lack of a systematic validation of reference genes: a serious pitfall undervalued in reverse transcription-polymerase chain reaction (RT-PCR) analysis in plants. Plant Biotechnol. J. 6, 609–618. doi: 10.1111/j.1467-7652.2008.00346.x
Gutierrez, L., Mauriat, M., Pelloux, J., Bellini, C., and van Wuytswinkel, O. (2008a). Towards a systematic validation of references in real-time RT-PCR.Plant Cell 20, 1734–1735. doi: 10.1105/tpc.108.059774
ICO (2014a). Trade Statistics. Available online at:
http://www.ico.org/trade_statistics.asp (Accessed July 2016)
ICO (2014b). World coffee trade (1963–2013): A Review of the
Markets, Challenges and Opportunities Facing the Sector. ICC (International Coffee Council),111–115 Rev. 1, 29p. Available online at: http://www.ico.org/show_news.asp?id=361 (Accessed July 2016)
Imai, T., Ubi, B. E., Saito, T., and Moriguchi, T. (2014). Evaluation of reference genes for accurate normalization of gene expression for real time-quantitative PCR in Pyrus pyrifoliausing different tissue samples and seasonal conditions. PLoS ONE9:e86492. doi: 10.1371/journal.pone.0086492
IPCC (2013). “Climate change 2013,” inThe Physical Science Basis. Summary for Policymakers, Technical Summary and Frequent Asked Questions. Part of the Working Group I Contribution to the Fifth Assessment Report of the Intergovernmental Panel on Climate Change, eds T.F. Stocker, D. Qin, G. K. Plattner, M. M. B. Tignor, S. K. Allen, and J. Boschung, et al. (Intergovernmental Panel on Climate Change), 203.
IPCC (2014). “Climate change 2014,” in Mitigation of Climate Change.
Contribution of Working Group III to the Fifth Assessment Report of the Intergovernmental Panel on Climate Change, eds O. Edenhofer, R. Pichs-Madruga, Y. Sokona, E. Farahani, S. Kadner, and K. Seyboth, et al. (Cambridge, New York, NY: Cambridge University Press), 1435.
Kibbe, W. A. (2007). OligoCalc: an online oligonucleotide properties calculator. Nucl. Acids Res.35, W43–W46. doi: 10.1093/nar/gkm234
Kozera, B., and Rapacz, M. (2013). Reference genes in real-time PCR.J. Appl. Gen. 54, 391–406. doi: 10.1007/s13353-013-0173-x
Li, M. Y., Wang, F., Jiang, Q., Wang, G. L., Tian, C., and Xiong, A. S. (2016). Validation and comparison of reference genes for qPCR normalization of celery (Apium graveolens) at different development stages.Front. Plant Sci.7:313. doi: 10.3389/fpls.2016.00313
Llanos, A., François, J. M., and Parrou, J. L. (2015). Tracking the best reference genes for RT-qPCR data normalization in filamentous fungi.BMC Genomics. 16:71. doi: 10.1186/s12864-015-1224-y
Magrach, A., and Ghazoul, J. (2015). Climate and pest-driven geographic shifts in global coffee production: implications for forest cover, biodiversity and carbon storage.PLoS ONE10:e0133071. doi: 10.1371/journal.pone.0133071 Mallona, I., Lischewski, S., Weiss, J., Hause, B., and Egea-Cortines, M.
(2010). Validation of reference genes for quantitative realtime PCR during leaf and flower development in Petunia hybrida. BMC Plant Biol. 10:4. doi: 10.1186/1471-2229-10-4
Martins, L. D., Tomaz, M. A., Lidon, F. C., DaMatta, F. M., and Ramalho, J. C. (2014). Combined effects of elevated [CO2] and high temperature on leaf mineral balance inCoffeaspp. plants.Clim. Chang.126, 365–379. doi: 10.1007/s10584-014-1236-7
Mondego, J. M., Vidal, R. O., Carazzolle, M. F., Tokuda, E. K., Parizzi, L. P., Costa, G. G., et al. (2011). An EST-based analysis identifies new genes and reveals distinctive gene expression features ofCoffea arabicaandCoffea canephora. BMC Plant Biol.11:30. doi: 10.1186/1471-2229-11-30
Morita, K., Hatanaka, T., Misoo, S., and Fukayama, H. (2014). Unusual small subunit that is not expressed in photosynthetic cells alters the catalytic properties of rubisco in rice. Plant Physiol. 164, 69–79. doi: 10.1104/pp.113.228015
Niu, X., Qi, J., Zhang, G., Xu, J., Tao, A., Fang, P., et al. (2015). Selection of reliable reference genes for quantitative real-time PCR gene expression analysis in Jute (Corchorus capsularis) under stress treatments.Front. Plant Sci.6:848. doi: 10.3389/fpls.2015.00848
Orr, D. J., Alcβntara, A., Kapralov, M. V., Andralojc, P. J., Carmo-Silva, E., and Parry, M. A. J. (2016). Surveying rubisco diversity and temperature response to improve crop photosynthetic efficiency. Plant Physiol. 172, 707–717. doi: 10.1104/pp.16.00750
Petriccione, M., Mastrobuoni, F., Zampella, L., and Scortichini, M. (2015). Reference gene selection for normalization of RT-qPCR gene expression data from Actinidia deliciosa leaves infected withPseudomonas syringaepv. actinidiae.Sci. Rep.5:16961. doi: 10.1038/srep16961
Pfaffl, M. W., Tichopad, A., Prgomet, C., and Neuvians, T. P.
(2004). Determination of stable housekeeping genes, differentially
regulated target genes and sample integrity: bestkeeper -
excel-based tool using pair-wise correlations. Biotechnol. Lett. 26, 509–515. doi: 10.1023/B:BILE.0000019559.84305.47
Poncet, V., Rondeau, M., Tranchant, C., Cayrel, A., Hamon, S., De Kochko, A., et al. (2006). SSR mining in coffee tree EST databases: potential use of EST-SSRs as markers for the Coffea genus.Mol. Genet. Genomics276, 436–449. doi: 10.1007/s00438-006-0153-5
Ramalho, J. C., Rodrigues, A. P., Semedo, J. N., Pais, I. P., Martins, L. D., Simões-Costa, M. C., et al. (2013). Sustained photosynthetic performance of Coffea spp. under long-term enhanced [CO2]. PLoS ONE 8: e82712. doi: 10.1371/journal.pone.0082712
R Core Team (2016).R: A Language and Environment for Statistical Computing. R Foundation for Statistical Computing, Vienna. Available online at: https://www.R-project.org (Accessed November 2016).
Rodrigues, W. P., Martins, M. Q., Fortunato, A. S., Rodrigues, A. P., Semedo, J. N., Simões-Costa, M. C., et al. (2016). Long-term elevated air [CO2] strengthens photosynthetic functioning and mitigates the impact of supra-optimal temperatures in tropicalCoffea arabicaandC. canephoraspecies.Glob. Change Biol.22, 415–431. doi: 10.1111/gcb.13088
Roy, S. J., Tucker, E. J., and Tester, M. (2011). Genetic analysis of abiotic stress tolerance in crops. Curr. Opin. Plant Biol. 14, 232–239. doi: 10.1016/j.pbi.2011.03.002
Rozen, S., and Skaletsky, H. (2000). “Bioinformatics methods and protocols: methods,” inMolecular Biology, Chapter 20, Primer3 on the WWW for general users and for biologist programmers, eds S. Krawetz and S. Misener (Totowa, NJ: Humana), 365–386.
Tian, C., Jiang, Q., Wang, F., Wang, G. L., Xu, Z. S., and Xiong, A. S. (2015). Selection of suitable reference genes for qPCR normalization under abiotic stresses and hormone stimuli in carrot leaves.PLoS ONE10:e0117569. doi: 10.1371/journal.pone.0117569
Vandesompele, J., De Preter, K., Pattyn, F., Poppe, B., Van Roy, N., De Paepe, A., et al. (2002). Accurate normalization of real-time quantitative RT-PCR data by geometric averaging of multiple internal control genes.Genome Biol. 3, research0034.1–research0034.11. doi: 10.1186/gb-2002-3-7-research0034
Vidal, R. O., Mondego, J. M. C., Pot, D., Ambrósio, A. B., Andrade, A. C., Pereira, L. F. P., et al. (2010). A high-throughput data mining of single nucleotide polymorphisms in coffea species expressed sequence tags suggests differential homeologous gene expression in the allotetraploidCoffea arabica. Plant Physiol. 154, 1053–1066. doi: 10.1104/pp.110.162438
Vieira, L. G. E., Andrade, A. C., Colombo, C. A., Moraes, A. A. H., Metha, A., Oliveira, A. C., et al. (2006). Brazilian coffee genome project: an EST-based genomic resource. Theor. Exp. Plant Physiol. 18, 95–108. doi: 10.1590/S1677-04202006000100008
Waller, J. M., Bigger, M., and Hillocks, R. J. (2007). “Coffee pests, diseases and their management,” inWorld Coffee Production,Chapter 2. eds J. M. Waller, M. Bigger, and R.J. Hillocks (Egham; Surrey, BC: CAB International,) 17–40.
Wang, G. L., Tian, C., Jiang, Q., Xu, Z. S., Wang, F., and Xiong, A. S. (2016). Comparison of nine reference genes for real-time quantitative PCR in roots and leaves during five developmental stages in carrot (Daucus carotaL.).J. Hortic. Sci. Biotechnol.91, 264–270. doi: 10.1080/14620316.2016.1148372
Watanabe, C. K., Sato, S., Yanagisawa, S., Uesono, Y., Terashima, I., and Noguchi, K. (2014). Effects of elevated CO2 on levels of primary metabolites and transcripts of genes encoding respiratory enzymes and their diurnal patterns inArabidopsis thaliana: possible relationships with respiratory rates.Plant Cell Physiol.55, 341–357. doi: 10.1093/pcp/pct185
Willems, E., Leyns, L., and Vandesompele, J. (2008). Standardization of real-time PCR gene expression data from independent biological replicates.Anal. Biochem.379, 127–129. doi: 10.1016/j.ab.2008.04.036
Xie, F., Xiao, P., Chen, D., Xu, L., and Zhang, B. (2012). miRDeepFinder: a miRNA analysis tool for deep sequencing of plant small RNAs.Plant Mol. Biol.80, 75–84. doi: 10.1007/s11103-012-9885-2
Yan, X., Dong, X., Zhang, W., Yin, H., Xiao, H., Chen, P., et al. (2014). Reference gene selection for quantitative Real-Time PCR normalization inReaumuria soongorica.PLoS ONE9:e104124. doi: 10.1371/journal.pone. 0104124
Yang, C., Pan, H., Noland, J. E., Zhang, D., Zhang, Z., Liu, Y., et al. (2015). Selection of reference genes for RT-qPCR analysis in a predatory biological control agent,Coleomegilla maculata(Coleoptera: Coccinellidae).Sci. Rep.5:18201. doi: 10.1038/srep18201
Ye, X., Zhang, F., Tao, Y., Song, S., and Fang, J. (2015). Reference gene selection for quantitative real-time PCR normalization in different cherry genotypes, developmental stages and organs. Sci. Hortic. 181, 182–188. doi: 10.1016/j.scienta.2014.10.027
Yuyama, P. M., Reis Júnior, O., Ivamoto, S. T., Domingues, D. S., Carazzolle, M. F., Pereira, G. A., et al. (2016). Transcriptome analysis in Coffea eugenioides, an Arabica coffee ancestor, reveals differentially expressed genes in leaves and fruits.Mol. Genet. Genomics291, 323–336. doi: 10.1007/s00438-015-1111-x
Conflict of Interest Statement: The authors declare that the research was conducted in the absence of any commercial or financial relationships that could be construed as a potential conflict of interest.
![TABLE 3 | Ranking of candidate reference genes according to its coefficient of variation (CV%), considering the variables genotype, temperature, [CO 2 ] and their interaction.](https://thumb-eu.123doks.com/thumbv2/123dok_br/16699516.743949/6.892.67.827.513.753/candidate-reference-according-coefficient-variation-considering-temperature-interaction.webp)
![TABLE 4 | Stability of candidate reference genes according to GeNorm, NormFinder and BestKeeper, considering the variables genotype, temperature, [CO 2 ], and their interaction.](https://thumb-eu.123doks.com/thumbv2/123dok_br/16699516.743949/7.892.65.827.124.1055/stability-candidate-reference-normfinder-bestkeeper-considering-temperature-interaction.webp)