Setembro 2015
João Miguel Ramalho Fidalgo Rosa
Licenciatura em Ciências de Engenharia de Micro e Nanotecnologias
Study of Gold Nanoparticle Assisted
Neuron Stimulation
Dissertação para obtenção do Grau de Mestre em Engenharia de Micro e Nanotecnologias
Orientador: Adam R. Kampff, Principal Investigator, Intelligent Systems Lab
Co-orientador: Elvira Fortunato, Professora Doutora, Faculdade de Ciências e Tecnologia da Universidade Nova de Lisboa
Study of Gold Nanoparticle Assisted Neuron Stimulation.
Copyright © João Miguel Ramalho Fidalgo Rosa, Faculdade de Ciências e Tecno-logia, Universidade Nova de Lisboa.
“The brain is a world consisting of a number of unexplored continents and great stretches of unknown territory.”
Santiago Ramón y Cajal,
Acknowledgements
I would like to thank everyone in my life during the long months that sep-arated the time when I first started thinking about the project I wanted to pursue and the time when I wrote these words. It has been a thriving journey: often scary, dangerous and utterly unpredictable at times; but fun, rewarding and ex-citing nonetheless. There are many people not mentioned here, for which I am
deeply sorry, but I know that you’ll know who you are.
First of all, I want to thank Joana Neto for the amazing opportunity that these months have presented me: for introducing me to Dr. Adam Kampff and making this dissertation possible, for always being there whenever needed, for never giving up on a seemingly hopeless experiment and for just being a tire-lessly wonderful person. Without her, none of these pages would be here.
To Dr. Adam Kampff for the opportunity, guidance, positivity and all the learning experiences his ever-present constructive criticism and novel, practical ideas provided me with.
To Prof. Elvira Fortunato and Prof. Rodrigo Martins for the guidance dur-ing the last five years, and for builddur-ing, in the university, a great network of re-search, projects and people; without which these pages would also not be here.
To Júlio Costa and Nuno Coelho, who have accompanied me in this journey since the start and up until the very end. Clearly this experience would not have been remotely as good as it was had it not been shared with you guys.
To everyone in the Intelligent Systems Lab, who helped whenever possible and always had something incredibly interesting to talk about. Particularly to George Dimitriadis, who was a great, tireless help during the starting months of research; João Frazão, Pedro Lacerda, Lorenza Calcaterra and Athabak Dehban for the company, fun and support.
To everyone in the Champalimaud Center for the Unknown, particularly those who lended us essential equipment without which this research would not be possible; particularly Niccolò Bonacchi, Rodrigo Dias and Tiago Monteiro.
To my family, who made me the person I am today: I’m sorry for all the
dinners I’ve lost because of lasers, gold nanoparticles and writing this document. You’ve been an invaluable support for all these 23 years.
To my girlfriend, Sofia Jacinto, for keeping me sane, positive and cheerful even in the darkest of times. I suspect that without you, these pages would be much harder.
To my close friends, both from my hometown and from university: Tiago Pestana, Cátia Costa, Diogo Vaz, Afonso Ferreira, João Jacinto, Rui Carreiras, Raquel Barras and too many others to include, as well as the already mentioned
Júlio and Nuno. You’ve been the best company one could wish for during all
Abstract
The unique proprieties exhibited by nanoscale particles compared to their macro size counterparts allow for the creation of novel neural activity manipula-tion procedures. In this sense, gold nanoparticles (AuNPs) can be used to stimu-late the electrical activity of neuron by converting light into heat.
During this dissertation, AuNPs are synthesized by the citrate reduction method, resulting in a hydrodynamic diameter of approximately 16 nm and an absorbance peak of 530 nm. A system to control a 532 nm laser and measure the temperature variation was custom built from scratch specifically for this project. Temperature is then measured with recourse to a thermocouple and through changes in impedance. The built system had in consideration the necessities pre-sented by in vivo tests.
Trials were performed by measuring the temperature rise of colloidal AuNP solutions, having the temperature variation reached a maximum of ap-proximately 18 ºC relative to control trials; successfully showing that light is ef-fectively transduced into heat when AuNPs are present.
This novel approach enables an alternative to optogenetics, which require the animal to be genetically modified in order to allow neuron stimulation.
Resumo
As propriedades singulares apresentadas pelas partículas à escala nano quando comparadas com as suas contrapartes de tamanho macro permitem que novos procedimentos para a manipulação da atividade neuronal sejam criadas. Neste sentido, nanopartículas de ouro (AuNPs) podem ser utilizadas para esti-mular a atividade elétrica de neurónios ao converterem luz em calor.
Durante este trabalho, as AuNPs são sintetizadas pelo método de redução de citrato, resultando num diâmetro hidrodinâmico de aproximadamente 16 nm com um pico de absorvância em 530 nm. Um sistema para controlar um laser de 532 nm e medir a variação de temperatura foi construído de raiz especificamente para este trabalho. A temperatura é então medida com recurso a um termopar e através da variação de impedância. O sistema construído teve em consideração as necessidades apresentadas pelos testes in vivo.
Os testes foram efetuados ao medir as mudanças de temperatura apresen-tadas por soluções coloidais de AuNPs, atingindo estas variações um máximo de aproximadamente 18 ºC face a testes controlo, mostrando efetivamente que a luz é convertida em calor na presença de AuNPs.
Esta nova aproximação a este tema possibilita uma alternativa à optogené-tica, que requer que o animal seja geneticamente modificado de modo a permitir a estimulação neuronal.
Index
INTRODUCTION ... 11
1.1. The Brain ... 11
1.2. Neural Activity Stimulation ... 14
1.3. Unmodified-Neuron Optical Stimulation ... 16
1.4. Gold Nanoparticle Photothermal Stimulation ... 17
1.5. Summary ... 17
METHODS ... 19
2.1. Synthesis of gold nanoparticles... 19
2.2. Gold Nanoparticle Characterization ... 19
2.2.1. Dynamic Light Scattering ... 20
2.2.2. Absorption Spectra ... 20
2.3. Agar Preparation ... 20
2.4. Laser Heating ... 20
2.4.1. Optical Fiber Setup (Laser #1) ... 20
2.4.2. Collimated Beam Setup (Laser #2) ... 21
2.4.3. Temperature Calibration ... 23
RESULTS AND ANALYSIS ... 24
3.1. Gold Nanoparticle Characterization ... 24
3.1.1. Particle Size ... 24
3.1.2. Absorbance Spectrum ... 24
3.2. Optical Fiber Setup (Laser #1) ... 25
3.3. Collimated Beam Setup (Laser #2) ... 29
3.3.1. Laser Setup ... 29
3.3.2. Photothermal Stimulation of AuNP Solution ... 30
3.3.3. Agar Injection ... 31
3.3.4. Photothermal Stimulation of AuNPs in Agar... 33
3.3.5. Laser Power ... 34
CONCLUSIONS AND FUTURE PERSPECTIVES ... 36
REFERENCES ... 40
vii
Index of Figures
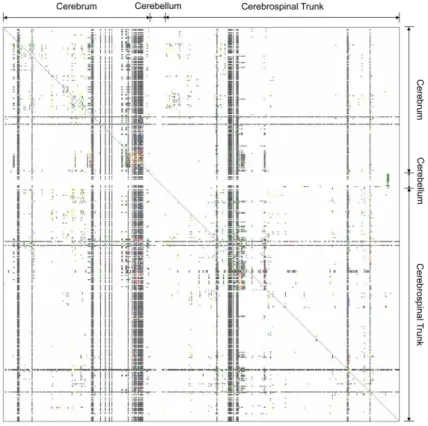
Figure 1 – Matrix displaying curated projection information about sections of the rat brain from
several projects. White areas represent areas where information is unavailable, while black
areas represent connection absence. The different colors indicate the strength of found
projections. The entire matrix is only 10.45% filled, reflecting how little information there
is available. Adapted from [1]. ... 12
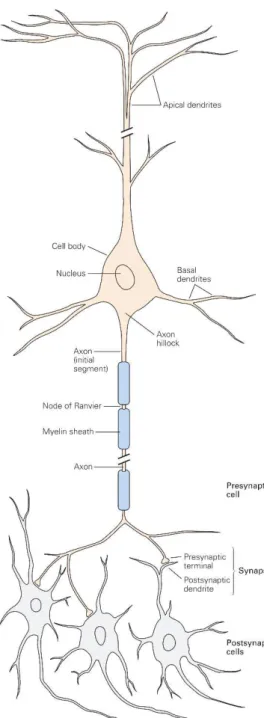
Figure 2 - Representation of a typical neuron and its postsynaptic neighbors. Adapted from [2].
... 13
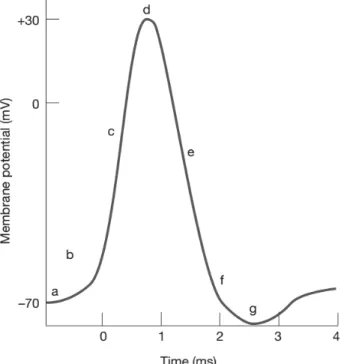
Figure 3 – Representation of a typical action potential signal where (a) represents the resting
potential of the cell; (b) is the time the depolarization event starts and membrane
permeability to Na+ occurs; (c) at this point both Na+ and K+ channels are open, Na+
rushing into the cell; (d) point at which the Na+ channels close; (e) K+ flows out of the cell;
(f) closing of K+ channels; and (g) refractory period. Adapted from [3]. ... 14
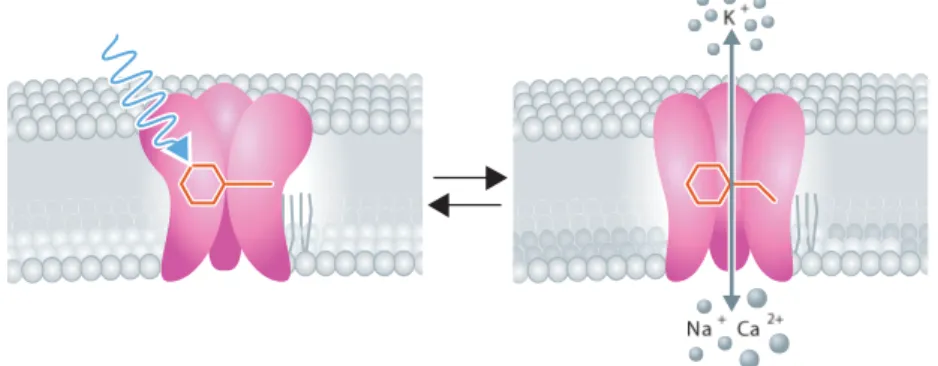
Figure 4 – Representation of channelrhodopsins as light-gated ion channels: incident radiation
hits the closed channel in the cell membrane, an isomerization of its covalently bound
retinal causes the channel to open, and allows ion flow (and, henceforth, membrane
depolarization). Adapted from [13]. ... 15
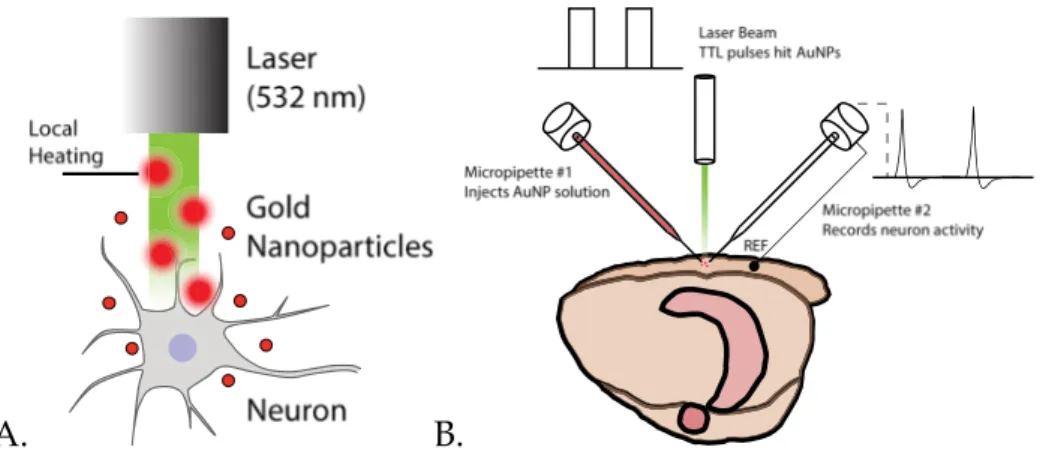
Figure 5 - (A) Schematic representation of AuNP local heating caused by 532 nm light
stimulation. Gold nanoparticles in the path of the laser beam are heated due to SPR effects.
AuNPs close to the neuron are able to induce action potentials by briefly increasing
membrane capacitance. (B) Schematic representation of the setup to be custom built to
both record and manipulate action potentials. Both micropipettes are aligned and centered
in the same point, to which the laser is aimed. Micropipette #1 is connected to a syringe
and injects AuNPs into the extracellular space, which are then heated by TTL-controlled
laser pulses. Micropipette #2 is recording neuron activity. Its reference electrode is located
viii
Figure 6 - Annotated photography of the optical fiber setup with the laser turned on. The
thermocouple tip and the reference electrode are both placed close to the surface of the
wax circle. A drop (either PBS or AuNPs) is then placed in the circle, becoming confined to
the inner acetate surface due to wax’s hydrophobicity. The micropipette is lowered into
the liquid and the tip moved to directly face the laser beam. ... 21
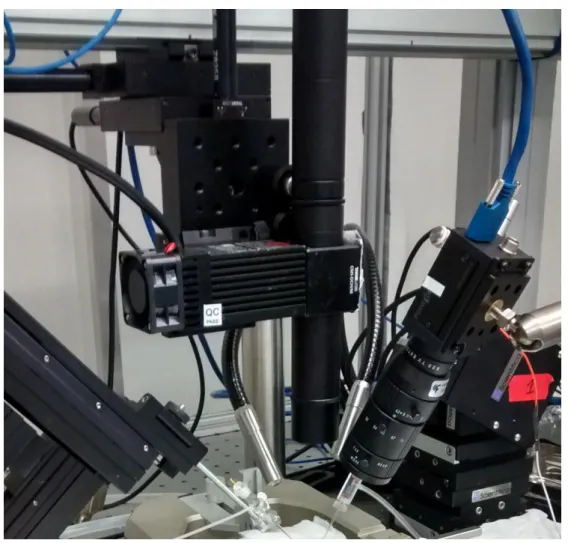
Figure 7 – Image of the custom built Laser #2 setup. ... 22
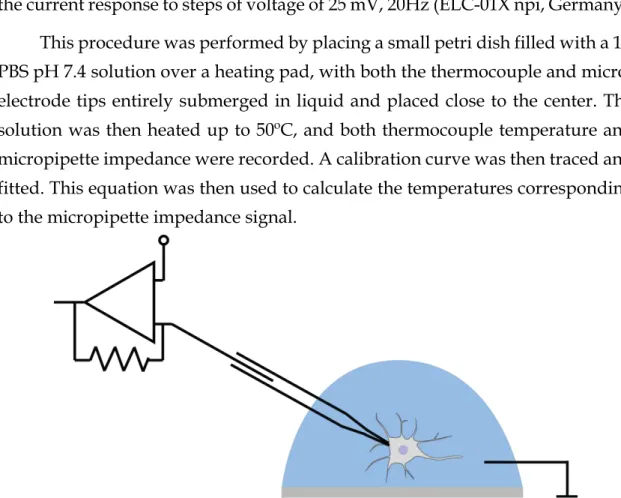
Figure 8 – Diagram of micropipette and microelectrode illustrating how impedance magnitude
measurements are obtained. ... 23
Figure 9 - Observed absorbance spectra of the gold nanoparticles. A peak can be seen at the
wavelength of 530 nm. ... 25
Figure 10 - (A) Plot of the several temperature curves observed during the “optical fiber setup”
experiment. Results are a collection of mean values between repeated assays. All the data
was recovered during a single session so as to use the same glass micropipette.
Subsequent calibration for this micropipette yielded a linear relationship through which
temperatures were calculated: T = -32,43*Z + 87,77; where T represents temperature (in ºC)
and Z represents impedance magnitude (in MΩ). (B) Example of the effect of laser
switching on micropipette impedance profile with an AuNP solution. Both heating and
cooling follow exponential curves opposite to each other. ... 27
Figure 11 - (A) Comparison of the several AuNP dilutions tested (25%, 50% and 75% v/v %) in
order to quantify their effect during photothermal heating. Higher concentrations relate to
higher maximum temperatures achieved, in both thermocouple (TC) and micropipette
(MP) measurements. (B) Comparison of the micropipette temperature reading of the three
dilutions with the control solution along time. ... 28
Figure 12 – Diagram representing order of trials performed during the differing dilutions test.28
Figure 13 - (A) A “contaminated” control trial with the measured temperatures on the
thermocouple and the micropipette. . (B) Comparison between “regular” and
“contaminated” trial measured by the micropipette. ... 29 Figure 14 – Schematic representation of the assembled laser setup. Not shown are the elements
connected to the right-side micropipette, which can be plugged into the computer and/or
into an Open Ephys board along with the Arduino signal for paired analysis. Color
spectrum presented in the vertical tube represents a depiction of the light wavelengths
filtered by the several elements of the setup. ... 29
Figure 15 – (A) Live video image from the camera mounted on the top of the setup. Circled is
the beam center. (B) Outside view of the setup and of the object being focused. The small
circled region shows where the image in A. was focused, as a size comparison. ... 30
Figure 16 – Photothermal stimulation of AuNPs and control solutions with the new laser setup.
Temperature was measured by a calibrated glass micropipette with the tip in the center of
ix
Figure 17 - AuNPs solution injection spreading in agar gel. ... 32
Figure 18 – The mean temperature difference between photothermal stimulation of AuNP in
solution and in agar. ... 33
Figure 19 – Temperatures measured with the micropipette electrode at several distances from
the beam center. Distances were measured using motor software, and temperatures were
calculated following calibration with T = -32.425*Z+77.065. ... 34
Figure 20 – Calibration curves used to convert impedance measurements from the
microelectrode into temperature. ... 45
Figure 21 – Photograph of early structure depicting laser module aimed at the dichroic mirror
after assembly. ... 47
Figure 22 – Laser setup prototype with all parts assembled and small microscope lens, without
portability. ... 48
x
Index of Tables
Table 1 - Measured power of unfocused laser beam in selected pulse modes. Temperature
increase was measured by directly aiming the beam at the thermocouple tip. ... 35
Table 2 – Tests of selected pulses in agar gel and correspondent maximum temperature
11
Introduction
1.1.
The Brain
The brain weights just about 2% of our weight, but is a machine of unrivaled mystery and complexity. Composed of approximately 1011 base units – neurons, and totaling more than 1014 connections between them – synapses; the nervous system effectively builds and processes our perception of the world, of our body, of our feelings and emotions. And yet, with so many progress in other areas of human knowledge this past century (even in respect to the nervous system itself), a full theory regarding the inner workings of the brain is still needed and desired as a major advance in several areas such as biology, medicine, psychology and even computer science.
The neuroscience field has been, for quite a long time, a main interest for not only medical and biological research, but a great range of other seemingly distant fields such as engineering. The unique challenges presented by the study of the brain have, since the first notable discoveries, required a variety of ap-proaches. The fact that neurons and their connections form immensely complex circuits – neural networks, as presented in Figure 1 – develops the requirement for ingenious methods to be able to successfully identify and understand them, as well as the system as a whole.
12 Figure 1 – Matrix displaying curated projection information about sections of the rat brain from several projects. White areas represent areas where information is unavailable, while black areas represent connection absence. The different colors indicate the strength of found
projections. The entire matrix is only 10.45% filled, reflecting how little information there is available. Adapted from [1].
13 Dendrites serve as the receiving end of inputs for the neuron, while the axon conveys signals to other neurons. These signals – action potentials – are electrical in nature and transmitted due to an electric field between ion concentration present in the intracellular and the extracellular me-dium. At rest, there is mainly a presence of K+ and A- (organic anions) on the inside of the cell, while the outside holds Na+ and Cl- ions. Due to the presence of a greater number of ion channels permeable to K+ and subsequent concentration imbalance, K+ diffuses through the lipid membrane, resulting in an excess of A- anions present inside the cell and an excess of K+ outside; in turn causing a positive extracellular charge in opposition to the negatively charged cytoplasm. This effect is self-lim-ited (since the negative interior results in an inward K+ flow as well), balanced by the influx of small quantities of Na+ and Cl-, and further kept steady by active ion transport through Na+-K+ pumps. The re-sulting resting membrane potential is con-stant and ranges from -60 to -70 mV rela-tive to the extracellular medium.
When a depolarization event starts occurring and is able to cross the threshold potential, voltage-gated Na+ channels open and allow a large ion influx into the cell, very rapidly flipping the mem-brane potential to a positive voltage (+55 mV). This is countered by the closing of Na+ channels and opening of voltage-gated K+ channels, returning the resting Figure 2 - Representation of a typical
14 membrane potential. This brief voltage change propagates forward though the axon, briefly regenerating itself between the myelin sheaths [2]. Figure 3 summa-rized the events described in the time context of the actual action potential:
Figure 3 – Representation of a typical action potential signal where (a) represents the resting potential of the cell; (b) is the time the depolarization event starts and membrane permeability to Na+ occurs; (c) at this point both Na+ and K+ channels are open, Na+ rushing into the cell; (d)
point at which the Na+ channels close; (e) K+ flows out of the cell; (f) closing of K+ channels;
and (g) refractory period. Adapted from [3].
1.2.
Neural Activity Stimulation
15 While a substantial number of new techniques came from the field of mi-croelectronics, such as multi-electrode array (MEA) grids [6], transistor-like structures for neural recording and stimulation [7], high density silicon elec-trodes with CMOS architecture [8] and flexible electrocorticography (ECoG) grids [9], the approach remains extremely invasive, causing damage to the struc-tures which they stimulate. This damage arises during implantation and from chronic exposure of neural tissue to a foreign material. Many of these devices also require complex preparation and alignment procedures, as well as compli-cated signal analysis or paired recordings in order to understand the data.
A very recent technique involves the use of light and genetic manipulations in order to stimulate neuronal populations. The first documented use of light to stimulate neurons dates from 1971, when Richard Forks succeeded in using a 488 nm laser beam to excite specific neurons of a marine mollusk, not reaching any clear conclusion on the mechanism which resulted in the observed action poten-tials [10]. Since then, only in 2005, when neuroscientists developed optogenetics [11], did the dream of successfully and reliably stimulating selected neuronal populations with light became reality. By genetically manipulating a subfamily of light-sensitive proteins designated as channelrhodopsins (ChRs) [12] and ex-pressing it on the neurons of interest, these populations became sensitive to light; since ChRs work as light-gated ion channels (Figure 4).
Figure 4 – Representation of channelrhodopsins as light-gated ion channels: incident radia-tion hits the closed channel in the cell membrane, an isomerizaradia-tion of its covalently bound retinal causes the channel to open, and allows ion flow (and, henceforth, membrane
16 While this relatively novel technique has been presenting neuroscience with a substantial amount of new, interesting data, it still presents a few serious draw-backs. The most important of which is the need for genetic manipulation of the subject: this is not possible for every species or neural cell type, and as so, the technique range remains understandably limited.
1.3.
Unmodified-Neuron Optical Stimulation
Due to the problems related to the limitations of genetic modifications re-quired by optogenetics, direct light stimulation of unmodified neurons remained a potential alternative. Allègre et al., in 1994, were able to perform in vivo stimu-lation of a rat nerve bundle with an excimer UV laser [14]. Hirase et al., in 2002, were also able to stimulate unmodified neurons with laser light, this time in vitro and using high intensity IR radiation, observing that different sites of the neuron hit by the beam result in a different response [15]. The biophysical mechanisms underlying unmodified neuron stimulation have remained elusive. Shapiro et al. have recently shown that IR laser pulses are absorbed by water, resulting in a local heating effect which briefly increases membrane capacitance and triggers action potential generation [16].
17 spherically shaped AuNPs functionalized with biological ligands to bind cul-tured neurons and stimulate them using visible light [20], being the main inspi-ration of the work developed in this dissertation.
1.4.
Gold Nanoparticle Photothermal Stimulation
When approaching nano-scale sizes, different types of materials change from their macro-sized counterparts in particular ways: noble metals, such as gold or silver, shift through a variety of colors as particles become smaller in size and with dissimilar shapes. These changes are due to the collective oscillations of the electron gas, or surface plasmon (SP) oscillations [21]. Similarly to photons be-ing a quantization of electromagnetic oscillations and phonons a quantization of mechanical oscillations, plasmons arise from variations in the density of free elec-trons; or the quantization of electron oscillations in the conduction band. Plas-mons can become coupled with photons (resulting in a polariton) when interact-ing with resonant electromagnetic radiation. While under surface plasmon reso-nance (SPR) conditions, colloidal noble metal nanoparticles (such as gold) pre-sent a very strong absorption cross-section [22]. This results in a sequence of events: the irradiation of the nanoparticles with resonant radiation induces elec-tron-electron scattering, which causes local heating through the dissipation of phonon interactions with the metal lattice, all in a picosecond timescale with short range heat dissipation [23].
SPR frequency is dependent on the nanoparticle composition, shape, size, orientation and surrounding dielectric environment. Most commonly, gold na-norods exhibit SPR frequencies in the NIR range, while nanospheres of the same material present peaks in absorption spectra close to green visible light [24].
The relative ease of synthesis of gold nanospheres and the high degree of control over the selectivity of the heating effects make these particles considera-bly good candidates for damage-free photothermal neural cell stimulation.
1.5.
Summary
18 a wide range of techniques can be employed to both be able to record and ma-nipulate this signal: physical probes, flexible electrocorticography grids, genetic modification and even light in addition to gold nanoparticles, as discussed above. However, while for the last decade nanoparticle heating has been a popular topic in areas such as physics and cancer research, it was seldom applied to neurosci-ence; and even its effects on the brain were only discovered very recently.
While several in vitro articles show AuNP heating to be a promising method, little in vivo research has occurred so far using the same applied to cell cultures. Filling that void is the main goal of this research. First, by validating and quantifying the AuNP laser heating effect (Figure 5A), and secondly, by us-ing this knowledge to build a custom setup capable of supplyus-ing the same testus-ing conditions for in vitro and in vivo tests (Figure 5B).
A. B.
Figure 5 - (A) Schematic representation of AuNP local heating caused by 532 nm light stimu-lation. Gold nanoparticles in the path of the laser beam are heated due to SPR effects. AuNPs
close to the neuron are able to induce action potentials by briefly increasing membrane ca-pacitance. (B) Schematic representation of the setup to be custom built to both record and manipulate action potentials. Both micropipettes are aligned and centered in the same point, to which the laser is aimed. Micropipette #1 is connected to a syringe and injects AuNPs into the extracellular space, which are then heated by TTL-controlled laser pulses. Micropipette #2 is recording neuron activity. Its reference electrode is located in a nearby position in the
19
Methods
The materials and methods used during the course of the experiments per-formed in this dissertation are presented in this section. Gold nanoparticles were synthesized and characterized. A laser setup was used and tuned to test and cal-ibrate the variation of temperature. Finally, a setup (briefly summarized in sec-tion 2.4.2 and detailed in secsec-tion 3.2.2) custom built for in vivo surgical procedures was used, detailed in section 2.5.
2.1.
Synthesis of gold nanoparticles
Gold nanoparticles were synthesized through the citrate reduction method [25]. 1 mM of tetrachloroauric acid (Sigma-Aldrich, 99.9%) was heated on a hot plate under moderate magnetic stirring until boiling point. 1% (w/v) trisodium citrate (Analar Normapur, 100%) was then added and stirred continuously until the solution turned deep red.
2.2.
Gold Nanoparticle Characterization
Characterization of the synthesized gold nanoparticles was performed by two methods: dynamic light scattering (DLS) size measurements and spectrom-eter measurements of the particle absorbance spectra - given this paramspectrom-eter is essential to verify if the extinction cross-section of the synthesized particles match the laser light frequency.
20
2.2.1.
Dynamic Light Scattering
Hydrodynamic sizes of the produced colloidal nanoparticles were assessed by dynamic light scattering (W130i Avid Nano).
2.2.2.
Absorption Spectra
The absorption spectra of the gold nanoparticles was obtained using a spec-trometer (PerkinElmer UV/VIS/NIR Specspec-trometer Lambda 950) with deionized water (Millipore) as baseline.
2.3.
Agar Preparation
Agar gel was prepared by preheating 500 mL of a 1X PBS pH 7.4 solution on a hot plate until boiling. 2.5g of agarose (Próvida, Agar-Agar) were added to the solution and stirred vigorously up to full dissolution. The solution was sub-sequently poured into several petri dishes and let cool until completely solid.
2.4.
Laser Heating
Gold nanoparticle laser heating tests were performed with two systems. Gold nanoparticles were also tested in solution and in agar gel. Temperature was measured and calibrated using both a thermocouple and the impedance varia-tion of a glass microelectrode.
2.4.1.
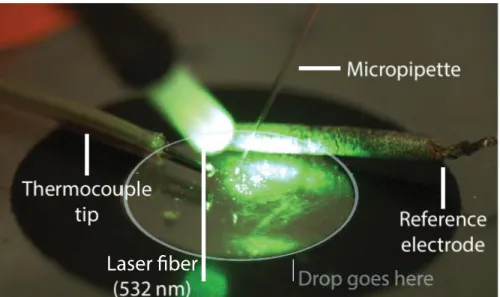
Optical Fiber Setup (Laser #1)
21 was entirely submerged in liquid. The glass fiber was mounted on the left side micromanipulator, descended without touching the liquid and pointed directly at the glass micropipette tip. On the wax circle, the thermocouple tip and mi-cropipette reference electrode were taped to the surface.
Figure 6 - Annotated photography of the optical fiber setup with the laser turned on. The thermocouple tip and the reference electrode are both placed close to the surface of the wax
circle. A drop (either PBS or AuNPs) is then placed in the circle, becoming confined to the inner acetate surface due to wax’s hydrophobicity. The micropipette is lowered into the
liq-uid and the tip moved to directly face the laser beam.
2.4.2.
Collimated Beam Setup (Laser #2)
A non-fiber-coupled, >150 mW 532 nm DPSS laser (Laserglow, C531505FX) was mounted on a custom built setup and operated in both CW and TTL modes. The setup was assembled on a small support structure and consisted of three interconnected motorized stages (Thorlabs, PT1-Z8).
22 shielding from green light. TTL pulses were controlled and connected to the laser power source unit through an Arduino board (Arduino LLC, Uno).
Both liquid drop and agarose tests used a setup similar to the one used with the optical fiber test. The laser beam was pointed directly at the glass microelec-trode tip using the 3-axis motorized stage assembly. For tests on agarose, a sec-ond glass microelectrode was mounted on the left side micromanipulator, filled with gold nanoparticle solution and connected to an air valve; which was plugged in a 5 mL plastic syringe (Terumo, 5ML). This structure was used to inject gold nanoparticles into the testing area. A photography of the setup, with an additional video camera present (Point Grey, Grasshoper), can be seen in Fig-ure 7.
23
2.4.3.
Temperature Calibration
In order to be able to measure changes of temperature in a constrained space, glass micropipettes (tip between 5-10 μm) were used to build a microelec-trode and the impedance measured can be then calibrated to temperature [20,26] (Figure 8).
The micropipettes were pulled from 1.5 mm capillary borosilicate glass (Warner Instruments) and filled with PBS 1x. Positive pressure (10-25 mmHg) is maintained in the electrode to keep the tip clear and the amount of pressure and suction applied is monitored through the experiment (DPM1B Pneumatic Trans-ducer Tester, Fluke Biomedical, USA). The amplifier for microelectrode record-ings is set in voltage clamp mode and the tip resistance is monitored by observing the current response to steps of voltage of 25 mV, 20Hz (ELC-01X npi, Germany). This procedure was performed by placing a small petri dish filled with a 1X PBS pH 7.4 solution over a heating pad, with both the thermocouple and micro-electrode tips entirely submerged in liquid and placed close to the center. The solution was then heated up to 50ºC, and both thermocouple temperature and micropipette impedance were recorded. A calibration curve was then traced and fitted. This equation was then used to calculate the temperatures corresponding to the micropipette impedance signal.
24
Results and Analysis
In this chapter results from all the exposed methods will be presented, as well as analyzed and discussed thoroughly. The first section describes the char-acterization of the gold nanoparticles used in subsequent tests. The second sec-tion encompasses the main body of experimental analysis, divided in distinct sections related to the experimental setup in use.
3.1.
Gold Nanoparticle Characterization
3.1.1.
Particle Size
Gold nanoparticle hydrodynamic diameter was evaluated to be 16.4±0.7 nm using DLS.
3.1.2.
Absorbance Spectrum
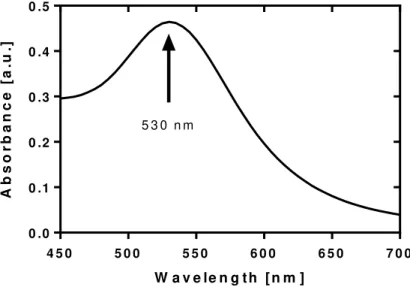
As seen in Figure 9, the UV-vis spectrograph of the gold nanoparticles shows an absorbance peak (λmax) at 530 nm, which is close to the expected value for the size and shape of synthesized nanoparticles [27]. As the nanoparticle size
increases, λmax is red-shifted by a relatively minor amount: Δλ = 30 nm for 20 to
80 nm nanospheres. This is reported to be due to electromagnetic retardation ef-fects which arise with the increasing size of the particles [28]. Considering
25 ations from the theoretical value this does not present an issue, as the laser appa-ratus being used has a wavelength of 532 nm, very close to the measured reso-nance peak of the synthesized particles.
W a v e le n g t h [ n m ]
A b s o r b a n c e [ a .u .]
4 5 0 5 0 0 5 5 0 6 0 0 6 5 0 7 0 0 0 .0 0 .1 0 .2 0 .3 0 .4 0 .5
5 3 0 n m
Figure 9 - Observed absorbance spectra of the gold nanoparticles. A peak can be seen at the wavelength of 530 nm.
3.2.
Optical Fiber Setup (Laser #1)
Laser heating refers to the tests performed regarding the photothermal stimulation of AuNP and control solutions with 532 nm laser light.
3.2.1.
Photothermal Stimulation of AuNP Solution
In order to assess the validity and reproducibility of local heating of gold nanoparticles, it is first needed to observe how the heating occurs within PBS solution, which, due to similarities to the cerebral-spinal fluid (CSF) is designated as the control; and the gold nanoparticle colloidal solution previously synthe-sized.
26 The laser beam, while exiting the optical fiber, was measured to have a power of 149 mW. The fiber presented a numerical aperture (NA) value of 0.34, corresponding to a half angle of approximately 20º in air and 26º in PBS (accord-ing to the refractive index presented in [29]).
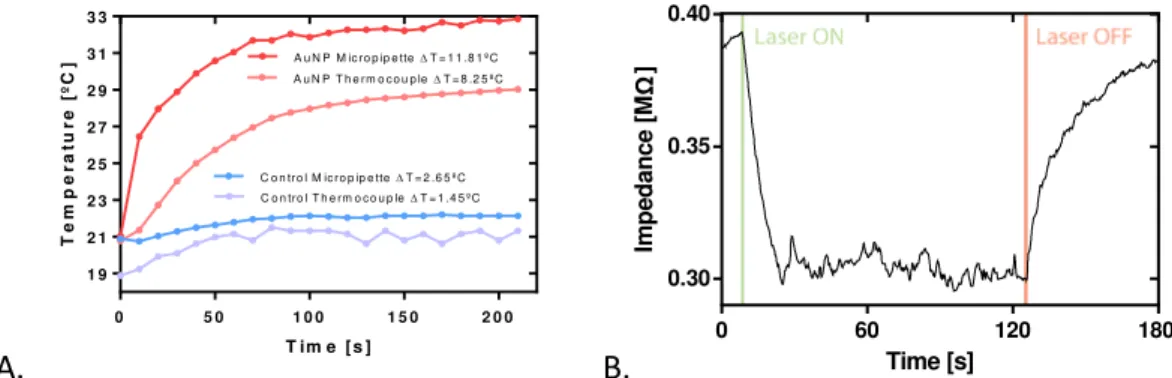
A significant difference in temperature variation can be seen between con-trol and AuNP solutions. Taking into account the temperature measured by the micropipette, the increment was approximately 12 ºC and 3 ºC, respectively, for the AuNP and control solutions. Micropipette calculated temperatures present higher values, hypothesized to occur due to the measurement precision in the tip (small volume), versus the large volume of liquid measured by the larger ther-mocouple tip. This is supported by the noticeably lower difference between con-trol measurements in comparison with AuNPs (since concon-trol heating is devoid of nanoparticles, heating is expected to be homogenous and hence, similar in both measurement methods, in opposition to the local heating effect expected in the presence of AuNPs). The dissimilar slopes present in the first 20 seconds, measuring 0.34ºC/s and 0.09ºC/s - corresponding to the micropipette and ther-mocouple measurements, respectively, are also indicative of a fast short range nanoparticle heating effect such as described in previous literature [20,26]; in comparison with the slower dissipation effect measured by the thermocouple (possibly a diffusion effect).
27
A. T im e [ s ]
T e m p e r a tu r e [ º C ]
0 5 0 1 0 0 1 5 0 2 0 0
1 9 2 1 2 3 2 5 2 7 2 9 3 1 3 3
C o n tr o l M ic r o p ip e tteT = 2 .6 5 ºC
A u N P T h e rm o c o u p leT = 8 .2 5 ºC
C o n tro l T h e rm o c o u p leT = 1 .4 5 ºC
A u N P M ic ro p ip e tteT = 1 1 .8 1 ºC
B. Time [s]
Im p e d a n c e [MΩ ]
0 60 120 180
0.30 0.35 0.40
Figure 10 - (A) Plot of the several temperature curves observed during the “optical fiber setup” experiment. Results are a collection of mean values between repeated assays. All the
data was recovered during a single session so as to use the same glass micropipette. Subse-quent calibration for this micropipette yielded a linear relationship through which tempera-tures were calculated: T = -32,43*Z + 87,77; where T represents temperature (in ºC) and Z
rep-resents impedance magnitude (in MΩ). (B) Example of the effect of laser switching on
mi-cropipette impedance profile with an AuNP solution. Both heating and cooling follow expo-nential curves opposite to each other.
28 A. T e m p e r a tu r e [ º C ] 2 0 2 5 3 0 3 5
2 5 % 5 0 % 7 5 %
T C
T C T C
M P
M P
M P
B.
Figure 11 - (A) Comparison of the several AuNP dilutions tested (25%, 50% and 75% v/v %) in order to quantify their effect during photothermal heating. Higher concentrations relate to higher maximum temperatures achieved, in both thermocouple (TC) and micropipette (MP)
measurements. (B) Comparison of the micropipette temperature reading of the three dilu-tions with the control solution along time.
An important factor to consider while working with AuNPs and using the same setup for all the trials is the presence of control contamination. In the results presented, the order of trials was as represented in Figure 12:
Figure 12 – Diagram representing order of trials performed during the differing dilutions test.
Control trials done after all of the AuNP trials did not show a change in the micropipette results, as seen in Figure 13. While the temperature change reported by the thermocouple is higher than the ones previously observed, the micropi-pette still shows a similar result. Results are similar, supporting the hypothesis that the micropipette tip is only sensible to local changes, since even if AuNPs are deposited in the surface of the acetate, contributing to the overall heating ef-fect measured by the thermocouple, this efef-fect is not noticeable while in a short volume above the surface.
Time [s] T e m p e ra tur e[ ºC ]
0 50 100 150 200
20 25 30 35 Control AuNPs 25% AuNPs 50% AuNPs 75%
Control Control AuNPs
25% Control AuNPs 25% AuNPs 50% AuNPs 50% AuNPs 75% AuNPs
29
A. B.
Figure 13 - (A) A “contaminated” control trial with the measured temperatures on the ther-mocouple and the micropipette. . (B) Comparison between “regular” and “contaminated”
trial measured by the micropipette.
3.3.
Collimated Beam Setup (Laser #2)
3.3.1.
Laser Setup
A custom laser setup was designed (Figure 14) and built in order to test the next set of both in vitro and in vivo assays. The setup was built taking account spatial constraints due to the surgery and recording rig.
30 and/or into an Open Ephys board along with the Arduino signal for paired analysis. Color spectrum presented in the vertical tube represents a depiction of the light wavelengths
fil-tered by the several elements of the setup.
The focusing mechanism works by using the camera as a focus guide for the laser beam and adjusting the Z-axis stage. Since both the light received by the camera and the light emitted by the laser use the microscope objective as a focus-ing lens, the image received on the screen will be focused at the same time as the laser beam. An image of the described mechanism in an early prototype of the setup is presented in Figure 15:
Figure 15 – (A) Live video image from the camera mounted on the top of the setup. Circled is the beam center. (B) Outside view of the setup and of the object being focused. The small
cir-cled region shows where the image in A. was focused, as a size comparison.
Three interconnected motorized stages (X-Y-Z directions) are already part of the surgery setup, and both modules are designed to snap into the existing mounts on the Z stage. This makes it possible to assembly the setup during sur-gery in order to initiate recordings or stimulation.
Laser power in continuous wave mode (CW) was measured to be approxi-mately 245 mW and the beam center size determined to be roughly 700 µm while
unfocused and 65 μm when focused with the 10X microscope objective. The beam
half-angle was calculated as 0.014 ± 0.003º.
3.3.2.
Photothermal Stimulation of AuNP Solution
31 control and AuNP trials. Maximum temperatures attained were higher, with a ΔTAu of 18.58 ºC and a ΔTControl of 5.83 ºC (compared with, respectively 11.81 ºC and 2.65 ºC from Laser #1). Temperature rise in the first 20 seconds also presents significant differences from previous trials: AuNP solution measures 1.214 ºC/s while control measures 0.188 ºC/s (compared with 0.34ºC/s and 0.09ºC/s from Laser #1).
T im e [ s ]
T e m p e r a tu r e [ º C ]
0 2 0 4 0 6 0 8 0 1 0 0 1 5 2 0 2 5 3 0 3 5 4 0
A u N P s
C o n tro l
Figure 16 – Photothermal stimulation of AuNPs and control solutions with the new laser setup. Temperature was measured by a calibrated glass micropipette with the tip in the
cen-ter of the laser beam, following the relationship T = -188.2*Z+89.22.
The rise in temperature variation can be possibly attributed to the increased power in comparison to Laser #1 (116 mW higher), as well as to the smaller spot size yielding higher power per each area unit exposed.
3.3.3.
Agar Injection
32 for an offset in order to avoid collision with the other micropipette) through the guidance of an external magnified video camera feed. Approximately 150 nL of AuNPs are injected into the agar gel following the application of positive pres-sure.
The injected AuNP solution spreads through the gel as seen in Figure 17. The stained area as measured during several trials, extended for approximately 1 mm across from the injection zone (or more when the surrounding agar pre-sented pronounced valleys, ridges or internal pockets caused by micropipette movement within).
33
3.3.4.
Photothermal Stimulation of AuNPs in Agar
AuNP injection in agar was subsequently followed by laser heating. This was done as both a separate and complementary heating trial to the solution tests previously presented, and as a preparation step for an acute surgery scenario, where the same setup would be in use.
In Figure 18 is shown that in the case of AuNPs in agar, a lower maximum temperature is noted, possibly explained by the lower concentration due to the dispersion and diffusion of the AuNP solution across the agar medium.
Figure 18 – The mean temperature difference between photothermal stimulation of AuNP in solution and in agar.
While the measurements taken within the visibly stained areas presented very similar measurements colorless (not stained) areas in the gel remained with minute temperature differences, characteristic of typical control reference values. Therefore, another test performed with the same setup and agar gel con-sisted of assessing the temperature changes present within several distances of the micropipette tip relative to the laser beam center, as seen in Figure 19.
T
0 2 4 6 8 10 12 14 16 18 20
Agar Au Injection PBS
Au Solution
S
o
lu
tio
n
A
g
a
34
D is ta n c e to B e a m C e n te r [m ]
T e m p e ra tu re [ ºC ]
0 2 0 0 0 4 0 0 0 6 0 0 0 2 4
2 6 2 8 3 0
Figure 19 – Temperatures measured with the micropipette electrode at several distances from the beam center. Distances were measured using motor software, and temperatures were
cal-culated following calibration with T = -32.425*Z+77.065.
As expected, temperature tends to increase closer to the center of the beam, corresponding its maximum to 29.3 ºC. In contrast, at a distance of 6 mm from the beam center, measured temperatures are close to ambient, at 23.6 ºC; meaning a temperature difference ΔT = 5.7 ºC between both extremes.
3.3.5.
Laser Power
One of the main concerns regarding the laser beam is to ensure sufficient power delivered so as successfully stimulate and penetrate the animal brain tis-sue in a practical depth profile (considering the laser light penetration depths discussed in the literature [30,31]), without causing significant damage or tissue degeneration.
In order to test beam power and the photothermal effects, different TTL pulses were applied. Symmetrical pulses varying from 1000 Hz to 2 Hz were ap-plied as asymmetrical pulses ranging from 1 ms ON/ 10 ms OFF to 10 ms ON / 500 ms OFF.
35 Attempts to reduce the optical power, and, consequently, the damage caused, were performed by applying several symmetrical and asymmetrical TTL pulses to the laser module.
Table 1 - Measured power of unfocused laser beam in selected pulse modes. Temperature in-crease was measured by directly aiming the beam at the thermocouple tip.
Pulse Type Continuous
Wave 1 kHz 2 Hz 10 Hz 10ms-50ms 10ms-500ms
ΔT (°C) 56 44,4 28,8 28 1,4 0
Power
(mW) 265 78,1 101 14,7 2,97 0,4
Selectively, some of these pulse types were then subsequently tested for photothermal stimulation, in order to elicit if a particular pulse can both initiate stimulation of AuNPs while avoiding tissue damage (Table 2).
Table 2 – Tests of selected pulses in agar gel and correspondent maximum temperature varia-tion measured.
Pulse Type 1 kHz 10ms-50ms 10ms-500ms
ΔT Agar (ºC) 0.86 0.65 0.88
ΔT AuNPs (ºC) 0.95 0.54 0.44
Based on the results presented, no power of the three selected seems to elicit any significant change in temperature in either agar or solution.
36
Conclusions and Future Perspectives
As scientific fields regularly get more interconnected, problems are con-stantly being conquered through ingenious and novel approaches. One of the most challenging areas remains to be neuroscience, due to the nature and com-plexity of the systems involved, as well as their micron-scaled size.
Due to recent advances in both the understanding and stimulation of SPR nanoparticle heating and neuron membrane capacitance changes, as well as the benefits of such an activation method compared with natively limited techniques such as optogenetics or physical electrodes – gold nanoparticle neuron stimula-tion presents itself as an important alternative to study. Given this main motiva-tion, the project presented in this dissertation explored both the validity and quantification of the photothermal heating effects displayed by gold nanoparti-cles upon SPR laser stimulation.
Gold nanoparticles solution photothermal stimulation trials displayed mean temperature rises approximately 10 ºC greater than the variations meas-ured in PBS solutions. Several dilutions of the gold nanoparticle solution were also tested, revealing a tendency for higher concentrations of AuNPs to be able to attain higher maximum temperature variations. Temperature variation slopes in the first 20 seconds exhibited a large difference between the curve profiles of both solutions upon stimulation: gold nanoparticles presented high slopes (from 0.30 ºC/s in the case of Laser #1 to 1.21 ºC in Laser #2) with an exponential
37 growth profile, not present in control trials (which had significantly lower slopes, 0.09 ºC and 0.12 ºC, respectively, in lasers #1 and #2). Temperature values di-rectly measured with the thermocouple probe were also shown to be unreliable in comparison to the temperatures calculated through the calibrated impedance measurements from the microelectrode, possibly due to short-range local heating effects.
In comparison, agar injection tests performed with Laser #2 presented a mean difference of approximately 6 ºC between AuNPs and control trials. Both tests lead to the validation of the photothermal heating effect in AuNPs. How-ever, while it occurs and presents itself differently enough from control solutions to be detected, the short range of nanoparticle heating limits accurate measure-ments by larger, less sensitive devices.
The collimated beam setup (Laser #2) was successfully built, fulfilling its main objective of being able to expand upon the measurements performed with Laser #1. It facilitated the movement of the laser beam, allowed the selective and precise injection of gold nanoparticle solution through the use of a second mi-cropipette - which permitted for the agar injection tests - and changed the laser module - which permitted the application of TTL laser pulses.
Due to the small beam size of Laser #2 it was possible to evaluate tempera-ture changes between different distances from the center of the beam: leading to results showing a temperature difference of roughly 6 ºC over a distance of 6 mm from the beam center.
38 In terms of future perspectives, several options are available in order to ex-pand upon the study presented in this dissertation in a number of directions, as well as maneuver the issues encountered. These problems, possible solutions and possible new research opportunities are summarily discussed below.
While the motor-mounted micropipette provides a more reliable and sensi-tive solution to temperature measurements than the thermocouple probe, it pre-sents several issues:
They are extremely fragile and must be moved and mounted with extreme care.
They present different tip sizes and shapes, which display different impedance magnitudes; each requiring a unique calibration in order to calculate temperature values, which is a very time-consuming process.
Impedance values measured by the microelectrode are extremely sensitive to noise sources and difficult to stabilize.
A possible solution to this problem could be the use of an infrared camera in order to measure temperature changes. The use of such a device has the ad-vantage of offering a spatial view of the data, allowing for more detailed and faster analysis. Furthermore, published work exists successfully employing this method for similar assays [34].
Another problem was the lack of effective regulation of laser power except the use of TTL pulses, which proved unable to effectively stimulate AuNPs. An interesting alternative would be inclusion in the setup of an acousto-optic-mod-ulator (AOM) in order to be able to modify the power delivery in the optical path. Further research with such a device may be able to provide the power compro-mise required for in vivo stimulation.
39 Regarding the research presented by this study itself, important next steps include several paths:
In vitro neural stimulation tests with cultured neurons.
Further testing of other wavelengths and particles, such as gold na-norods and infrared radiation, or quantum dots.
Gold nanoparticle surface functionalization in order to allow for ef-fective neuron binding, since the short range heating limits the acti-vation to the membrane surface, close to the temperature-gated channels.
In vivo testing of several beam pulses in order to evaluate tissue dam-age and stimulation possibilities.
For further possibilities of in vivo tests, use of novel transparent ECoG grids (trECoGs) in order to record neural signals and correlate them with the laser pulses.
40
References
1. Bohland, J. W. et al. 2009 A proposal for a coordinated effort for the determination of brainwide neuroanatomical connectivity in model organisms at a mesoscopic scale. PLoS Comput. Biol. 5.
(doi:10.1371/journal.pcbi.1000334)
2. Kandel, E. et al. 2012 Principles of neural science. 5th edn. McGraw-Hill. 3. Wickens, A. P. 2014 A History of the Brain: From Stone Age surgery to modern
neuroscience. 1st Editio. London and New York: Psychology Press.
4. Hodgkin, A. L. 1964 The Ionic Basis of Nervous Conduction. Science (80-. ). 145, 1287–1287. (doi:10.1126/science.145.3638.1287)
5. Neher, E. & Sakmann, B. 1976 Single-channel currents recorded from membrane of denervated frog muscle fibres. Nature 260, 799–802. (doi:10.1038/260799a0)
6. Pearce, T. M. & Williams, J. C. 2007 Microtechnology: meet neurobiology. Lab Chip 7, 30–40. (doi:10.1039/b612856b)
7. Benfenati, V. et al. 2013 A transparent organic transistor structure for bidirectional stimulation and recording of primary neurons. Nat. Mater.
12, 672–80. (doi:10.1038/nmat3630)
8. Implantable, A. et al. 2013 16.2 An Implantable 455-Active-Electrode 52-Channel CMOS Neural Probe. , 288–290.
41 9. Khodagholy, D. et al. 2014 NeuroGrid: recording action potentials from
the surface of the brain. Nat. Neurosci. 18, 310–315. (doi:10.1038/nn.3905) 10. Moscona, a et al. 1969 Laser Stimulation of Nerve Cells in Aplysia
Cell-Free Protein Synthesizing System from Yeast Mitochondria. 3.
11. Boyden, E. S. et al. 2005 Millisecond-timescale, genetically targeted optical control of neural activity. Nat. Neurosci. 8, 1263–8. (doi:10.1038/nn1525) 12. Nagel, G. et al. 2002 Channelrhodopsin-1: a light-gated proton channel in
green algae. Science 296, 2395–2398. (doi:10.1126/science.1072068)
13. Hegemann, P. & Nagel, G. 2013 From channelrhodopsins to optogenetics. EMBO Mol. Med. 5, 173–176. (doi:10.1002/emmm.201202387)
14. Allègre, G. et al. 1994 Stimulation in the rat of a nerve fiber bundle by a short UV pulse from an excimer laser. Neurosci. Lett. 180, 261–264. (doi:10.1016/0304-3940(94)90534-7)
15. Hirase, H. et al. 2012 Multiphoton stimulation of Neurons and Spines. Cold Spring Harb. Protoc. 7, 472–475. (doi:10.1101/pdb.prot068569) 16. Shapiro, M. G. et al. 2012 Infrared light excites cells by changing their
electrical capacitance. Nat. Commun. 3, 736. (doi:10.1038/ncomms1742) 17. Lugo, K. et al. 2012 Remote switching of cellular activity and cell
signaling using light in conjunction with quantum dots. Biomed. Opt. Express 3, 447. (doi:10.1364/BOE.3.000447)
18. Eom, K. et al. 2014 Enhanced Infrared Neural Stimulation using Localized Surface Plasmon Resonance of Gold Nanorods. Small , 3853–3857.
(doi:10.1002/smll.201400599)
19. Yong, J. et al. 2014 Gold-nanorod-assisted near-infrared stimulation of primary auditory neurons. Adv. Healthc. Mater. , 1–7.
(doi:10.1002/adhm.201400027)
20. Carvalho-de-Souza, J. L. et al. 2015 Photosensitivity of Neurons Enabled by Cell-Targeted Gold Nanoparticles. Neuron , 1–11.
(doi:10.1016/j.neuron.2015.02.033)
21. Eustis, S. & el-Sayed, M. a 2006 Why gold nanoparticles are more
42 22. Huang, X. H. et al. 2006 Cancer cell imaging and photothermal therapy in
the near-infrared region by using gold nanorods. J. Am. Chem. Soc. 128, 2115–2120. (doi:10.1021/ja057254a)
23. Roper, D. K. et al. 2007 Microscale heat transfer transduced by surface plasmon resonant gold nanoparticles. J. Phys. Chem. C 111, 3636–3641. (doi:10.1021/jp064341w)
24. Anker, J. N. et al. 2008 Biosensing with plasmonic nanosensors. Nat. Mater. 7, 442–453. (doi:10.1038/nmat2162)
25. Kimling, J. et al. 2006 Turkevich method for gold nanoparticle synthesis revisited. J. Phys. Chem. B 110, 15700–7. (doi:10.1021/jp061667w)
26. Yao, J. et al. 2009 Rapid temperature jump by infrared diode laser irradiation for patch-clamp studies. Biophys. J. 96, 3611–3619. (doi:10.1016/j.bpj.2009.02.016)
27. He, Y. Q. et al. 2005 A study on the sizes and concentrations of gold nanoparticles by spectra of absorption, resonance Rayleigh scattering and resonance non-linear scattering. Spectrochim. Acta. A. Mol. Biomol.
Spectrosc. 61, 2861–6. (doi:10.1016/j.saa.2004.10.035)
28. Jain, P. K. et al. 2006 Calculated absorption and scattering properties of gold nanoparticles of different size, shape, and composition: applications in biological imaging and biomedicine. J. Phys. Chem. B 110, 7238–48. (doi:10.1021/jp057170o)
29. Zhernovaya, O. et al. 2011 The refractive index of human hemoglobin in the visible range. Phys. Med. Biol. 56, 4013–21.
(doi:10.1088/0031-9155/56/13/017)
30. Yizhar, O. et al. 2011 Optogenetics in neural systems. Neuron 71, 9–34. (doi:10.1016/j.neuron.2011.06.004)
31. Huber, D. et al. 2008 Sparse optical microstimulation in barrel cortex drives learned behaviour in freely moving mice. Nature 451, 61–4. (doi:10.1038/nature06445)
32. Sramek, C. et al. 2011 Non-damaging Retinal Phototherapy: Dynamic Range of Heat Shock Protein Expression. Investig. Opthalmology Vis. Sci.
43 33. Jackson, J. et al. 2015 Laser-Mediated Microlesions in Mouse Neocortex to
Investigate Neuronal Degeneration and Regeneration. Curr. Protoc. Neurosci. , 2.24.1–2.24.17. (doi:10.1002/0471142301.ns0224s73)
44
Appendix
Section A
Calibration Curves
Im p e d a n c e [M]
T e m p e r a tu r e [ º C ]
0 .2 0 0 .2 5 0 .3 0 0 .3 5 0 .4 0
0 2 0 4 0 6 0
Y = -188.2*X + 89.22
Im p e d a n c e [M]
T e m p e r a tu r e [ º C ]
2 .8 3 .0 3 .2 3 .4 3 .6 3 .8
2 0 2 5 3 0 3 5 4 0
Y = -24.06*X + 108.9
45 Im p e d a n c e [M ]
T e m p e r a tu r e [ º C ]
0 .0 0 .1 0 .2 0 .3 0 .4
0 2 0 4 0 6 0 8 0
Y = -284.6*X + 103.5
Im p e d a n c e [M ]
T e m p e r a tu r e [ º C ]
1 .2 1 .4 1 .6 1 .8 2 .0
2 0 3 0 4 0 5 0
Y = -43.94*X + 104.4
46
Section B
Arduino Code used for TTL pulses
int outPin = 6;
//int freq = 1000; //Enter frequency in Hz //int period = (1/freq)*1000;
void setup() {
pinMode(outPin, OUTPUT); Serial.begin(9600); }
void loop() {
digitalWrite(outPin, HIGH); Serial.print("LOW \n");
delay(500); // Set pulse pause time in miliseconds digitalWrite(outPin, LOW);
Serial.print("HIGH \n");
47
Section C
Images of Laser #2 Setup Prototyping
48 Figure 22 – Laser setup prototype with all parts assembled and small microscope lens,