II
DECLARAÇÃO Nome: David Keating Gomes Mota
Endereço eletrónico: [email protected] Telefone:917721256; 253324450 Bilhete de Identidade/Cartão do Cidadão: 13242538
Título da dissertação: Development of Techniques to Enhance the Productivity of Marine Diatoms
Orientadora:
Doutora Ana Paula Mesquita Rodrigues da Cunha Nicolau Ano de conclusão: 2016
Mestrado em Bioengenharia
É AUTORIZADA A REPRODUÇÃO PARCIAL DESTA DISSERTAÇÃO, APENAS PARA EFEITOS DE INVESTIGAÇÃO, MEDIANTE DECLARAÇÃO ESCRITA DO INTERESSADO, QUE A TAL SE COMPROMETE.
Universidade do Minho, _____/_____/_________ Assinatura:
III
A
GRADECIMENTOS
The author would like to thank Dr. Ana Nicolau, Prof. Manuel Mota, Prof. José António Teixeira, Prof. Miguel Gama, Dr. Jorge Padrão and Dr. Nicolina Dias, for the support given in the different steps of this work.
The author would also like to thank the research technicians from Centre of Biological Engineering, University of Minho, Braga, Portugal, Dr. Paula Pereira and Diana Vilas Boas for helping in the capture and edition of CLSM and epifluorescence images.
This study was supported by the Portuguese Foundation for Science and Technology (FCT) under the scope of the strategic funding of UID/BIO/04469/2013 unit and COMPETE 2020 (POCI-01-0145-FEDER-006684) and the Project RECI/BBB-EBI/0179/2012 (FCOMP-01-0124-FEDER-027462). The authors also acknowledge the support by BioTecNorte operation (NORTE-01-0145-FEDER-000004) funded by the European Regional Development Fund under the scope of Norte2020 - Programa Operacional Regional do Norte.
V
R
ESUMO
A aquacultura, um sector em franca expansão, está claramente menos desenvolvida do que a agricultura e a pecuária relativamente à formulação de dietas e das condições ecológicas para o aumento da produção. Sabe-se, no entanto, que um dos principais fatores que afetam a produtividade em aquacultura é a seleção de espécies de plâncton ótimas para prover as necessidades nutricionais dos animais a produzir, nas fases iniciais de desenvolvimento (larvas e pós-larvas). As tecnologias utilizadas para produzir dietas de plâncton para os animais em crescimento falham frequentemente em atingir os seus objetivos, tanto em qualidade como em quantidade, sendo insuficientes para satisfazer as necessidades produtivas das indústrias de aquacultura. O objetivo deste trabalho é desenvolver tecnologia industrial para produzir, nas melhores condições, as diatomáceas marinhas para a produção de várias espécies animais em aquacultura. Como já foi feito para outros microrganismos (como leveduras e bactérias), no caso das diatomáceas é certamente possível melhorar os meios de cultura e outras variáveis ecológicas (por exemplo, a utilização de atmosfera enriquecida em CO2 e o uso de micro-suportes para adesão celular, para cultura em bio-reator). Os estudos realizados neste trabalho permitiram encontrar concentrações ótimas para os componentes dos meios de cultura. Foi igualmente identificado um suporte, a celulose bacteriana, que também aumenta a produtividade das culturas. Além disso, estudou-se a preservação de culturas de diatomáceas por longos períodos de tempo. Foi por isso testado um método de imobilização, utilizando um revestimento de látex, para averiguar a possibilidade deste permitir preservar a viabilidade celular por longos períodos de armazenamento. Este método ainda necessita de melhoramentos. As diatomáceas em estudo neste trabalho são Navicula sp. e Amphora sp., as principais espécies necessárias na produção em aquacultura de Haliotis tuberculata, um molusco marinho de elevado valor acrescentado.
VII
A
BSTRACT
Aquaculture development is clearly behind agriculture and livestock farming, concerning manipulation of feeding and ecological conditions to enhance production. It is a fast growing sector in the food industry. One of the main factors affecting aquaculture productivity is the selection of the optimal plankton species to suit the nutritional needs of commercially targeted animals to be produced, in early stages of development (larvae and post-larvae). Moreover, the technologies used to produce plankton diets for the animals to be cultured, often fail to meet the needs of aquaculture production units, in quality, as much as in quantity. This is often the reason for failure in production goals. The objective of this work was to develop industrial technology to produce marine diatoms (essential for rearing many animal species in aquaculture), by developing culture media and also by optimizing other ecological variables (for example CO2 enriched atmosphere and cell carrier optimization, to be used in bio-reactor culture), as was already done with other microorganisms (such as yeast and bacteria). An optimized culture medium was successfully developed. On the other hand, bacterial cellulose was found to be a suitable material to be used as cell carrier, enhancing culture productivity of the studied diatoms. A method of cell immobilization was tested, using latex coatings, to assess the possibility of preserving long-term cell viability. This preservation method still needs optimization. The diatoms chosen for the present study were Navicula sp. and Amphora sp., for they are the main plankton feed needed for the rearing of Haliotis tuberculata, a marine gastropod (mollusk, shellfish) highly prized in many gastronomical cultures around the world.
IX
O
RGANIZATION OF THE
D
ISSERTATION
This work is organized in Chapters concerning the different subjects addressed. In Chapter 1, basic concepts about diatoms and possible applications are presented. Also, the role of diatoms in aquaculture is explored, and their application in the production of a specific organism (mollusk, Haliotis tuberculata) is explained. Finally, a way of establishing the suitable diatoms for feeding this mollusk is described.
In Chapter 2, the materials used and methods tested in this work are described.
In Chapter 3, optimization of a method for bio-reactor culture of benthic diatoms is presented. This work is not yet completed.
The results of Chapter 3 created the need of finding an ideal material to use as cell carrier of benthic diatom cells. In Chapter 4, different materials were tested for Amphora sp. and an interesting material was found: bacterial cellulose gel. Moreover, the concentration of this material in the culture medium was successfully optimized. This subject originated a scientific paper, presented in this chapter.
In Chapter 5, a method for preserving diatom cultures for long periods of time was tested. This method consists on immobilizing diatom cells in a latex matrix (coating). This work is not yet completed.
In Chapter 6, a method for finding ideal nutrient concentrations in culture medium was applied, to enhance biomass production of Amphora sp. and Navicula sp. Ideal concentrations of silica and nitrates were found for Navicula sp., and biomass production was significantly enhanced. This subject led to a scientific paper, presented in this chapter. Concerning Amphora sp., results were not statistically valid, although the optimized culture medium found did enhance biomass production. This was however less than those found for Navicula sp. This subject should be further developed.
XI
I
NDEX
Agradecimentos……….iii
Resumo………...v
Abstract……….vii
Organization of the Dissertation………ix
Lista de Figuras………xiii
Lista de Tabelas………....…...xvii
Lista de Abreviaturas, Siglas e Acrónimos………..xix
Chapter1.Introduction………..…..1
1.1 Diatoms- Concepts and Applications………1
1.1.1 Taxonomy and Morphology………...1
1.1.2 Life Cycle………4
1.1.3 Applications………...……….5
1.2 Diatoms and Aquaculture……….6
1.2.1 Aquaculture: Present Status………...……….6
1.2.2 Role of diatoms in aquaculture………..……….9
1.3 Case Study- Abalone (Haliotis tuberculata) ………..….9
1.3.1 Abalone Lifecycle………..………..…….10
1.4 Diatoms for aquaculture of Haliotis tuberculata………..14
Chapter2.Materials and Methods………...………...17
2.1 Obtaining the diatoms Navicula sp. and Amphora sp. ……….. 17
2.2 Cultivation of Navicula sp. and Amphora sp. ……… 17
2.3 Culture and preservation methods to be tested and optimized………18
2.3.1 Analytical Methods………..…….18
2.3.2 Bio-Reactor Cell Culture………..…….21
2.3.3 Cell Carrier optimization………..….22
2.3.4 Cell preservation in latex coatings………..………..…….22
2.3.5 Culture media optimization………..….22
XII
3.1 Bio-reactor culture using 4.5 L bio-reactor and dosing pump. ……….. 25
3.2 Bio-reactor culture using 4.5 L bio-reactor and peristaltic pump. ………. 26
3.3 Bio-reactor culture using 600 mL bio-reactor and air-compressor………27
3.4 Bio-reactor culture using 600 mL bio-reactor and air-compressor, with CO2 sparging from 70 L bottle…..……….…..28
3.4.2 Testing the buffer effect of NaOH (10 M) to prevent abrupt decrease in pH.………..………..….29
3.4.3 Testing the buffer effect of Na2CO3 (30%) to prevent abrupt decrease in pH.………..………...….29
3.4.4 Testing the buffer effect of K2CO3 (5.25 g/L) to prevent abrupt decrease in pH.………..………..…….30
3.4.5 Testing the buffer effect of Na2HPO4 (28.3 g/L) + KH2PO4 (13.6 g/L) to prevent abrupt decrease in pH.………..….30
3.5 Providing CO2 to the cultures through a chemical reaction………...31
Chapter4.Finding a suitable material to use as cell carrier for benthic diatoms………...33
4.1 Testing microcrystalline cellulose particles as cell carriers. ………. 33
4.2 Testing different materials to be used as cell carriers, through experimentation in flask culture……….………...……….………..…33
Chapter5.Diatom culture preservation through immobilization in latex coatings…………...45
Chapter6.Culture medium optimization. ……….47
Conclusion………...………..………...………….59
References………61
Annex I – Guillard’s F2 + Si culture medium for marine diatoms………..67
XIII
L
ISTA DE
F
IGURAS
Chapter 1
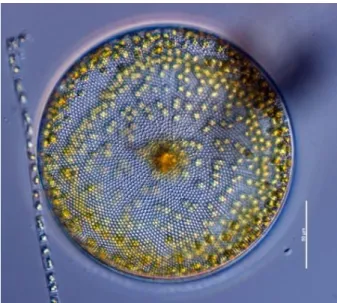
Figure 1- “Example for Coscinidiscophyceae class morphology”. Phyto'pedia- The Phytoplankton Encyclopaedia Project. UBC Department of Earth, Ocean and Atmospheric Sciences.
http://www.eos.ubc.ca/research/phytoplankton/diatoms/centric/coscinodiscus/c_centralis.html Figure 2- “Example for Fragilariophyceae class morphology” Taxateca. http://www.taxateca.com/clasefragilariophyceae.html
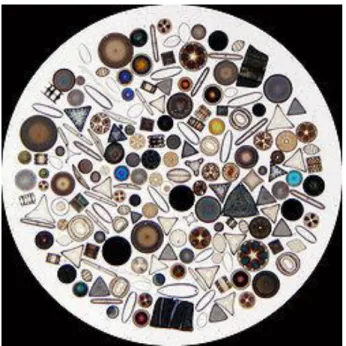
Figure 3- “Example for Bacillariophyceae class morphology”. University of Michigan. http://rivers.snre.umich.edu/www311/Algae_microinvert_Lab/Photos/Bacillariophyceae/ Figure 4- “Circle of diatoms on a slide”, 10/01/2009. Source: Own work by author Wipeter. https://en.wikipedia.org/wiki/Diatom
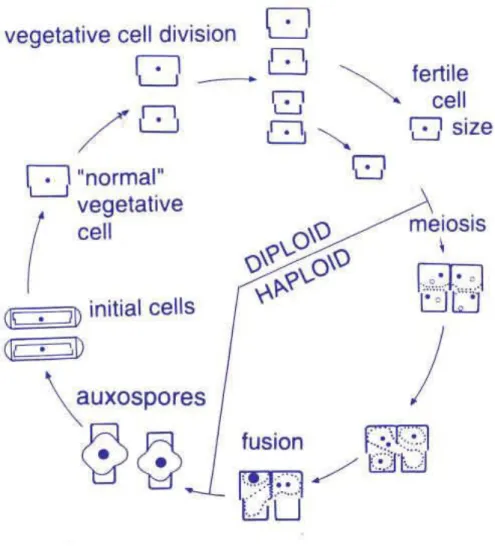
Figure 5- “Diatoms life cycle”. Jack R. Holt, Carlos A. Iudica. The Science of Biodiversity. http://comenius.susqu.edu/biol/202/chromalveolata/heterokontae/bacillariophyta/
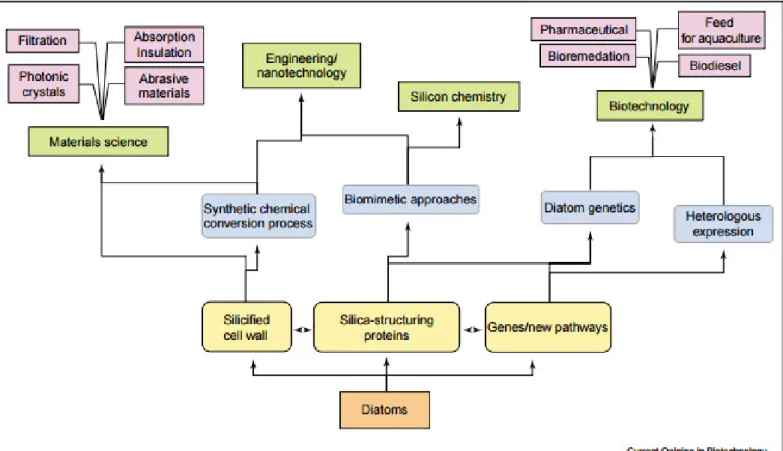
Figure 6. “Prospects in diatom research” (Pascal et. al, 2015).
Figure 7- “World capture fisheries and aquaculture production” (FAO, 2014). Figure 8- “European abalone, Haliotis tuberculata”. Encyclopaedia Britannica. http://www.britannica.com/animal/abalone/images-videos
Figure 9- “Abalone internal morphology” (Mgaya, 1995).
Figure 10- “Abalone morphology during planktonic phase of lifecycle” (Mgaya, 1995). Figure 11- “Abalone morphology during benthic phase of lifecycle” (Mgaya, 1995).
XIV
Figure 12- “Palmaria palmata”. Seaweed Industry Association https://seaweedindustry.com/seaweed/type/palmaria-palmata Figure 13- “Ulva lactuca”. Seaweed Industry Association https://seaweedindustry.com/seaweed/type/ulva-lactuca Figure 14- “Laminaria digitata”.Cape Farewell
http://www.capefarewell.com/2011expedition/2011/07/08/seaweed-a-natural-resource-with-much-potential/
Figure 15- “Diatom frustules in the gut content of abalone larvae” (Zhang, et al., 2010).
Chapter 2
Figure 18- “Flow cytometer operating principle and signal processing” (Bauer et al. 1980; Dubelaar et al. 1999).
Chapter 4
Figure 1- “Amphora sp. diatoms growth on different materials”.
Figure 2- “Cultures growing (8days) on media containing increasing BC gel concentrations”.
Chapter 5
XV
Chapter 6
Figure 1- “Navicula sp. cell concentration ratio model response graph”.
Figure 2 – “Obtained cell concentration ratio when incubating Navicula sp. in standard f/2+Si culture medium and in the optimized f/2+Si using the central composite design (CCD). The “*” represent a statistical significant difference p < 0.001 by using t-test (n = 5). The results are presented as average ± standard deviation”.
XVII
L
ISTA DE
T
ABELAS
Chapter 1
Table 1- “World capture fisheries and aquaculture production” (FAO, 2014).
Table 2- “Consumption clearances of shellfish species by production zone, data from 6/10/2016
(IPMA- Portuguese Sea and Atmosphere Institute)”.
http://www.ipma.pt/resources.www/transf/biotoxinas/rb_bivalves_061016.pdf
Table 3- “Shellfish species unsuitable for human consumption due to biotoxin contamination, data from 06/10/2016 by production zone and bivalve species (DSP-Diarrhoeic Shellfish Poisoning) (IPMA- Portuguese Sea and Atmosphere Institute).”
http://www.ipma.pt/resources.www/transf/biotoxinas/rb_bivalves_061016.pdf
Chapter 4
Table 1- “Performance of different BC gel concentrations”.
Table 2- “Cell concentration of different culture conditions over time (cells/μL)”.
Chapter 6
Table 1- “Experimental variables, levels and concentrations used in the central composite design”.
Table 2- “Central composite design matrix, comprising the experimental runs, variables and obtained response values and respective predicted values”.
XVIII
Table 3- “Central Composite Design (CCD) analysis of variance (ANOVA) parameters of the quadratic model for the cell concentration ratio. “x1” corresponds to nitrate, “x2” to silica and “*” indicates the significant model terms”.
Table 4- “Model adequacy values, the standard deviation (SD), prediction error sum of squares (PRESS), coefficient of determination (R2), absolute average deviation (ADD), adjusted coefficient of determination (R2adj.), adequate precision (AP) and coefficient of variation (CV)”.
XIX
L
ISTA DE
A
BREVIATURAS
,
S
IGLAS E
A
CRÓNIMOS
ANOVA- Analysis of variance BC- Bacterial Cellulose
BLAST- Basic Local Alignment Research Tool CCAP- Culture Collection of Algae and Protozoa CCD- Central Composite Design
CSLM- Confocal Scanning Laser Microscope DSP- Diarrhoic Shellfish Poisoning
FAO- Food and Agriculture Organization for the United Nations IPMA- Portuguese Sea and Atmosphere Institute
NCBI- National Center for Biotechnological Information PUFA- Polyunsaturated Fatty Acids
RSM- Response Surface Methodology SEM- Scan Electron Microscopy
1
C
HAPTER
1-
I
NTRODUCTION
1.1-
Diatoms- Concepts and Applications
Diatoms are photosynthetic unicellular organisms that rose to prominence about 100 million years ago in the world primitive oceans. These organisms are responsible for about one fifth of the photosynthetic activity on Earth, this activity generating as much organic carbon in the seas as all the terrestrial rainforests combined, each year. The organic carbon generated by diatoms is the base for marine food webs, in coastal waters, supporting our most productive fisheries. In open-ocean, it sinks from the surface and becomes food for deep water organisms, and if it is not consumed, it settles on the sea floor and is sequestered on sediments and rocks, over geological time scales, becoming part of oil reserves (Falkowsky, 1998, Armbrust, 2009).
1.1.1-Taxonomy and Morphology
Diatoms are a group of algae, sizes between 20-200 µm (Gordon et al, 2009)with chlorophylls a and c. They can be benthic, living attached to surfaces like rocks, other algae, plants or animals, or planktonic, living free in water columns. They are widespread in the world aquatic environments. Diatoms have characteristic siliceous cell walls called frustules, and yellow-brown pigmentation. Each cell wall (frustule) is divided in two halves, called thecae, one larger than the other, that fit together like a petri dish, and are held together by a series of siliceous hoops, or girdle bands. New girdle bands are laid down during cell growth. Some diatom species have a longitudinal groove involved in motility called raphe (those who have it are said to be raphid diatoms, while those who do not are araphid). Species differ from one another in patterns of pores and other cell-wall structures, so this morphological features can be used to classify diatoms taxonomically (Armbrust, 2009). The spermatozoids of the oogamous genera are flagellated.
Nowadays, the main features used to classify diatoms are still their mode of sexual reproduction and pattern centers of symmetry (Andersen, 2004). In this manner a distinction can be made between oogamous centric diatoms with radially organized valves, from the isogamous pennate diatoms with their valves organized bilaterally and with fewer plate-like plastids (Mann, 1999).
2
The present classification system at order level and below is based in the morphology of cell-wall structures, and some important features used to classify diatoms at these levels are the raphe and the labiate or strutted processes through the cell wall. Three classes are now recognized: Coscinodiscophyceae (centric diatoms, Figure 1); Fragilariophyceae (araphid pennate diatoms, Figure 2); Bacillariophyceae (raphid pennate diatoms, Figure 3) (Medlin, Kaczmarska, 2004). Identification based on frustule structures is made by optical microscopy, and with SEM (Scan Electron Microscopy), when clarification is necessary to infer at species level. This classification systemdoes not reflect phylogenetic relations between the groups of diatoms; it is however a generally accepted – however artificial – classification (Cox &Williams, 2006)
Figure 1-Example for Coscinidiscophyceae class morphology (source: Phyto'pedia).
3
Figure 2-Example for Fragilariophyceae class morphology (source: taxateca.com). http://www.taxateca.com/clasefragilariophyceae.html (29/05/2015)
Figure 3-Example for Bacillariophyceae class morphology (source: University of Michigan). http://rivers.snre.umich.edu/www311/Algae_microinvert_Lab/Photos/Bacillariophyceae/ (29/05/2015)
Although these are examples of the most common morphologies inherent to each class, there are many morphologic variations even within the same classes. Figure 4 shows some of the many shapes diatoms can display.
4
Figure 4-Example for the variety of shapes in the diatom world (source: Wipeter, 2009). https://en.wikipedia.org/wiki/Diatom (29/05/2015)
1.1.2- Life Cycle
There are two alternating phases in the diatom live cycle, one vegetative phase, in which the cell can be diploid for months or years, dividing mitotically and progressively decreasing in size in the process, and another phase lasting a few days, in which the cell reproduces sexually, restoring maximum size through the formation of an auxospore. Size reduction during mitosis is explained because when a cell divides in two, each daughter cell inherits one of the parental cell’s thecae (from its frustule), which forms the ‘top’ (epitheca) of its new frustule, and then manufactures a new ‘bottom’ theca (hypotheca) itself during the cell cycle. The hypothecae are initiated while enclosed by the parental epithecae that preceded them, thus determining their size. The hypothecae are always smaller than the epithecae, and so the daughter cells that originated from parental hypothecae are smaller than the ones originated by parental epithecae. Over time, during the vegetative phase, cell size of the population decreases. To restore cell size within the population, diatoms develop a specialized cell, through sexual reproduction, the auxospore, sloughing off the old thecae and maturing the zygote, expanding until reaching maximum size. At this time, a new initial cell forms inside the auxospore, two to three times larger than the parental cells. These restored size cells then go back to vegetative phase and start dividing mitotically again (Chepurnov et al., 2005; Gillard, 2010). Figure 5 schematizes this process that can be said general to all diatoms.
5
Figure 5-Diatoms life cycle (source:The Science of Biodiversity). http://comenius.susqu.edu/biol/202/chromalveolata/heterokontae/bacillariophyta/ (30/05/2015)
1.1.3- Applications
Diatoms have several applications, for example, in cosmetic industry, due to the wide range of amino-acids they produce, pharmaceutical industry, for they produce polyunsaturated fatty acids (PUFA), producing diatomite, which is a low density, highly porous siliceous material derived from the compaction of diatom remains over geological time scales, that have various applications in the biotechnological, food and beverage, agricultural and chemical industries, for insulation, filtration, adsorption, building materials etc. (Lopez et al., 2005) Figure 6 shows various fields and application domains for diatom research.
6
Figure 6-Fields and application domains for diatom research (Lopez et al., 2005).
Aquaculture is one of the promising biotechnological applications of diatoms: they are used to feed many animal species, especially in early stages of development, for in the larval and post larval life stages diatoms are the main source of nutrients for most marine animal species. The next chapter details the application of diatoms as aquaculture diets.
1.2-
Diatoms and Aquaculture
1.2.1-Aquaculture: Present Status
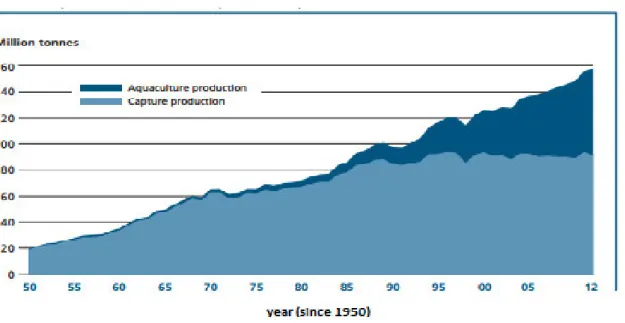
Nowadays aquaculture is the fastest growing food production sector in the world (FAO, 2014). It is developing, expanding and intensifying in almost every region worldwide. The fishing captures have been diminishing for the last decades, which, considering the world growing population (and consequent growing in demand of aquatic products), calls for the
7
development of sustainable and efficient aquaculture techniques, to meet the market needs (Jackson et al., 2001; Subasinghe et al, 2009). Figure 7 and Table 1 present these data.
Figure 7-World capture fisheries and aquaculture production (FAO, 2014).
8
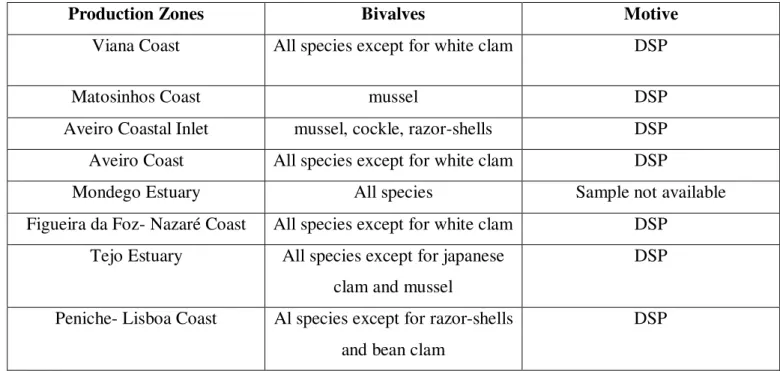
Aquaculture inshore production is also growing, due to the advantages of this method, namely, increased larval survival rates and less susceptibility to production losses due to bad weather, input water quality and polluting effluents treatment. Furthermore, seafood culturing in off-shore coastal farms is vulnerable to infection by plankton species that produce bio-toxins, making the products unsuitable for human consumption for indefinite periods of time. Table 2 and 3 display clearances and interdictions on the consumption of several species of shellfish caught in Portuguese waters, due to bio-toxins, on October 6th 2016.
Table 2- Consumption clearances of shellfish species by production zone, data from 6/10/2016 (IPMA- Portuguese Sea and Atmosphere Institute).
http://www.ipma.pt/resources.www/transf/biotoxinas/rb_bivalves_061016.pdf (8/10/2016)
Production Zones Changes since last report
Matosinhos Coast Bittersweet clam clearance
Peniche-Lisboa Coast Bean clam clearance
Table 3-Shellfish species unsuitable for human consumption due to biotoxin contamination, data from 06/10/2016 by production zone and bivalve species (DSP-Diarrhetic Shellfish Poisoning) (IPMA- Portuguese Sea and Atmosphere Institute).
http://www.ipma.pt/resources.www/transf/biotoxinas/rb_bivalves_061016.pdf (8/10/2016)
Production Zones Bivalves Motive
Viana Coast All species except for white clam DSP
Matosinhos Coast mussel DSP
Aveiro Coastal Inlet mussel, cockle, razor-shells DSP Aveiro Coast All species except for white clam DSP
Mondego Estuary All species Sample not available
Figueira da Foz- Nazaré Coast All species except for white clam DSP Tejo Estuary All species except for japanese
clam and mussel
DSP Peniche- Lisboa Coast Al species except for razor-shells
and bean clam
9
In inshore production units this problem can be avoided by filtering seawater, removing the phytoplankton responsible for the biotoxins production, thus making the seafood suitable for human consumption. As a result, inshore production methods optimization is being regarded as fundamental for the future of aquaculture (Muki Shpigel, 2005; Zong et al., 1996)
1.2.2-Role of diatoms in aquaculture .
One of the main constraints of inshore aquaculture, particularly of molusk production, is to select and successfully produce specific plankton, optimal for rearing each molusk species. Producing this plankton-feed is a key factor for the success of inshore aquaculture units. Some examples of marine animal species produced in aquaculture, that feed on diatoms at some development stage are:
Pacific oyster (Crassostrea gigas) (Beninger et al., 2008);
Green tiger shrimp (Penaeus semisulcatus) (Al-Maslamani et al., 2007);
Sea scallops (Placopecten magellanicus); (Milke et al., 2004)
Limpet (Crepidula onyx); (Chiu et al., 2007)
Abalone (Haliotis spp.) (De Viçose et al., 2007)
These are just few of many animals of comercial value that require diatoms, to be produced in aquaculture. The goal of the present work is the optimization of culturing two diatom species, ideal for feeding the molusk “european abalone” (Haliotis tuberculata), a highly prized species in many countries.
1.3-
Case Study- Abalone (Haliotis tuberculata)
Abalone is a marine gastropod (mollusk) highly prized in many gastronomical cultures around the world. It is widespread in the coastal waters of many countries, and it has been
10
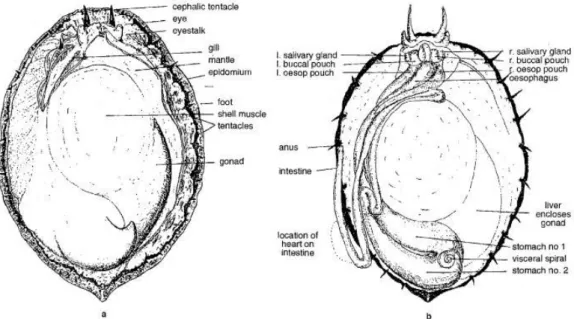
overfished during the twentieth century, while the markets demand for this delicacy kept rising. This created a need for the optimization of aquaculture techniques to produce abalone, while preserving wild populations of the mollusk. The following pictures show the external and internal morphology of the abalone.
Figure 8-European abalone, Haliotis tuberculata (source: Encyclopaedia Britannica) http://www.britannica.com/animal/abalone/images-videos (1/06/2015)
Figure 9-Abalone internal morphology (Mgaya 1995).
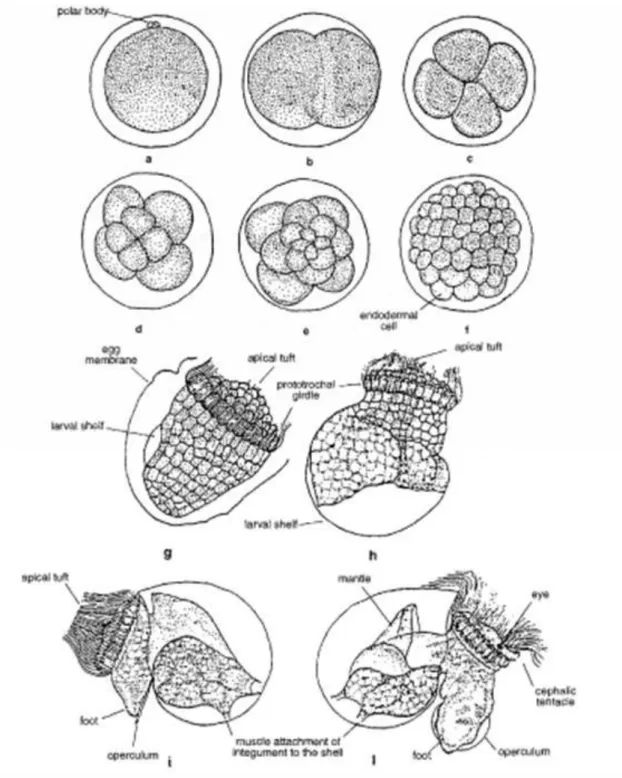
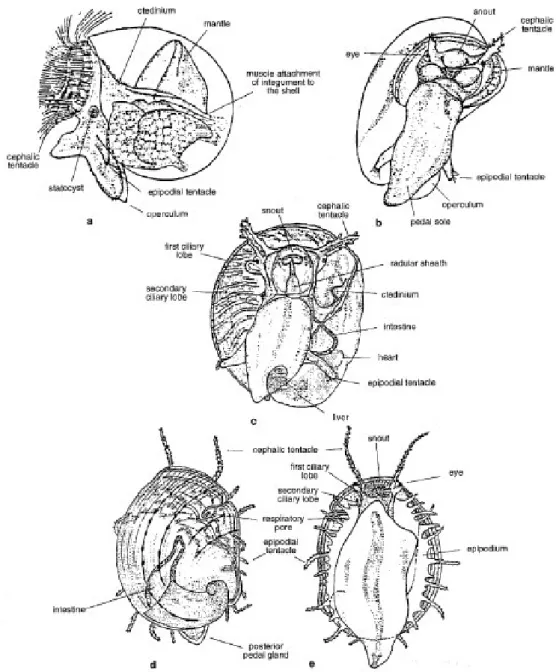
1.3.1- Abalone Lifecycle (Mgaya, 1995)
11
12
As shown in Figure 10, after hatching from eggs, abalones go through a trochophore larval stage, in which they live free in the water column (planktonic phase), using stored yolk reserves until metamorphosis. After metamorphosis, they attach to available surfaces (benthic phase), only if a settlement substratum is present, in the form of a biofilm constituted mainly by diatoms, which they graze for feeding until they reach adult morphology. Figure 11 shows the development of the abalone during the benthic phase.
13
During the benthic larval phase of abalone life, feeding is exclusively on biofilm composed mainly by diatoms, after which it feeds on macroalgae abundant in coastal waters, such as Palmaria palmata (Figure 12), Ulva lactuca (Figure 13) and Laminaria digitata (Figure 14) (Shpigel et al., 1992). It is thus crucial to provide the specific diatom diet to hatching larvae when rearing abalone in aquaculture.
Figure 14-Laminaria digitata (source: Cape Farewell) Figure 12-Palmaria palmata
(source: Seaweed Industry Association). https://seaweedindustry.com/seaweed/type/palm aria-palmata (2/06/2015)
Figure 13-Ulva lactuca
(source:Seaweed Industry Association). https://seaweedindustry.com/seaweed/type/ulva -lactuca (2/06/2015)
http://www.capefarewell.com/2011expedition/2011/07/0 8/seaweed-a-natural-resource-with-much-potential/
14
1.4-
Diatoms for aquaculture of Haliotis tuberculata
The selection of the best diatom species to feed a particular species of mollusk can be made by taking an environmental sample of biofilm on the natural habitat of the mollusk, isolate the several microalgae species present, and make trials to observe which alga species produce the fastest growth in the populations of the animal larvae (Zhang et al., 2010).
Mollusk larvae diets are often composed by several algae species, most of them diatoms (Chiu et al., 2007; Milke et al., 2004; Slattery, 1992).
Because diatoms siliceous cell wall shapes are characteristic of each species, one way of selecting the best diatoms to feed the abalone Haliotis tuberculata is to prepare a mixed culture of several benthic diatom species and add abalone larvae to the biofilm formed by the algae culture. The larvae are going to graze on the biofilm, and later the larvae guts can be dissected and inspected for the presence of frustules of ingested diatoms with SEM (Scanning Electron Microscope) (Siqueiros-beltrones et al., 2005). In this way, diatom species ingested by the larvae, can be identified by the shapes of the frustules, particular to each species. Observing the biofilm in SEM too, a relation between the amount of each species in the larvae guts and in the biofilm can be determined. This relation can tell us which diatom species are preferred by the larvae, and then select these diatoms to be cultured and fed them to the larvae (Ko & Hur, 2011). Figure 15 shows different diatom species in the gut content of abalone larvae, observed in SEM.
15
Figure 15-Diatom frustules in the gut content of abalone larvae (Zhang et al. 2010).
The techniques referred above allowed us to know that the ideal diatom species to feed
17
C
HAPTER
2-
M
ATERIALS AND
M
ETHODS
2.1-
Obtaining the diatoms Navicula sp. and Amphora sp.
The strains were obtained from CCAP (Culture Collection of Algae and Protozoa). They were originally collected in Crinan Harbour, near Oban, Scotland, UK 56.4200N 5.5200W (v. approx.) and isolated by Andersen in 2006. Cultures came with bacteria, from the environmental samples used to isolate diatom species. Several trials were made to turn the cultures axenic but they were all unsuccessful, so the work was carried on with these bacteria.
2.2- Cultivation of Navicula sp. and Amphora sp.
Culture medium
F2 medium (Guillard & Rhyther, 1975) was used to maintain all the cultures of this assay (formulation is available in Annex 1 and is the one suggested by CCAP. Natural seawater was collected during the high tide in the coordinates 41°29'06.6"N 8°46'51.5"W, filtered (0.2 µm pore size) and sterilized in an autoclave.
Light, temperature and stirring
Stock-cultures were incubated in T-flasks inside a cabinet with air-conditioner (Panasonic Inverter Econavi) keeping temperature near 20 °C at all times. Light cycle was controlled by a timer (CYLLUX ELECTRIC), 12 h/12 h light/dark. The T-flasks (Orange Scientific- or flask 150 cm2) were gently stirred at 50 rpm on a stirring plate (ELMI Type DOS- 20 L), as showed in Figure 16.
18
Figure 16-Cabinet containing cultures in the conditions described above.
Culture maintenance and monitoring
New cultures were made every two weeks to maintain culture viability constant. Cultures are observed at the microscope every week to assure culture viability.
2.3-
Culture and preservation methods tested and optimized
2.3.1- Analytical Methods
This work focused on monitoring the cell concentration of diatom cultures exposed to different environmental variables and find the ones that traduce in fastest population growth. Furthermore a new preservation method was be tested to secure the viability of refrigerated diatom vials, used for cell propagation.
The methods used for monitoring cell concentration were flow cytometer analysis and dry weight measurements. Results were initially compared to cell counts done in a Neubauer chamber, observed by optical microscopy. Also, in assays using culture medium containing cell carriers, spectrefluorimetry readings were used to monitor diatom concentration in cultures.
In flow cytometry, a known volume of cell solution is pumped in a single fluid stream through the analysis point (which is a zone of intense illumination, where the light scattering and fluorescence of particles are detected) at speeds of more than 1000 cells per second, and each passing particle is detected by photomultiplier tubes. This way it is possible to detect diatom culture cell concentration and viability, because the chlorophyll in diatoms chloroplasts appears red when exposed to ultraviolet light. The sensors in the cytometer detect the amount
19
of cells that turn red when exposed to the ultraviolet light, and give information about the amount of cells, and the cell viability percent on a sample. Furthermore it is possible to monitor the growth of bacteria associated with the diatoms, using a dye (Syto 9, Thermofisher Scientific) that discriminates the bacteria, making it possible to monitor the diatom/bacteria ratio in cultures.
For this work a EC800 Flow Cytometry Analyser (Sony Biotechnology Inc., Champaign, IL, USA) equipped with an argon-blue laser (488 nm) was used (Figure 18).
For fluorimetry readings, a Spectroflurimeter (HORIBA AQUALOG 800) and a quartz cell (QS High Precision cell, Art. Nº 140-F-10-40, Hellma Analytics) were used.
Figure 17-Flow cytometer used in this work.
Figure 18 shows the schematic drawing of a flow cytometer operating principle and signal processing.
20
Figure 18- Flow cytometer operating principle and signal processing (Bauer et al. 1980; Dubelaar et al. 1999)
21
Figure 19-Spectrofluorimeter used in this work.
A Confocal Scanning Laser Microscope (Olympus BX61, Model FluoView 1000, Olympus Iberia S.A.U. Portugal) and an epifluorescence microscope (Olympus BX51, Olympus Iberia S.A.U. Portugal) were used to observe the cultures.
2.3.2-
Bio-Reactor Cell CultureCell culture in bio-reactor is indispensable in industrial algae production, for it enables high biomass yields, due to high culture volumes and wide manipulation of environmental variables. Existing methods for diatom culture in bio-reactor are still underdeveloped, therefore an investigation was carried out to address this issue. Diatoms are photosynthetic organisms, therefore they consume carbon dioxide. As a result, culturing diatom cells in a gas-lift
bio-Figure 20-Confocal Scanning Laser Microscope used in this work.
Figure 21--Epifluorescence Microscope used in this work.
22
reactor would make possible to provide high carbon dioxide concentrations to the cells, and that might have a positive effect on cultures cell concentration increase (Wu et al., 2010). Several experiments were carried out, testing different techniques, to ascertain an efficient method of culturing diatoms in bio-reactor. This subject will be addressed in Chapter 3.
2.3.3- Cell carrier optimization
The diatoms on study are benthic, meaning they grow attached to surfaces. Thus, it can be hypothesized that cell culture performance in a bioreactor might be enhanced by providing extra surface area to carry the cells (Branco et al., 2007). Several materials were tested, using culture flasks. This subject will be addressed in Chapter 4.
2.3.4- Cell preservation in latex coatings
Cell immobilization can increase viability of preserved microbial cultures.
An immobilization technique was tested, already in use for other microorganisms (Bernal et al., 2014). This method consists on using latex coatings to immobilize microorganisms. The viability of diatom preserved cultures with this method was assessed periodically.
Using this method, Gosse et al. observed that immobilized bacterial cells were more reactive than an equivalent number of suspended or settled cells and remained active after hydrated storage for greater than 3 months in the dark and 1 year when stored at -80 ºC (Gosse et al., 2007). For these reasons it is possible that the immobilization method described in Chapter 5 can preserve diatom cells for longer periods of time than the previously existing methods.
2.3.5- Culture media optimization
Because diatoms siliceous cell wall comprises a large part of the cell volume, trials were conducted to see if higher concentrations of silica in the culture medium would result in faster population growth (Thamatrakoln & Hildebrand, 2008).
Culture media with growing concentrations of silica, starting from the standard f2 medium concentration (control, see Annex 1) were formulated, and the effects on cell concentration were compared with the ones obtained in control cultures.
Diatoms also need a source of nitrogen, for protein synthesis, which is provided in the f2 culture medium, under the form of NaNO3, so the study proceed, as described above for the
23
optimization of silica concentration in the culture medium (Daume et al., 2003). This subject will be addressed in Chapter 6.
25
C
HAPTER
3-
B
IO
-R
EACTOR
C
ELL
C
ULTURE
3.1-
Bio-reactor culture using 4.5 L bio-reactor and dosing pump
Preliminary tests were performed using a bio-reactor displayed in Figures 22, 23 and 24. Red arrows represent water going out of the reactor, yellow arrows represent water going inside the reactor, and green arrows represent CO2 going inside the reactor (when activated).
In this chapter, Amphora sp. diatoms were used.
At first, no extra CO2 was provided to the reactor. Water was recirculated using a dosing pump (Plasteral S.A- Type HD MA), displayed in Figure 25, leaving the bio-reactor through tube 1, and being pumped inside again through tube 2 and tube 3. So, the mixture of the cell solution must be promoted, making conditions homogenous to all the cells in the reactor. Air exchanges were made through an entrance covered in gauze on the top of the reactor. Daily samples were observed in epifluorescence microscopy. This trial lasted 4 days.
Figure 22-Bio-reactor (4.5 L) used in this work (front view).
Figure 23-Bio-reactor (4.5 L) used in this work (side view).
26
Diatom cells viability decreased over 3 days until it was close to zero, along with continuous increase in bacteria concentration. Microscopic observation showed that the diatoms frustules were shattered, probably crushed by the dosing pump’s piston, for they are made of silica (glass), and are consequently fragile to mechanical stress. Although there is no information on the bacteria present, this could indicate that, maybe, they are heterotrophic and feed on dead diatoms. Furthermore, this trial made us realize the reactor’s design was prone to cell accumulation on corners and on the ramp. A steeper ramp was installed.
The dosing pump was replaced by a peristaltic pump to test if this would relieve the cells from the mechanical stress.
3.2-
Bio-reactor culture using 4,5 L bio-reactor and peristaltic pump
Following the results described previously, a test took place using the reactor with a steeper ramp, and replaced the previously used dosing pump with a peristaltic pump (Watson Marlow 323 U.S.A. Figure 26), to check if this new pump would subject the cells to less
Figure 24-Bio-reactor (4.5 L) used in this work (back view).
Figure 25-Peristaltic pump used in this work.
27
mechanical stress, and so preserve their viability. Samples were observed daily in epifluorescence microscopy. This trial lasted 4 days.
Microscopic observations showed that the peristaltic pump also crushed the cells and so it would have to be replaced. Furthermore, the new steeper ramp installed did not solve the problem of cell deposition.
It was concluded that this reactor design is not appropriate for culturing cells that are prone to settling, and should be more efficient to grow lighter cells with more buoyancy, so the cells are more easily kept in circulation. Also, it
was clear that the types of pumps used expose the cells to excessive mechanical stress, and a different approach should be used. Moreover, the substantial volume of this reactor resulted in high costs in culture media preparation, for the many trials required to optimize the reactor configuration.
3.3-
Bio-reactor culture using 600 mL bio-reactor and air compressor
This new approach used smaller bio-reactors (Figure 27) along with the use of an air compressor (Figure 28) connected to perforated tubes, through which filtered air bubbles entered the reactor, mixing the culture inside.
Figure 26-Persistaltic pump used in this work.
Figure 27-Bio-reactors (600 mL) used in this work
Figure 28-Air compressor used in this work
28
These perforated tubes were assembled in a spiral shape and kept on the bottom of the reactors, so that the most of the bottom surface of the reactor was covered, in such manner that the air bubbles produced would re-suspend cells that settled there.
The 600 mL bio-reactor and air compressor were assembled, connected by the perforated (spiral shaped) tubes devised, and a test was performed to check if this new culture mixing method would subject the cells to less mechanical stress, while keeping the culture homogenous. The air compressor was connected to an electric timer, programed to be turned on automatically, for 15 min at a time, every 15 min of the day and night. Samples were observed daily in epifluorescence microscopy, and analyzed in flow cytometry every two days, to monitor diatom and bacterial growth. This trial lasted 5 days.
Microscopic observations showed that the new method for mixing the culture preserved diatom cell integrity in the first 3 days, for the air bubbles produced by the air compressor submit the cells to less mechanical stress than the previously tested equipment. Also, this approach successfully kept the culture homogenous, keeping the cells from settling on the bottom of the reactor. However, cytometry readings showed that bacterial growth exceeded diatom growth, which decreased over time. By day 5, microscopic observation showed that diatom cells were completely covered in bacteria. This could derive from the possibility of the bacteria in culture being aerobic, and the oxygen inside the air bubbles (provided by the air compressor) enhanced their growth, resulting in their proliferation over the diatoms (which require CO2 for their metabolism, during the day time of the light cycle). It is possible that the excess of bacteria covering the diatoms prevented light from reaching the cells, thus hampering their growth.
Possibly, bacterial overgrowth could be prevented by providing CO2 to the culture, and simultaneously enhance diatom growth. This hypothesis will be tested in section 3.4.
This type of bio-reactor, with the described configuration (using an air compressor to promote the mixture inside), can be a viable option to culture diatoms, for it does not damage the cells through mechanical stress. This approach will be explored throughout this chapter.
3.4-
Bio-reactor culture using 600 mL bio-reactor and air compressor, with
CO
2sparging from a 70 L bottle
29
3.4.1- An equipment configuration the same as in 3.3 was used.
The objective of this assay was to test the hypothesis of enhancing diatom productivity, while preventing bacterial overgrowth, by providing extra CO2 to the cells in culture. This was tried by sparging this gas for periods of 15 min periods every hour, 6 times a day during the daytime of the light cycle. The CO2 sparging was turned on and off automatically by an electronic valve (ACL Italy, type 20E), connected to an electric timer. The gas stream was kept at the lowest possible by the available flowmeter (ABB PurgeMaster, Workington Uk; minimum flow≈3 L/min). Also, a pH meter (Hanna Instruments, pH 209) was used to monitor changes in pH inside the reactor. Samples were observed daily in epifluorescence microscopy and analyzed in flow cytometry, to monitor diatom and bacterial growth.
This trial lasted 4 days.
When the CO2 sparging was started, an abrupt lowering in pH values was observed (from 7.5 to 5.6 in less than 2 min). Diatom and bacterial concentrations in culture lowered since the tests have started, until they reached zero at day 3. Acceptable pH values for diatom cells are between 7 and 8.5.
The extra CO2 caused an abrupt pH decrease, which was lethal for the microorganisms in culture. It is possible that we the abrupt decrease in pH could be prevented by adding a buffer solution to the culture medium. This approach will be tested in following sections.
3.4.2- Testing the buffer effect of NaOH (10M) to prevent abrupt decrease in pH.
An equipment configuration the same as in 3.4 was used, but
NaOH (10 M) was progressively added to the culture, when CO2 sparging was activated. This trial lasted 3 days.
The adding of NaOH did prevent the abrupt decrease in pH, however it generated white clots immediately when added. Diatom and bacterial concentration in culture decreased over time, possibly because the formation of clots in the culture damaged the cells.
This buffer solution is not a viable solution for the targeted problem.
3.4.3- Testing the buffer effect of Na2CO3 (30 %) to prevent abrupt decrease in pH.
An equipment configuration the same as in 3.4 was used, but
Na2CO3 (30 %) was progressively added to the culture, when CO2 sparging was activated.
30
Progressively higher amounts (5 mL, 10 mL, 20 mL, 30 mL, 40 mL) of Na2CO3 (30 %) were added to the culture, upon the start of CO2 sparging. This resulted in an increase in pH which compensated the decrease caused by CO2 sparging. However, the amounts of buffer required to achieve this compensation were too high for the available culture volume, and would end up diluting the culture (considering the buffer adding was made 6 times a day, even if it was tried to do it fewer times a day, after one week of culturing it would be too high). Furthermore, diatom growth was not increased, compared to control culture values (flask culture).
This buffer solution is not a viable option to solve the targeted problem.
3.4.4- Testing the buffer effect of K2CO3 (5.25 g/L) to prevent abrupt decrease in
pH.
K2CO3 (5.25 g/L) was progressively added to the culture, when CO2 sparging was activated.
This trial lasted for 2 days.
The same results as in 3.4.3 were obtained.
This buffer solution is not a viable solution for the targeted problem.
3.4.5- Testing the buffer effect of Na2HPO4 (28.3 g/L) + KH2PO4 (13.6 g/L) to
prevent abrupt decrease in pH.
A buffer solution composed by Na2HPO4 and KH2PO4, was progressively added to the culture, when CO2 sparging was activated.
This trial lasted 2 days.
The same results as in 3.4.3 and in 3.4.4 were obtained.
This buffer solution is not a viable option to solve the targeted problem.
After the tests described in sections 3.4.1, 3.4.2 and 3.4.3, it was observed that sparging CO2 from a bottle with the available equipment resulted in too abrupt pH decreases, which could not be compensated by the tested methods. For this reason, an alternative method for providing CO2 to the cultures was investigated, as described in section 3.5.
31
3.5-
Providing CO2to the cultures through a chemical reaction
An alternative method for providing CO2 to the culture was tested, which consisted of generating CO2 inside the reactor through a chemical reaction. By adding equal amounts of NaHCO3 (1 M) and HCl (1 M) to the culture, an equal amount of CO2 was generated localy, through the reaction: NaHCO3 (aq.) + HCl (aq.) → CO2 (g) + H2O (l) + NaCl (aq.)
An equipment configuration the same as in section 3.3 was used. This time, no CO2 was provided through sparging; instead, 2 mL of NaHCO3 were added to the culture, followed by 0.5 mL NaHCO3 every hour, until reaching 2 mL NaHCO3. This proceeding was performed during day period of light-cycle, every day, except on days 5 and 6. The pH values were monitored periodically. Triplicate samples were analyzed daily in flow-cytometry to assess diatom and bacteria concentration in culture.
This assay lasted 11 days.
Diatom concentration in culture increased over time, while bacteria concentration kept stable (results presented in Figure 29). The doubling time obtained for diatoms (dt= 1.03 days) was lower than mean values obtained in flask culturing (dt control≈ 1.6 days). The pH values were kept between 7.0 and 8.5 during the adding of NaHCO3 and HCl, with the proceeding described above. During the assay, a biofilm started to colonize the reactor’s walls, which was visible with the naked eye. The biofilm got thicker trough the assay. In the last day of the assay, a sample of the biofilm was taken and observed in microscopy, which showed it was composed of diatoms and associated bacteria.
Figure 29-Diatom and bacteria growth monitoring.
0 100 200 300 400 500 600 700 0 2 4 6 8 10 12 cel ls /µL days
Culture growth (11 days)
diatom growth bacteria growth
32
This method was successful in controlling bacterial overgrowth and it did not lower pH to lethal values for diatoms. It is not clear why bacterial growth was not enhanced by aeration, as it had occurred in section 3.3. It is possible that the CO2 generated in the chemical reaction between NaHCO3 and HCl enhanced diatom growth (because these are photosynthetic organisms), and suppressed bacterial growth (because these are aerobic organisms), therefore avoiding bacterial proliferation. Also, it is possible that the pH lowerings caused by the adding of HCl affected bacterial growth negatively.
The appearance of a biofilm coating the walls of the bio-reactor was expectable, since we were working with benthic diatoms (organisms that grow attached to surfaces). We may speculate that a suitable material to be used as cell carrier, could allow to take full advantage of the reactor volume. This matter will be further developed in Chapter 4.
33
C
HAPTER
4-
F
INDING A
S
UITABLE
M
ATERIAL TO
U
SE AS
C
ELL
C
ARRIER FOR THE
C
ULTURE OF
B
ENTHIC
D
IATOMS
4.1- Testing microcrystalline cellulose (Avicel PH-101 from Sigma-Aldrich) particles as cell carriers
An equipment configuration the same as in 3.3 was used and the proceeding described in 3.5 was performed (to keep the culture homogenous and prevent bacterial overgrowth).
In this assay, microcrystalline cellulose 0.1 % (m/V) was added to the standard culture medium. Samples were observed in microscopy and analyzed in flow cytometry, daily.
This assay lasted 9 days.
Microscopic observations showed that diatoms did not colonize the microcrystalline cellulose particles significantly. Flow cytometry readings showed that diatom growth (was not higher than one obtained in section 3.5. Furthermore, a bacterial growth higher than the one obtained in section 3.5 was also observed, which could be related to the interference of the microcrystalline cellulose particles, made visible at the same wavelength of the bacterial fluorescence. Indeed these bacteria were stained in green from Syto9 dye. Moreover, the naked eye could identify microcrystalline cellulose particles settled at the bio-reactor bottom, seconds after aeration was turned off. This suggested that the particles have low buoyancy for the desired effect.
It can be concluded the tested material is not ideal for carrying benthic diatom cells, because diatoms do not spontaneously colonize the carrier particles, and for its low buoyancy, which might lead to an underutilization of the bio-reactor.
After these results it was decided to test different materials using flask culture, to save resources and better manage the variables involved.
34
4.2- Testing different materials to be used as cell carriers, through experimentation in flask culture
Before starting to test different materials, a different method to monitor diatom growth had to be developed, for the subject materials are composed of particles too big to be analyzed in flow cytometry. For this reason, a correspondence between flow cytometry measurements and other analytic methods was accomplished. These tests lasted 14 days.
The first method tested was to establish a correspondence between flow cytometry values, and absorbance values of a chlorophyll extract from a sample, read in spectrophotometry. Extraction was made using acetone 80 % as solvent. Chlorophyll content of a sample should be proportional to the amount of cells present (Nestler et al., 2012). This approach did not work, because no valid correlation was found (p›0.005 ; R2=0.699).
The second method tested was to establish a correspondence between flow cytometry values, and dry weight and ashes weight of a filtered sample (fiber glass filter 47 mm). A sample (20 mL) was filtered, and then standard protocol to evaluate organic and inorganic matter content was performed. It was concluded that the volume of sample required to have a reliable correlation (between flow cytometry values, dry weight and ashes weight) was too high (approximately 80 mL) and would lead to a waste of cells, that would affect productivity negatively.
The third method tested, was to establish a correspondence between flow cytometry values, and spectrofluorimetry readings of a sample. The full specter of a sample was first performed, being the highest peaks observed at 456 nm (excitation) and 681 nm (emission), so these wavelengths were used throughout the assay. Values obtained for emissivity at 681 nm were used to establish a correlation with flow cytometry values. The same sample was then analyzed in flow cytometry. This proceeding was used to devise a linear regression, which related flow cytometry and spectrofluorimetry values (R2=0.907), thus allowing us to calculate cell concentration of samples containing cells carriers, which could not be analyzed in flow cytometry.
Several materials were tested as cell carriers, and an ideal material was found. This investigation is described in the following scientific paper, which was submitted to Aquaculture journal (presented in the next page).
35
Bacterial cellulose gel increases growth productivity of marine diatom
Amphora
sp.
David K. Mota, Nicolina Dias, Ana Nicolau, José Teixeira, Manuel Mota
CEB - Centre of Biological Engineering, University of Minho, 4710-057 Braga, Portugal
Abstract
Benthic diatoms are used in aquaculture as larvae feed of many commercial valued seafood, such as abalone, and high efficiency cell culture methods in bioreactors are needed to meet the increasing production demand of primary feed. As they grow better attached to surfaces, finding an ideal material for cell carrying is essential. After tests with several materials, bacterial cellulose gel was found to be ideal for carrying benthic diatom cells, because of its buoyancy, fiber size, cell affinity and biodegradability. Different concentrations of bacterial cellulose were tested and an optimal concentration was found. Using this new material avoids cell deposition at the bottom of bioreactors and the surface area available for cell attachment is increased, thus allowing to double biomass production.
Research highlights
A suitable, biodegradable material for benthic diatom cell carrying was found (Bacterial Cellulose gel), enhancing productivity over 2-fold, under the optimized conditions described. Keywords: aquaculture; benthic diatoms; cell carrier; bacterial cellulose
1-Introduction
Diatoms of the Amphora species are commonly used as feed for the larvae of marine gastropods (Chiu et al., 2007), particularly the abalone Haliotis tuberculata (Shpigel et al., 1992). After hatching from planktonic eggs, abalone larvae go through a pelagic life stage during which dispersion and colonization of new habitats take place (De Viçose et al., 2007; Pechenik, 1999). Chemical signals produced by diatoms living on biofilms stimulate larvae settling and metamorphosis to develop morphological features which allow them to graze on diatom biofilms (post larvae benthic life stage) until the juvenile stage is reached (Morse & Morse, 1984; Slattery, 1992). From then on, abalone juveniles and adults feed on macro-algae of several species (Setyono, 2005). Producing enough diatoms to feed abalone larvae until they reach the juvenile phase is crucial for successful aquaculture production of this seafood species
36
(Takami, 2003). Amphora diatom species are benthic, meaning they grow attached to surfaces. It can be hypothesized that cell culture performance in a bioreactor may be enhanced by providing extra surface area to carry the cells (Branco et al., 2007). In this work, several materials were tested to appraise their viability as benthic diatoms cell carriers.
Cellulose biosynthesis by the bacteria Acetobacter xylinum, currently named
Gluconacetobacter xylinus (Yamadaet al., 1997), was first described in 1886 by Brown (Brown,
1886), who isolated this microorganism and identified the polymer it produces as cellulose. This process was thoroughly studied since (Brown et al., 1976) for the potential of this material mechanical properties, such as mechanical strength, hydrophilicity, chirality, biodegradability, high water content, high degree of crystallinity and polymerization, and high purity (Klemm et al., 2005). Bacterial Cellulose (BC) has been used successfully as carrier for the immobilization of yeast (Yao et al., 2011) and bacteria cells (Rezaee et al., 2008). The goal of the present work was to appraise the possibility of increasing Amphora sp. culture productivity by using BC gel under optimized conditions.
2-
Materials and Methods
2.1- Preliminary tests were performed to select a suitable material to be used as cell carrier.
The following materials were tested:
2.1.1- Microcrystalline cellulose (Avicel PH-101 from Sigma-Aldrich) in a concentration of
1 g/L.
2.1.2- Glass fiber tatters (Motip, 300 g/m2). In this work, tatters sized approximately 12 mm3 were mixed in the standard culture medium; it was used in a concentration of 10 g/L.
2.1.3- Bacterial cellulose paste (Satisfibre, Braga, Portugal) was used in a concentration of 10
g/L.
2.1.4- Bacterial cellulose gel (Satisfibre, Braga, Portugal). This material has the same
composition as BC paste, in gel form. Concentrations of 10, 20 and 50 g/L were tested.
2.2- Cell culture
Amphora sp. diatom cultures were obtained from the Culture Collection of Algae and Protozoa,
Scottish Marine Institute, Scotland, United Kingdom. Cultures usually contain bacteria, coming from environmental samples used to isolate diatom strains, whose concentration can be measured by flow cytometry. Orange Scientific 175 cm3 tissue culture flasks (sterile), stirred at 40 rpm on an orbital shaker (Sky Line shaker DOS-20L), were used to incubate all cultures.
37
Lighting was provided by two lamps (Philips Master t5 14W/840), timed 12h/12h light/dark periods by an electric timer (CYLLUX ELECTRIC). The cultures were kept inside a thermalized cabinet (T≅20°C) with air conditioner (Panasonic Inverter ECONAVI).
2.3- Culture medium
F2 medium (Guillard & Rhyther, 1962) was used. Natural seawater was collected during the high tide in the coordinates 41°29'06.6"N 8°46'51.5"W, filtered (0.2 µm pore size) and sterilized in an autoclave.
2.4-Cell density assessment
A calibration curve was made to measure cell density in the Spectrofluorimeter (HORIBA AQUALOG 800, Horiba ABX S.A.S. Portugal Branch, Amadora, Portugal) relating its readings with those of a EC800 Flow Cytometry Analyser (Sony Biotechnology Inc., Champaign, IL, USA). Spectrofluorimetry was used instead of flow cytometry in this experiment because cell carrier particles potentially damage the flow cytometer pipes. For this reason, cell concentration was calculated from the spectrofluorimetry readings, using a linear regression, previously devised, which related spectrofluorimetry and cytometry readings (R2=0.907). The full specter of a culture sample was first performed, being the highest peaks observed at 456 nm (excitation) and 681 nm (emission). These wavelengths were used throughout the assay. A control was used containing culture medium, each with the different concentrations of BC, to take in consideration its contribution to the emissivity of the samples. Cytometry and fluorimetry readings were used to assess culture growth over 8 days, until plateau phase was reached.
2.5- Culture preparation
Several sub-cultures were prepared, one week in advance, so that when the assay started, these were in exponential growth phase. Using cytometry readings, cell concentration was adjusted until readings were between 200 and 400 counts/µL.
2.6- Cytometry protocol
Cell concentration of Amphora sp. in cell cultures was determined by flow cytometry with an EC800 Flow Cytometry Analyser (Sony Biotechnology Inc., Champaign, IL, USA) equipped with an argon-blue laser (488 nm). Autofluorescence was used as a discriminating characteristic
38
to detect the diatom, and the signal was detected on channel FL3 (BP 665/30 nm). A flow rate of 40 µL/min, with a sample volume of 50 µL and a maximum of 15000 counts/sample were established as setting parameters for acquisition. The mean value ± standard deviation was obtained. Analysis of data was performed on the EC800 software version 1.3.6. (Sony Biotechnology Inc., Champaign, IL, USA). Diatom cultures form cell clumps, so it is necessary to disperse diatom aggregates, to prevent cytometry readings biasing. To do so, Eppendorf tube containing sample was vortexed (15 seconds), sonicated in ultrasonic bath (30 seconds), vortexed again and read immediately, to prevent cells from settling. This method was performed for each 0.6 mL sample (triplicates).
2.7- Fluorimetry protocol
The sample in an Eppendorf tube was vortexed and 0.45 mL were transferred to the fluorimetry cuvette. The same was done with triplicates. Then cuvette was inserted in the spectrofluorimeter and the reading was made. Between each reading the cuvette was moved up and down to re-suspend the cells, and inserted in the spectrofluorimeter to take another reading. Three readings were made for each sample and the average value was calculated. This method was carried on in triplicates.
2.8- Microscopic observations
Samples from preliminary tests with different materials (microcrystalline cellulose, fiber glass tatters, bacterial cellulose paste) were observed in epifluorescence microscopy (using an Olympus BX51 microscope) coupled with a DP71 digital camera and three sets of filters (DAPI – 360-370/420; FITC – 470-490/516; and TRITC – 530-550/590) (Olympus Portugal SA, Porto, Portugal). Samples containing microcrystalline cellulose were dyed blue with calcofluor. All images were acquired using the Olympus CellSens soſtware. Samples containing BC gel were observed using a Confocal Scanning Laser Microscope (Olympus BX61, Model FluoView 1000). Calcofluor was used for detection of cellulose fibers (laser excitation line 405nm and emissions filters BA 430–470); Syto9 was used for detection of bacteria (laser excitation line 488 nm and emissions filters BA 505–540 nm) and auto-fluorescence (laser excitation line 559 nm and emissions filters BA 575–675 nm) for Amphora sp. cells. Images were acquired with 1024 x 1024 resolutions using the program FV10-ASW 4.2.1.20 (Olympus). Selected images were presented either as single confocal optical sections or maximum intensity type constructions.