CUIDADO É FUNDAMENTAL
UNIVERSIDADE FEDERALDO ESTADODO RIODE JANEIRO. ESCOLADE ENFERMAGEM ALFREDO PINTO R E V I S T A O N L I N E D E P E S Q U I S A
RESEARCH
CUIDADO É FUNDAMENTAL
UNIVERSIDADE FEDERALDO ESTADODO RIODE JANEIRO. ESCOLADE ENFERMAGEM ALFREDO PINTO
DOI: 10.9789/2175-5361.2017.v9i1.92-98
DOI: 10.9789/2175-5361.2017.v9i1.92-98 | Dias GL; Sarturi F; Camponogara S; et al. | Analysis of the medical waste...
Análise da taxa de geração de resíduos de serviços de saúde
em um hospital universitário
Analysis of the medical waste production rate in a teaching hospital
Analisis de la tasa de produccion de residuos hospitalares en un
hospital universitario
Gisele Loise Dias1; Fernanda Sarturi2; Silviamar Camponogara3; Suzinara Beatriz Soares de Lima4; Luis Felipe Dias Lopes5; Clara Maria Trevisan6
How to quote this article:
Dias GL; Sarturi F; Camponogara S; et al. Analysis of the medical waste production rate in a teaching hospital. Rev Fund Care Online. 2017 jan/mar; 9(1):92-98. DOI: http://dx.doi.org/10.9789/2175-5361.2017.v9i1.92-98
ABSTRACT
Objective: To identify the medical waste production rates (kg.bed-1.day-1) for the waste groups A, B, D
(including recyclables) and E, and to verify seasonal influence in the generation of waste. Methods: Data were collected by weighing the waste, during seven consecutive days for four weeks, with each week corresponding to a season. Results: The waste production rate presented the following values in kg.bed-1.day-1 for each group:
A: 0.831, B: 0.088, D: 2,607, D-Recyclable: 0.525 and E: 0.102. Based on the analysis of variance (ANOVA) test, it was not found evidence that seasonality influences with the generation of the waste. Conclusion: Hospitals with similar numbers of beds have divergent values for the waste production rates, therefore it was not possible to use a reference rate for comparison with other hospitals. Finally, the ANOVA test did not found evidence that seasonality influences the generation of the waste.
Descriptors: Residue management, Medical waste, Teaching hospital.
1 Federal University of Santa Maria/Brazil; Nurse. Specialist Management of Public Health Organizations. Master’s Graduate Program
in Nursing at the Federal University of Santa Maria. Primary Contact for correspondence.
2 Federal University of Santa Maria/Brazil; Master in Nursing UFSM. Professor of the Federal University of Santa Maria (UFSM/RS),
crowded in the North Higher Education Center (CESNORS/RS) campus Palmeira Mission/RS.
3 Federal University of Santa Maria/Brazil, PhD in Nursing. Lecturer in the course of nursing and PPGEnf/UFSM. Federal University of
Santa Maria. Department of Nursing. Researcher of the Research Group Work, Health, Education and Nursing.
4 Universidade Federal de Santa Maria. Doctorate in Nursing Anna Nery Federal-University of Rio de Janeiro. Professor of the Federal
University of Santa Maria, in the nursing course and PPGEnf/UFSM.
5 Federal University of Santa Maria/Brazil, Professor, Department of Administrative Sciences and PPGA.
6 University Hospital of Santa Maria/Brazil, Nurse University Hospital of Santa Maria - HUSM/SHL. Member of the Environmental
RESUMO
Objetivo: Identificar as taxas de geração de resíduos do serviço de saúde (kg.bed-1.dia-1) para os grupos de resíduos A, B, D (incluindo os
recicláveis) e E verificar a influência da sazonalidade na geração de resíduos. Métodos: Os dados foram coletados através de pesagens desses resíduos, durante sete dias consecutivos, em quatro semanas, sendo que cada semana contemplou uma estação do ano. Resultados: A taxa de geração de resíduos apresentou os seguintes valores em kg.bed-1.dia-1 para
cada grupo: A: 0,831, B: 0,088, D: 2,607, D-Recicláveis: 0,525 e E: 0,102. Através do teste ANOVA nã5o foram encontradas evidências de que haja influência da sazonalidade na geração dos resíduos. Conclusão: Hospitais com número de beds semelhantes apresentam taxas de geração de resíduos diferentes, portanto não foi possível utilizar uma taxa de geração de referência para comparação com outros hospitais. Ainda, o teste ANOVA não indicou que a sazonalidade influencia a geração de resíduos.
Descritores: Gerenciamento de resíduos, resíduos de serviços de saúde, hospitais universitários.
RESUMEN
Objetivo: Identificar las tasas de generación de desechos en los Servicios de Salud (kg.lecho-1.día-1) para los grupos A, B, D (incluyendo materiales reciclables) y E, y comprobar la influencia de la estacionalidad en la generación de desechos. Método: Los datos fueron colectados mediante el pesaje de los desechos, durante siete días consecutivos durante cuatro semanas, con cada semana a corresponder a una temporada. Resultados: La tasa de generación de desechos presentan los siguientes valores en kg.lecho-1.día-1 para cada grupo: A: 0,831, B: 0,088, D: 2607, D-Reciclable:
0.525 y E: 0.102. Con base en el análisis de varianza (ANOVA), no fueron encontradas evidencias de influencia de la estacionalidad en la generación de los desechos. Conclusión: Los hospitales con un número similar de lechos tienen tasas de generación de desechos divergentes, por lo que no fue posible utilizar un valor de referencia para la comparación con otros hospitales. Finalmente, el ANOVA no encontró evidencia de que la estacionalidad influye en la generación de los residuos.
Descriptores: Administración de residuos, residuos hospitalares, hospital universitario.
INTRODUCTION
Health service waste (HSW) is defined as that which comes from health facilities.1 These establishments are
considered everywhere who provide services related to assistance to human or animal health.2
Considering the growth of the health sector3 one can see
that there is increasing production HSW worldwide4 causing
a problem for the generating facilities. The management of such waste should cover beyond regulatory compliance to purchase appropriate containers, programs to facilitate the adhesion of teams of workers to segregation in order to raise awareness of these professionals. Still encompass the treatment and disposal, taking into consideration the composition and generation of each type of waste.
The HSW generation may be influenced by factors such as type of health facility, hospital specialization, waste segregation options available, seasonal variation, number of hospital beds and the proportion of patients treated daily.5
In addition, factors such as number of employees, including students from different areas and residents, economic, social and cultural status of the patients and the general condition of the area where the hospitals are located, can also influence this generation.6
In general, the higher the demand met by the stores, the greater the generation of HSW, which makes these residues management more complex, since improperly managed, may cause environmental contamination, accidents, disease spreading to the general population, by direct or indirect contact with vectors, and also contribute to the increase in hospital infections.7-8
In Brazil, in order to regulate the actions related to the HSW management, the National Health Surveillance Agency (ANVISA) published in 2004 the Collegiate Board Resolution (RDC) nº 306,2 which establishes guidelines
for the management of these waste as well as its rating group. Later, in 2005 the National Environmental Council (CONAMA) published Resolution 358, which addresses the treatment and final disposal of HSW.9
The proposed classification in Brazil is as follows: Group A (infectious waste, is subdivided into A1, A2, A3, A4 and A5, as the characteristics of the waste), group B (chemical residues), C (radioactive waste), group D (common waste, including in this group are considered recyclable waste), and group E (sharps waste) (BRAZIL, 2004, CONAMA, 2005).2-9
Among the guidelines set out in the DRC No. 306, it is the main one that provides for the development of the Waste Management Plan for Health Service (WMPHS) by health establishments (BRAZIL, 2004).2 The WMPHS is a document
that all HSW generator should prepare, which serves as for institutional intra HSW management and it must be described in detail, all actions relating to the HSW management.
The main actions that should be described in WMPHS refer to the management of such waste and includes the following steps: segregation, packaging, identification, internal transport, treatment, external storage, external collection and transportation, and d end isposição (BRAZIL, 2004).2 This resolution also outlines a series of guidelines for
the safety of workers that handle HSW.2
After the implementation of WMPHS, it is necessary that the generating establishments seek to develop indicators to serve as a pair valuation basis to WMPHS2 Among these
indicators RDC 306 calls:. Accident rate with sharp waste, variation of waste production ; varying the proportion of all groups of residues, including the variation of the percentage of recycling.2 Thus, knowing the hospital indicators related to
HSW allows to evaluate the efficiency of WMPHS, facilitating the work process of managers in this sector. In Brazil, there is still lack of such information and, therefore, this study will also contribute to building knowledge on the subject.
In this context, the objective of this study is to identify the waste production rates per group, and assess the influence of seasonality on the generation of HSW of a university hospital in the interior of Rio Grande do Sul State, based on
the following assumptions: null hypothesis (H0), there is no influence of seasonality in waste production and alternative hypothesis (H1), there is influence of seasonality in waste production.
METHOD
This study is part of an umbrella project that identified the rate of waste production by inpatient units at a university hospital. Thus, the cut for this article discusses generation rates kg.bed-1.day -1 per group of waste and analysis of variance
(ANOVA) to assess the effect of seasonality. With the use of ANOVA was possible to verify whether the average days of the week showed a significant difference in the seasons of the year.
This study was conducted according to the guidelines of the National Ethics Committee10 for both is recorded in
the Research Ethics Committee of the institution, with the presentation of Certificate for Ethics Assessment (CAEE) number 17942013.5.0000.5346 and assent number 334.97.
The hospital studied is located in the central region of Rio Grande do Sul state, has 307 beds and 2,471 employees. Its infrastructure includes a large number of medical specialties. Being this hospital considered high complexity and macro-regional reference for cancer treatment. The services offered by the same range from outpatient to units of intensive therapy, including diagnostic services by image and also service emergency department, renal unit and psychiatric sector, operating room, obstetrical, and bone marrow transplantation, among others.
The data collection instrument was proposed by the Pan -American Health.11 The same was filled every day of
collection, and covered the point of waste production, waste types, weight, date and responsible for the collection, type balance, among other information. The collection was carried out in four stages, during seven consecutive days, as recommended in the instrument.11
To check the possible influence of seasonality in the generation of HSW, the collection steps occurred in different seasons respectively in September and December 2013, to contemplate the winter and spring, and later in February and May 2014, to consider the summer and fall seasons.
The gathering took place in the external temporary storage warehouse of the hospital researched where is the balance of the institution. All waste generated were separated and weighed by groups, with the exception of residues of Group C. Since, according to the current legislation, waste of this group, after the decay of radioactivity, are classified within the remaining groups and treated accordingly. Furthermore, the study site’s WMPHS covers the segregation of Group D residues: D and D common -recyclables therefor weighing this group contemplated these two variables of the Group D, as these residues had already received the segregated external temporary storage tank.
When collection was finalized, data was entered into an electronic spreadsheet of Microsoft Excel® program. Data analysis was performed using the statistical software BioEstat 5.0.12 Data analysis took place by means of
descriptive statistics, in two distinct stages. At first, it calculated the average rate of kg. bed generation-1.day-1 by
average daily generation of HSW (in kg.day-1) for each waste
group by dividing the number of beds studied hospital. And in the second time to see if there was influence of seasonality in the generation of HSW, we used analysis of variance (ANOVA).
RESULTS
Next will be presented the percentage composition of the HSW group, the generation rate kg.bed-1.day-1 waste as
the waste groups and subsequently an analysis of variance (ANOVA) for each waste group. Below is the percentage composition of the HSW group, Figure 1.
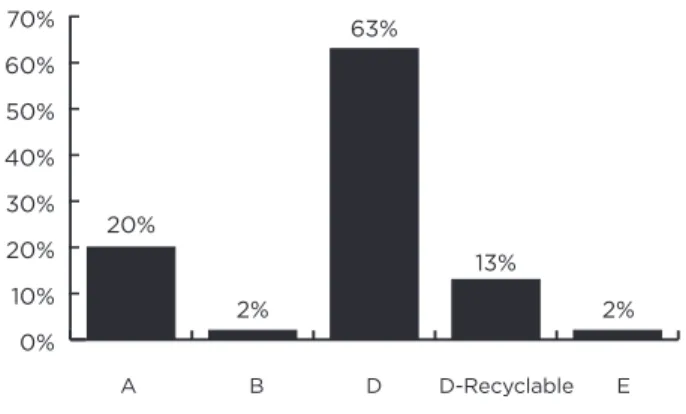
Figure 1 - Percentage Breakdown of HSW per group
0% 10% 20% 30% 40% 50% 60% 70% 20% 2% 63% 13% 2%
As stated above it appears that the HSW percentage composition is divided as follows: Group A: 20%, Group B: 2%, Group D 63% D-Recyclable group: 13%, and group E: 2%. Table 1 shows the daily totals generated by groups of waste and bed.
Table 1 - Total daily generated waste groups and per bed,
Santa Maria, 2014
Group A B D RecyclableD- E
Kg.Bed-1Day-1 0.831 0.088 2,607 0.525 0.102
As noted in Table 1 the generation rate kg.bed-1.day-1for
group A showed the waste value 0.831 kg.bed-1.day-1. For
waste production in Group B, the value found was 0.088 kg.bed-1.day-1.Regarding the generation of Group D waste,
the value of the generation rate showed the value of 2,607 kg.bed-1.day-1
,
and waste production rate showed the valueof the Group D Recyclable 0.525 kg.bed-1.day-1
.
Finally, the A B D D-Recyclable Erate of waste production from Group E had the value of 0.102 kg.bed-1.day-1. The following is the verification of the
influence of seasonality in waste production rate: analysis of variance (ANOVA). In Table 2 are the variance analysis for waste production from Groups A, B, D common, recyclable D and E.
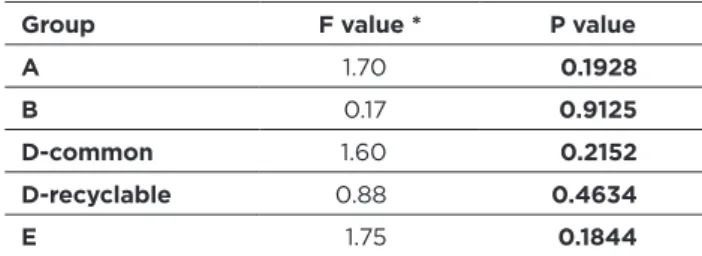
Table 2 - Analysis of variance (ANOVA) for HSW groups A, B,
common D, D-Recyclable and E. Santa Maria, in 2014
Group F value * P value A 1.70 0.1928 B 0.17 0.9125 D-common 1.60 0.2152 D-recyclable 0.88 0.4634 E 1.75 0.1844
* Fisher’s F test for ANOVA.
According to Table 2, it is found that P values are larger than a significance level α (α = 5%) adopted for this search. Thus, it is concluded that seasonality does not interfere with waste production from Group A, B, D commonplace, D-Recyclable and E.
DISCUSSION
Percentual Composition of HSW Groups
It is estimated that the total waste generated in health care facilities, 20% correspond to infectious waste that is7-13. In addition, there is a need to make distinction between
the residues of Groups A and E. Thus7 when considering
only the residue of the Group a, the value found in this study corresponds to reality reported by the authors, as figure 1.
It can be seen in figure 1, the percentage composition of the residues identified from the collected data from this study is divided as follows: 20% of the total waste generated corresponding to the Group A. Since the waste 2% of the total generated refer to Group B. Although residues, the value was 63% for Group D-generation waste and 13% for Group D and 2% Recyclable waste to the Group E.
In a study on the health service waste management system in Cameroon and found the following values for the total waste generated in a hospital with 300 beds: Group A: 16%, Group B: 21%, Group D: 49% and Group E: 14%,14
while for this study was 2%.
It is estimated that 85% of the total waste generated in health facilities are compatible with household waste ie Group D. And yet, 10% of the total waste generated is considered infectious, and the remaining 5% are divided between chemical and radioactive (WHO, 2014).1
Generation rate per waste group
The following discussion will include the waste production rate in countries that have made studies similar to this, to carry out a next discussion of the hospital context studied, the studies referenced herein have 290-350 beds and some are characterized by the authors as university hospitals.
As shown in Table 1 the values for the rates of generation of waste per group.
In a study that examined the group’s waste production in the region of Vacacaí Mirim, Rio Grande do Sul, it included 21 hospitals15, and one that resembles due to size with this
work through the data provided by the authors is possible to estimate generation rate kg.bed-1.day-1 presenting the value
of 0.675 kg.bed-1.day-1, this value is lower than that found in
this study.
In 2010, Brazil was carried out a survey that analyzed waste production in 18 hospitals in Fortaleza (CE)13, at
one of these hospitals the number of beds very close to this study, 306 beds. Thus, the authors found the rate of 0.90 kkg.bed-1.day-1.13, similar to the value identified
in this research.
In Pakistan, a study analyzed Group A waste production in six hospitals,16 these four fall into this research, one with
300 beds and the other three (3) with 350 beds. It appears from this study that the authors found little variation between the number of beds and the generation rate kg.bed-1.day-1
between hospitals. The generation rate found by the authors to the hospital of 300 beds was 0.305 kg.bed-1.day-1.16 below
the found here. The other hospitals studied in Pakistan reached the values of 0.301, 0.302 and 0.312 kg.bed-1.day-1.16
these values are also lower than found in this study, even in the case of hospitals with more beds.
In Iran, nine hospitals were studied17 from these two
(2) of them have similar characteristics to those checked here because they are Teaching Hospitals, and present 300 beds each. The values for each hospital were 1.80 and 1.81 kg.bed-1.day-1.17
In Tanzania, waste production was compared in two hospitals, one with 290 beds reached the rate of waste production for the group The 3,734 kg.bed-1.day-1.18
Regarding waste production in Group B, the study in Tanzania showed the value of 0.300 kg.bed-1.day-1,18 higher
than that found in this study, as shown in Table 1.
About the generation of common group D waste, the study in Fortaleza (CE)13 also analyzed the rate for waste
from common group D, being checked 2.61 kg.bed-1.day-1.13,
value close to that found in this study, as shown in Table 1. Iran in the generation of non-infectious waste, or Group D was also calculated17 for each 300 hospital beds
waste production rate was 1.51 kg.bed-1.day-1 and 2.50
kg.bed-1.day-1.17 is observed that there was a variation of
almost a kilo of one hospital to another.
The value found in this study can be considered high in relation to work carried out in Iran17 Since for the present
study, the Group D waste were separated from recyclable. In Tanzania, the value found was 2.5484 kg.bed-1.day-1.18
to the value Group D waste production also similar to that found by us.
The rate of recyclable D Group waste production kg.bed-1.day-1 was not found in the literature, yet, considering
that the segregation of waste is the starting point for the waste management, was presented to Table 1.
Given that, when using recycling as waste management process, the hospital manager ensures that occurs decrease in consumption of raw materials to generate new products and reduce the amount of waste going to landfill, which consequently, extends the life of the same.19
The importance of identifying this rate is that these residues are a source of income for some families that use this material is/objects as a source of income, since recycling provides social and productive inclusion of collectors and the participation of society.20
In this sense, we can contribute to better segregation of such waste in order to promote the quality and the appropriate amount of recyclable is the social issues are the environmental issues.
Waste production in Group E in Iran was held in two hospitals and found values were 0.02 and 0.03 kg.bed-1.day-1.17 Already Tanzania, the figure was
1,071 in kg.bed-1.day-1,18 while the value in this study
was 0.102 kg.bed-1.day-1.
Checking the influence of seasonality in the
rate of waste production analysis of variance
(ANOVA)
In analyzing the four seasons we were considered the year: spring, summer, autumn and winter. The significance level was 0.05 (α = 5%). Table 2 presents the analysis of variance (ANOVA) for waste HSW group A, B, D - common, D-Recyclable and E.
ANOVA Analysis of the variance showed no significant difference for the generation of all HSW groups studied. This was due to that the value of α was found in the analysis, greater than the value adopted for this study. Ssa way of confirming the null hypothesis (H0), or that there is no significant difference in the generation of wastes by the HSW group seasons. Thus it is concluded that there was no influence of seasonality in HSW generation.
The influence of seasonality in generating res íduos was reported in Brazil in 2003,21 in this study the authors
identified differences in waste production according to the seasons. In contrast, the results of Anterio study, another study22 pooled data from its research into two groups:
summer and autumn, and winter and spring. Although this study has been an smaller hospital than the present work, the results are similar, since waste production has a pattern generation throughout the seasons of the year. Still, a survey was conducted on the HSW management in three (3) 24
hours service units, and found that there was no seasonal variation in HSW generation.23
HSW management in was studied in a municipal hospital in Mato Grosso do Sul, the smaller the scene of this investigation also found no significant differences for waste production during the seasons, the author concluded in their study that seasonality does not interfere the generation of HSW.24
Similarly, in a study of the generation of HSW according to the seasons in a large hospital in São Paulo, and found that waste production is not influenced by seasonality.25
CONCLUSION
The results indicate that the generation of residues in group A were similar to values found in Brazil. However, for this group the values were different from those found in the international literature for hospitals with number of similar beds. On the generation of waste in Group B, it was observed that the amount was lower than that found in the literature. The generation of the Group D residues showed similarities entres studies, however, the rate of generation of waste in this study can be considered high, since recyclable waste segregated from the group waste D. Further, the generation rate of residues of D-Recyclable group was presented and there were no references in the literature. Finally, the rate of Group E of waste production showed the greatest differences, both in literature and in relation to the value found in this work. This way for future work is suggested to investigate other factors that influence the generation of waste.
Regarding the influence of seasonality, this study found that between the seasons there was no statistically significant difference in the generation of waste. The p value found by ANOVA in all seasons of the year was higher than 5%. Thus, we accept the null hypothesis (H0) formulated for analysis and concluded that there is no interference of seasonality in waste production.
Finally, it is noted that this type of study allows managers and academic community know the reality in the generation of HSW and rethink waste management. It is true that the Brazilian reality still need more studies like this, in order to meet the generation of waste in Brazil. Since 2004, in Brazil, establishments are required by law to determine these rates, but little has access to the same. As we conclude this study, similar number of beds in hospitals present generation rate of different wastes so you cannot use a reference rate for generation compared to other hospitals. Thus it is suggested that hospital managers should perform the quantification considering the specificities of each hospital.
Yet the vast majority of studies focus on the generation of wastes from Group A, disregarding the other types of waste, such as the Group B, D and D-Recyclable. These residues are also part of WMPHS and determine generation rates of these is an important health service contribution
in health management, for proper planning from the permanent health education in order to raise awareness among health workers as for the generation/segregation of waste; encouraging families that make of these materials/ objects their source of income and mitigate environmental impacts and damage to public health.
REFERENCES
1. Who. Safe management of wastes from healthcare activities. Y.Chartier et al 2ª ed, Malta, 2014. Available at: http://www.who.int/ iris/bitstream/10665/85349/1/9789241548564_eng.pdf?ua=1. 2. Brasil, Agência Nacional de Vigilância Sanitária. Resolução da
Diretoria Colegiada n°306, de 7 de dezembro de 2004. Dispõe sobre o Regulamento Técnico para o gerenciamento de resíduos de serviços de saúde. Diário Oficial [da] República Federativa do Brasil, Brasília, DF, 10 dez. 2004. Seção 1, p. 49.
3. BOTELHO, A. The impact of education and training on compliance behavior and waste production in European private healthcare facilities. Journal of Environmental Management . v. 98,p. 5-10, may, 2012 .Available at http://www.sciencedirect.com/science/article/pii/ S0301479711004282 .
4. Oroei M, Momeni M, Palenik CJ, Danaei M, Askarian M. A qualitative study of the causes of improper segregation of infectious waste at Nemazee Hospital, Shiraz, Iran. Journal of Infection and Public Health.v. 7, Issue 3, May–June 2014, p. 192-198. Available at http://www.sciencedirect.com/science/article/pii/ S1876034114000185.
5. Debere MK, Gelaye KA, Alamd, AG, Trifa, ZM. Assessment of the health care waste production rates and its management system in hospitals of Addis Ababa, Ethiopia, 2011. Bio Medical Central Public Health 2013, 13:28. Available at http://www.biomedcentral.com/ content/pdf/1471-2458-13-28.pdf.
6. Dasimah O, Siti NN, Subramaniam A/LK. Clinical Waste Management in District Hospitals of Tumpat, Batu Pahat and Taiping, Procedia - Social and Behavioral Sciences, v.68, p.134145. dec., 2012. Available at http://www.sciencedirect.com/science/article/ pii/S1877042812056960.
7. Dutra LMA, Monteiro PS. Gerenciamento de resíduos sólidos em um hospital de ensino em Brasília. Comunicação em Ciências da Saúde, v. 22, n. 4 p.305-314. abr/jun., 2011. Available at htp:// dominioprovisorio.tempsite.ws/pesquisa/.
8. Nunes TSP, Gutemberg ACB, Armando CB et al. Gerenciamento de resíduos de serviços de saúde: uma revisão de literatura. R. pesq.: cuid. fundam. online 2012. jan/mar. (Ed. Supl.):57-60
9. Conselho Nacional do Meio Ambiente. Resolução nº 358, de 29 de abril de 2005. Dispõe sobre o tratamento e disposição final dos resíduos de serviço de saúde e dá outras providências. Diário Oficial [da] República Federativa do Brasil, Brasília, DF, 04 mai. 2005, Seção 1, p. 63-65.
10. Brasil. Ministério da Saúde. Conselho Nacional de Saúde. Resolução 466/2012 - Normas para pesquisa envolvendo seres humanos. Brasília, DF, 2012.
11. Organização pan- americana da saúde. Guia para manejo de resíduos em estabelecimentos de saúde. Brasília: 1997.
12. Ayres M, Ayres Júnior M, Ayres DL, Santos, AS dos. BioEstat 5.0: aplicações estatísticas nas áreas das ciências biológicas e médicas. Belém: MCT; IDSM; CNPq, 2007. 364 p. il. Acompanha CD-ROM. 13. Lemos KIL, Da silva MGC, Pinto FJM. Produção de resíduos em
hospitais públicos e Filantrópicos No Município De Fortaleza (CE). Revista Baiana De Saúde Pública, v. 34, n. 2, p. 321-332 abr./jun., 2010. Available at http://inseer.ibict.br/rbsp/index.php/rbsp/article/ view/38.
14. Manga VE, Forton OT, Mofor LA.; Woodard R. Health care waste management in Cameroon: A case study from the Southwestern Region. Resources, Conservation and Recycling, v. 57, p. 108–116. dec., 2011. Available at http://www.sciencedirect.com/ science/article/pii/S0921344911002035.
15. SILVA, CE da; HOPPE, AE. Diagnóstico dos resíduos de serviços de saúde no interior do Rio Grande do Sul. Eng. Sanit. Ambient., R. Rio de Janeiro Apr./June 2005. Available at http://www.scielo.br/scielo.ph p?pid=S141341522005000200008&script=sci_arttext.
16. Habibullah J, Ahmad K, Khan MA. Managing the healthcare solid waste in selected Districts of Punjab, Pakistan. Pakistan Journal of Medical Sciences, v. 26, n.4, p. 795-799, oct/dec., 2011. Available at http://www.pjms.com.pk/issues/octdec2010/abstract/article10.html. 17. Lakbala P, Mahesh TM. Bio-medical waste management in Shiraz city of Iran. Institute of Town Planners, India Journal, v. 8, Issue 1, p. 156 - 164, jan./mar., 2011. Available at: http://itpi.org.in/pdfs/ jan5_11.pdf.
18. Kagonji IS, Manyele, SV. Analysis of the measured medical waste production rate in Tanzanian district hospitals using statistical methods. African Journal of Environmental Science and Technology, v. 5, Issue 10, p. 815-833, oct., 2011. Available at http://www. academicjournals.org/AJEST.
19.Cruz NF da, Simões P, Marques RC. Economic cost recovery in the recycling of packaging waste: the case of Portugal. Journal of Cleaner Production, v. 37, p. 8-18, Dec. 2012.
20.Jacobi PR, Besen GR. Gestão de resíduos sólidos em São Paulo: desafios da sustentabilidade. Estudos Avançados. São Paulo, v. 25, n. 71, Abr. 2011.
21. Schneider VE, De luca SJ, Bettin F. Influência da sazonalidade na geração de resíduos sólidos de serviços de saúde (HSWS). In: AIDIS; Associação Brasileira de Engenharia Sanitária e Ambiental. Saneamento Ambiental: Ética e Responsabilidade Social. 2003, Joenville. ABES, p.1-13, set. Anais Eletrônicos. Joenville, 2003. Available at http://www.bvsde.paho.org/bvsacd/abes22/dcoix.pdf. Access on 10 de mai. 2014.
22. Oliveira, AR de. A variação temporal da produção de resíduos sólidos nos serviços de saúde do hospital São João Batista de Criciúma-SC, em função das estações do ano. 2005. 91 f. Dissertação (Mestrado em Ciências Ambientais)-Universidade do Extremo Sul Catarinense, Criciúma, 2005.
23. ORTIGOSSA, A. G. Influência da sazonalidade na geração de Resíduos Sólidos de Serviços de Saúde produzidos nas unidades de saúde 24 horas de Criciúma/SC. 2007.53f. Dissertação (Mestrado em Ciências Ambientais)-Universidade do Extremo Sul Catarinense, Criciúma, 2007.
24. VIEIRA, L.B. Diagnóstico e propostas para gerenciamento os resíduos sólidos de serviços de saúde do Hospital Municipal de Ivinhema-Ms. 2009. 163 f. Dissertação (Mestrado em Tecnologias Ambientais) Universidade Federal de Mato Grosso do Sul, Campo Grande, 2009.
25. CREMON, BM; RAIMUNDO, MG ; VIANA, E. Análise da produção de resíduos de serviço de saúde (HSW) em função das estações do ano para um hospital de grande porte de São Paulo/SP. Revista Conexão Academia, v. II, p. 29-37-37, 2013.
Received on: 05/04/2015 Reviews required: 31/05/2016 Approved on: 15/06/2016 Published on: 08/01/2017 _________
Author responsible for correspondence:
Gisele Loise Dias Av. Rodolfo Berh, 1005, Apt. 105 Bairro Camobi, Santa Maria/RS ZIP-code: 97105440 E-mail: gidias18@gmail.com