The archaebacterial origin of eukaryotes
Cymon J. Coxa,1, Peter G. Fostera,1, Robert P. Hirtb, Simon R. Harrisb, and T. Martin Embleyb,1aDepartment of Zoology, Natural History Museum, Cromwell Road, London, SW7 5BD, United Kingdom; andbInstitute for Cell and Molecular Biosciences, Newcastle University, Newcastle, NE2 4HH, United Kingdom
Communicated by Jeffrey D. Palmer, Indiana University, Bloomington, IN, October 24, 2008 (received for review April 16, 2008) The origin of the eukaryotic genetic apparatus is thought to be
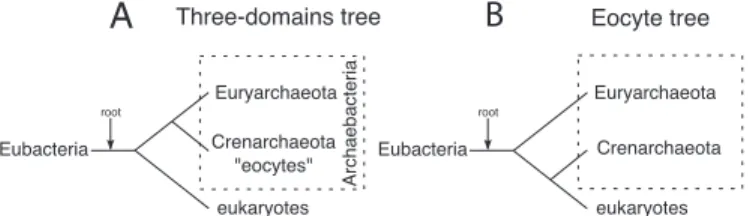
central to understanding the evolution of the eukaryotic cell. Disagreement about the source of the relevant genes has spawned competing hypotheses for the origins of the eukaryote nuclear lineage. The iconic rooted 3-domains tree of life shows eukaryotes and archaebacteria as separate groups that share a common ancestor to the exclusion of eubacteria. By contrast, the eocyte hypothesis has eukaryotes originating within the archaebacteria and sharing a common ancestor with a particular group called the
Crenarchaeota or eocytes. Here, we have investigated the relative
support for each hypothesis from analysis of 53 genes spanning the 3 domains, including essential components of the eukaryotic nu-cleic acid replication, transcription, and translation apparatus. As an important component of our analysis, we investigated the fit between model and data with respect to composition. Composi-tional heterogeneity is a pervasive problem for reconstruction of ancient relationships, which, if ignored, can produce an incorrect tree with strong support. To mitigate its effects, we used phylo-genetic models that allow for changing nucleotide or amino acid compositions over the tree and data. Our analyses favor a topology that supports the eocyte hypothesis rather than archaebacterial monophyly and the 3-domains tree of life.
archaebacteria兩 evolution 兩 eocyte 兩 nucleus 兩 phylogenetics
T
he rooted universal 3-domains tree of Life (Fig. 1A) based on small subunit (SSU) ribosomal (r)RNA sequences, shows eukaryotes and archaebacteria as monophyletic groups that share a common ancestor to the exclusion of eubacteria (1). The 3-domains tree has also been recovered by analyses of other core components of the eukaryotic transcription and translation machinery, suggesting that the tree provides an insight into the origin of the eukaryotic nuclear lineage itself (2–4). By contrast, some analyses of the paralogous protein translation elongation factors, used to root the 3-domains tree, do not actually recover the 3 domains (5, 6). Instead, they show a tree where the eukaryotic proteins branch as the sister group of a specific group of archaebacteria called the Crenarchaeota or the eocytes. The ‘‘eocyte hypothesis,’’ whereby the eukaryotic nuclear lineage is posited to have arisen from within a paraphyletic archaebacteria (Fig. 1B), was first proposed based on structural features of eukaryotic and archaebacterial ribosomes (7). It received further support from some early analyses of SSU rRNA sequences (8–10) and from the identification of an 11-aa insertion in the GTPase domain of the elongation factor 1␣ (EF-1␣, also called EF-Tu) genes of eocytes and eukaryotes (5, 6, 11). Subsequently, the eocyte hypothesis has been neglected in the literature in favor of the 3-domains tree, although published phylogenetic analyses are actually more equivocal (12). Thus, there are many examples where one analysis of a eukaryotic gene or protein has recovered the 3-domains tree, but a different analysis of the same molecule(s) has recovered the eocyte tree (1, 8–10, 13–17).Despite large variations in nucleotide and amino acid fre-quencies observed among species (9, 18), most of the methods of phylogenetic analysis previously used to investigate the origin of the eukaryotic genetic machinery have assumed that the substitution process is time homogeneous and stationary. In other words, they assume that substitutions follow the same
pattern in different lineages, and that base or amino acid frequencies do not change over time. Failure to adequately account for patterns of heterogeneous composition among se-quences can lead to incorrect trees when two lineages have independently converged to similar compositions (18), and these effects are likely to be more problematic when highly divergent organisms are compared. Here, we have used two recently developed phylogenetic models that account for complementary aspects of heterogeneous compositions to evaluate the sup-port for competing hypotheses for the ancient origin of archae-bacterial-like genes in eukaryotic genomes (1, 8). The node-discrete composition heterogeneity (NDCH) model (18) allows composition to change in different lineages over time, whereas the CAT mixture model (19, 20) accommodates among-site compositional heterogeneity using multiple substitution classes, each with its own composition profile. An important, but often neglected, step in phylogenetic analysis is a test of whether the model adequately fits the data being analyzed. In the NDCH analyses, we used Bayesian posterior predictive simulations (21) to determine the number of composition vectors needed to adequately model the data. By using a reversible-jump Markov Chain Monte Carlo (MCMC), the CAT model estimates the necessary number of substitution classes required as part of the analysis.
Results and Discussion
Analysis of Large-Subunit (LSU) and Small-Subunit (SSU) rRNA Se-quences. Much of the disagreement over the origin of the eukaryotic nuclear lineage has been based on conflicting results
Author contributions: P.G.F. and T.M.E. designed research; C.J.C. performed research; P.G.F. contributed new reagents/analytic tools; C.J.C., P.G.F., R.P.H., S.R.H., and T.M.E. analyzed data; and C.J.C. and T.M.E. wrote the paper.
The authors declare no conflict of interest. See Commentary on page 20049.
1To whom correspondence may be addressed. E-mail: [email protected], [email protected], or [email protected].
This article contains supporting information online atwww.pnas.org/cgi/content/full/ 0810647105/DCSupplemental.
© 2008 by The National Academy of Sciences of the USA
A
B
Fig. 1. The 3-domains and eocyte trees. (A) The rooted 3-domains tree (1) posits that the archaebacteria, consisting of 2 kingdoms Euryarchaeota and Crenarchaeota (eocytes), are monophyletic and more closely related to the eukaryotes than to eubacteria. (B) An alternative hypothesis, the eocyte tree, posits that the archaebacteria are paraphyletic, with the eocytes (Crenarcha-eota) alone most closely related to the eukaryotes (7, 11). In both hypotheses the root was placed on the eubacterial branch in accord with the results of published reciprocal rooting studies using ancient paralogous proteins (e.g., refs. 5, 6).
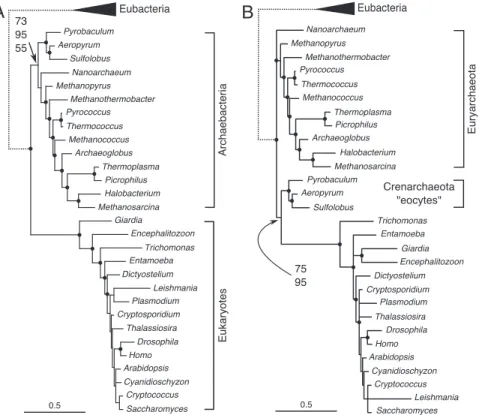
from phylogenetic analyses of rRNA sequences (1, 8, 9, 14). Here, we have analyzed rRNA data for 40 taxa spanning the 3 domains (Table S1 inSI Appendix). Analyses of combined LSU and SSU rRNA sequences using maximum parsimony or a composition homogeneous [general time-reversible (GTR)] model, implemented in either a Bayesian or maximum-likelihood (ML) framework, recovered archaebacteria and eu-karyotes as separate groups (Fig. 2A). These results are consis-tent with the 3-domains theory of life. However, in violation of the assumptions of these methods, both datasets are markedly heterogeneous for their nucleotide compositions; G⫹C content varies from 45% to 74% for variable positions in these sequences. Posterior predictive simulations of composition homogeneity revealed that SSU and LSU rRNA each required 2 composition vectors (CV) to model the data adequately using the NDCH model (Fig. 3A). When this was done, a topology consistent with the eocyte hypothesis was recovered (Fig. 2B). The CAT model analysis also supported the eocyte hypothesis (Fig. 2B). That the heterogeneous composition NCDH and CAT models provide a better fit to the data than the composition homogeneous model is indicated by comparison of Bayes factors (Fig. 3B) (22, 23).
Compositional Heterogeneity Is a Common Feature of Molecular Data.
Although analyses of rRNA sequences that account for compo-sitional heterogeneity favored a topology consistent with the eocyte hypothesis rather than the 3-domains tree, only the CAT model analysis was decisive, using the conventional 95%
statis-tical significance criterion. To bring more data to bear on the question, we analyzed 51 proteins conserved across all 3 do-mains, including ribosomal proteins, elongation factors, and polymerases involved in nucleic acid replication, transcription, and translation (Table S2 inSI Appendix). Of the 51 proteins, 39 were identified as having heterogeneous compositions among lineages (2–9 CV required to fit; Table S2 and Figs. S1–S51 in
SI Appendix), confirming that compositional heterogeneity is a pervasive feature of these data. Only one tree, for the largest subunit of eukaryotic RNA polymerase I, recovered archaebac-terial monophyly at the 95% level. The largest subunit of eukaryotic RNA polymerase III recovered archaebacterial monophyly more weakly [67% posterior probability (PP)], but the trees from the other 4 subunits of eukaryotic RNA poly-merases I, II, or III did not recover a monophyletic archaebac-teria. The other 35 trees depicted eukaryotes derived from within a poorly resolved paraphyletic archaebacteria; 8 of these trees depicted the eocytes as the closest relatives of eukaryotes but not at the 95% level. In the remaining 14 trees, archaebac-teria formed a polytomy with the eukaryote cluster. Thus, very few of the individual protein trees resolved the relationship between eukaryotes and archaebacteria. Part of the reason for the lack of resolution in these analyses is the short length of most alignments (average length, 160 sites; range, 60–432 sites) when positions of dubious positional homology between domains were removed. Yutin et al. (24) also recently reported that individual proteins contained insufficient information to resolve the order
A
B
Fig. 2. Phylogenetic analysis of combined LSU and SSU rRNA. Scale bars indicate number of substitutions per site. The dotted branches leading to eubacteria are arbitrary lengths. (A) Consensus tree of 16,000 trees obtained from the posterior distribution of an MCMC analysis with homogeneous composition across the tree ([GTR⫹⌫]x2) loge(Lm)⫽ ⫺23,960.00. Nodes highlighted with dots were supported by ⱖ95% PP. The 3 values indicate support for a monophyletic archaebacteria from homogeneous composition MCMC (73% PP, Fig. S52 inSI Appendix), equally weighted maximum parsimony (95% BS, Fig. S53 inSI Appendix) and ML (55% BS, SI Text and Fig. S54 inSI Appendix). (B) Consensus tree of 10,000 trees obtained from the posterior distribution of an MCMC analyses with heterogeneous composition across the tree (NDCH model: [GTR⫹⌫⫹2CV]x2, loge(Lm)⫽ ⫺23,507.36). The posterior predictive simulations of X2for the NCDH model were: SSU: original statistic⫽ 468.06, P⫽ 0.3810 (range of simulated stat under the model ⫽ 186.57–1,014.93, mean ⫽ 449.61), LSU: original statistic ⫽ 759.69, P ⫽ 0.7515 (range of simulated statistic under the model⫽ 475.46–1,589.75, mean ⫽ 845.98). By contrast, posterior predictive simulations of X2for the homogeneous model were; SSU: range⫽ 29.55–210.79, mean⫽ 70.49, and LSU: range ⫽ 27.03–151.45, mean ⫽ 63.13. Nodes highlighted with dots were supported by ⬎95% PP. The 2 values indicating support for the eocyte tree are posterior probabilities for the NDCH analyses as described (75% PP, Fig. S55 inSI Appendix), and for an MCMC analysis with the CAT model (95% PP,⫹⌫, Fig. S56 inSI Appendix).
EVOLUTION
SEE
of relationships among archaebacteria and eukaryotes but sug-gested there was a trend in their analyses favoring the 3-domains tree. It should be noted, however, that Yutin et al. (24) used only composition homogeneous models within their study, and they did not attempt concatenated protein analyses.
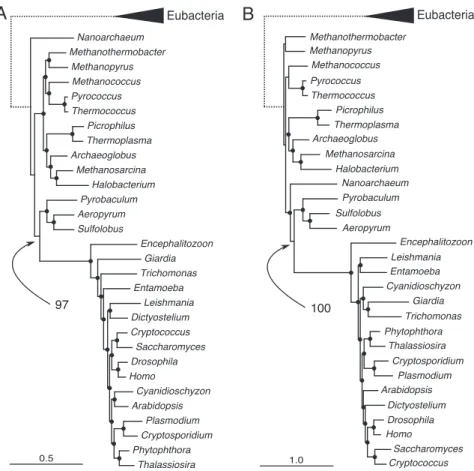
Phylogenetic Analyses of Concatenated Protein Sequences. To in-crease the number of characters analyzed, we concatenated 45 proteins (Table S2 inSI Appendix), after eliminating multiple alignments containing paralogous genes; for example, we re-moved the paralogous largest subunits of eukaryotic RNA polymerases II and III to make a combined protein dataset containing 5,521 amino acids. The 3-domains tree was recovered by maximum parsimony analyses of this dataset (Fig. S57 in
SI Appendix), but the eocyte tree was preferred by a composition homogeneous model in both an ML [99% bootstrap support (BS)] and Bayesian (100% PP) framework (Figs. S58 and S59 in
SI Appendix).
To reduce the observed compositional heterogeneity in the combined protein dataset, we recoded each amino acid accord-ing to the 6 ‘‘Dayhoff groups’’ of chemically related amino acids that commonly replace one another (25). This recoding is related to transversion analysis of DNA sequences and, like other ‘‘reduced alphabet’’ methods, can improve topological estima-tion when data show substituestima-tion saturaestima-tion or composiestima-tional heterogeneity (26). Recoding had an additional advantage of allowing us to estimate a GTR rate matrix specific to these data (4,248 characters). We carried out NDCH analyses on both the standard amino acid and Dayhoff-recoded data, progressively adding composition vectors to improve the fit of the model to the data. We added up to 26 composition vectors (standard amino acid data; Fig. S60 in SI Appendix) or 14 composition vectors (Dayhoff-recoded data; Fig. 4A) and obtained a markedly better fit of the model to the data compared with homogeneous analyses as measured by posterior predictive simulations and Bayes factors, although in neither case were we able to fit the model to the data at the 95% confidence level. The NDCH
analysis recovered the eocyte topology (ⱖ95% PP) with both datasets, irrespective of the number of composition vectors added. The CAT model on standard amino acid data recovered the eocyte topology (Fig. 4B) with maximum (100% PP) support. In the analyses of the Dayhoff-recoded data using CAT,
Nano-archaeum equitans branched (94% PP) at the base of the eocytes,
and together they clustered with the eukaryotes (99% PP; Fig. S61 in SI Appendix). The difficulties in determining a stable phylogenetic position for N. equitans, which is an obligate parasite with a highly reduced genome, have been reported (27). Combined data analyses showed some unconventional or controversial relationships among the eukaryotes, such as the placement of the microsporidian Encephalitozoon toward the base of the eukaryotes (e.g., Fig. 4 A and B) as opposed to its widely accepted relationship with the fungi (12). These results may be due in part to relatively short internal branches and long terminal branches within the eukaryotes, a pattern that can lead to the spurious attraction of unrelated taxa by a phenomenon called long-branch attraction (LBA) (28). This interpretation is supported by analyses of the eukaryote sequences alone, when more conventional relationships such as the Amoebozoa, Opisthokonts, and Plantae were all recovered (Fig. S62 in
SI Appendix). Despite the presence of apparent phylogenetic artifacts affecting the placement of particular eukaryotes in some analyses, we obtained no evidence that the grouping of the eocytes and eukaryotes is the result of LBA. Indeed, as noted (14, 17), it is the 3-domains tree that resembles a LBA artifact, whereby attraction between the long eubacterial and eukaryotic branches forces together the residual archaebacterial taxa, re-sulting in a misleading impression of archaebacterial monophyly. In our analyses, we only obtained the 3-domains tree with simpler models that are more sensitive to LBA (20, 29); the complex and better-fitting models consistently supported the eocyte tree.
Although we have modeled compositional heterogeneity in our analyses, we recognize that phylogenetic inference of ancient relationships is fraught with difficulty (30, 31), and that other substitution patterns in molecular data can also lead to incorrect trees when the model is misspecified. For example, a failure to adequately accommodate across-tree site-rate variation, also called covarion shifts, has been shown to cause LBA at the base of the eukaryotic tree (32). A covarion model was favored by Bayes factors over a homogeneous model for 11 proteins from our dataset, but it was favored over the optimal heterogeneous composition models for only 3 proteins (Table S3 inSI Appen-dix). Similarly, for the combined rRNA data a covarion model (Fig. S63 inSI Appendix) was favored over the homogeneous model (Fig. S52 in SI Appendix) but not over the optimal heterogeneous composition model (Fig. S55 in SI Appendix). This suggests that a covarion substitution pattern is evident for some genes and proteins, but it is typically not as strong a factor as heterogeneous composition patterns when modeling interdo-main relationships. Bayesian analyses of the combined protein dataset using a covarion model recovered the eocyte topology with maximal support (100% PP; Fig. S64 inSI Appendix).
Conclusions and Implications for Archaebacterial and Eukaryotic Evo-lution.Of the 51 proteins we analyzed (Table S2 inSI Appendix), 39 are involved in DNA replication, transcription, or translation and are the products of so-called ‘‘informational’’ genes (33). The remaining 12 proteins are involved in biosynthesis and metabolism and are the products of what have been called ‘‘operational’’ genes (33). Although many eukaryotic opera-tional genes are thought to have been gained by lateral gene transfer from either the mitochondrial endosymbiont or diverse other eubacteria (34, 35), the 12 operational genes included in this analysis showed no evidence of such interdomain transfers. Eukaryotic informational genes are widely held to have been
B
A
Fig. 3. Composition fit and Bayes factor comparisons for the combined rRNA data. (A) Bayesian model composition fit assessed by posterior predictive simulations. Bars show the posterior distribution of X2for the composition homogeneous MCMC ([GTR⫹⌫]X2) model and the composition heteroge-neous NDCH model ([GTR⫹⌫⫹2CV]X2) compared with the original data sta-tistic. The simulated data for the NCDH model include the statistic from the original data, whereas the simulated data from the homogenous model do not. (B) Marginal likelihoods of the 4 MCMC analyses. Bayes factor compari-sons between successive models are shown [2loge(BF): (marginal likelihood Model1/marginal likelihood Model0), marginal likelihoods were estimated as described in equation 16 in Newton and Raftery (22), i.e., the CAT model is favored by a 2loge(BF) of 3181.54 over the NDCH model, and both are favored over the homogeneous GTR model].
vertically inherited within the cell line (2–4, 36), because the encoded proteins perform highly integrated and fundamental tasks that makes their successful transfer less likely (2, 36). These genes have been called the ‘‘genealogy defining core’’ or ‘‘genetic core’’ of cells, and it has been claimed that their common history is congruent with the 3-domains tree (2–4). By contrast, we show here that analyses designed to overcome compositional hetero-geneity, something that is manifestly evident for these data, provide support for the eocyte tree, rather than the 3-domains tree.
It has been suggested (37) that archaebacterial monophyly is supported by the fragmentation in all archaebacteria of the gene (rpoA) for the largest subunit of RNA polymerase and the gene (gltB) for the large subunit of glutamate synthetase into 2 and 3 separate genes, respectively. Investigation of the conservation and stability of these characters among archaebacteria is hin-dered by the paucity of complete eocyte genomes. However, we note that a nonfragmented rpoA gene, like that found in eukaryotes, has now been found in the genomes of the eocytes
Cenarchaeum symbiosum (38) and Nitrosopumilis maritimus
(Joint Genome Institute, unpublished data; GenBank accession no. CP000866), and that the history of gltB is complicated by lineage specific loss among archaebacteria and by lateral gene transfers between archaebacteria and eubacteria (39).
The presence of membrane lipids in archaebacteria that are based on a sn-glycerol-1-phosphate backbone (G1P), rather than the sn-glycerol-3-phosphate backbone (G3P) found in eubacteria and eukaryotes, does appear to be a unifying
character for the group (40, 41). Most of the enzymes involved in the archaebacterial pathway are common to eubacteria and eukaryotes, but the enzyme [geranylgeranylglycerol phosphate (GGGP) synthase] determining the chirality of archaebacterial lipids (41) has not been detected in eukaryotes. Theories for eukaryote origins that are consistent with the eocyte tree, posit that eubacterial-like pathways replaced many of the ancestral archaebacterial pathways, including that for lipid biosynthesis, during eukaryogenesis (42).
The 3-domains (1) and eocyte (11) trees assume that the root is on the lineage immediately ancestral to extant eubacteria (Fig. 1), in accord with the results of published reciprocal rooting studies using ancient paralogous proteins (e.g., refs. 5 and 6). The position of the root of the universal tree is important because it provides polarity to the tree enabling hypotheses of monophyly and sister-group relationships to be determined. It has been suggested that the eubacterial root could be an artifact of phylogenetic reconstruction resulting from long-branch attrac-tion, or other sequence analysis artifacts (43–46). Because the published paralog-rooting studies used similar homogeneous phylogenetic models to those that we investigated here, it is possible that they suffered from the same poor fit to data that we observed. More recent studies have inferred a root by polarizing insertions and deletions in paralogous molecular sequences (44) or by polarizing other rare changes in molecular characters (47). These analyses concur in placing the root within the eubacteria, rather than on the ancestral lineage, but disagree on its precise position. Even if the root were subsequently shown to lie outside
B
A
Fig. 4. Phylogenetic analysis of 45 concatenated proteins. Scale bars indicate substitutions per site. The dotted branches leading to eubacteria are arbitrary lengths. Nodes highlighted with dots were supported byⱖ95% PP. The 2 values indicate support (PP) for the eocyte hypothesis. (A) Fifty percent majority-rule consensus tree of 10,000 trees sampled from the PP distribution of an MCMC with 14 across-tree composition vectors NDCH model (GTR⫹⌫⫹14CV) with Dayhoff-recoded data; loge(Lm)⫽ ⫺119349.62 -; X2original data⫽ 1,585.02; posterior predictive simulations of X2: mean⫽ 998.62, range ⫽ 612.27–1,472.57,
P⫽ 0.00. By contrast, in the homogeneous model simulations the X2test statistic ranged between 73.80 and 230.23 (mean⫽ 125.64), demonstrating that the NCDH model provides a much better fit to the original data. (B) Fifty percent majority-rule consensus tree of 1,275 trees sampled from the PP distribution of an MCMC with the CAT model (⫹⌫) with standard amino acid coded data; loge(Lm)⫽ ⫺252376.53, mode number of categories (k) ⫽ 200.86 (standard error ⫾ 9.5).
EVOLUTION
SEE
of the eubacteria, for example on the eukaryotic branch as some have suggested (46), the eocyte topology is still fundamentally incompatible with the 3-domains tree; because no rooting can rescue archaebacterial monophyly.
Our results impact on current theories for eukaryogenesis, because the origin of the eukaryotic ‘‘genetic machinery’’ has often been conflated with the origin of the eukaryotic nuclear lineage (2–4, 8). Thus, the 3-domains tree has been used to support hypotheses that posit that the nuclear line of descent is as ancient as the archaebacterial line (4) or that eukaryotes are a unique primordial lineage (48). The rooted 3-domains tree is also consistent with the neomuran hypothesis, whereby archae-bacteria and eukaryotes are posited to be sister groups derived from a eubacterial-derived neomuran common ancestor (37). By contrast, the eocyte tree favored by our analyses, and rooted on the eubacterial branch or among eubacteria (44, 47) is not consistent with any of these hypotheses, because it suggests that essential components of the eukaryotic cell originated from within an already diversified archaebacteria.
Materials and Methods
Taxon Selection and Sequence Alignment Generation. Forty taxa were selected as exemplars for the major taxonomic divisions within the 3 domains (see Table S1 inSI Appendix). Gene sequence alignments of small-ribosomal RNA (SSU) genes and large-ribosomal RNA (LSU) genes were manually constructed. The SSU alignment contained 39 taxa (excluding Phytophthora ramorum) and the LSU alignment 35 taxa (excluding P. ramorum, Pyrococcus furiosus, Leish-mania major, Thalassiosira pseudonana, and Cryptosporidium hominis). Pro-tein alignments were generated using a reciprocal BLAST procedure to iden-tify putatively homologous sequences from each proteome, using the data of the red algae Cyanidioschyzon merolae as the driver genome (see SI Text inSI Appendix). Single protein analyses that recovered⬍36 sequences of the target taxa were discarded. Sequences were aligned with Muscle (49) and analyzed with GBlocks (50) to define a preliminary exclusion set of ambigu-ously aligned sites. Exclusion sets were adjusted manually and alignments with ⬍60 sites were discarded. Locus alignments of DNA-dependent RNA Polymer-ase I, II, and III, both largest and second-largest subunits, the signal recognition particle receptor (alpha subunit), and the signal recognition particle recogni-tion component (SRP54) were constructed manually. Loci were analyzed individually with data coded in standard amino acid representation and recoded into Dayhoff groups (25). Dayhoff recoding defined the following 6 groups of amino acids corresponding to the point accepted mutation (PAM) matrix: 1: cysteine; 2: alanine, serine, threonine, proline, glycine; 3: aspara-gine, aspartic acid, glutamic acid, glutamine; 4: histidine, arginine, lysine; 5: methionine, isoleucine, leucine, valine; 6: phenylalanine, tyrosine, trypto-phan. For each protein alignment, neighbor-joining bootstrap analyses were conducted by using P4 and PAUP* with log-determinant distances of Dayhoff-recoded data. Proteins with easily identifiable cases of misdiagnosed homol-ogy and lateral gene transfer, as evidenced by nonmonophyly of either the eubacteria or eukaryota withⱖ 95% PP support were discarded. Two com-bined data alignments were constructed, the first consisting of the 2 rRNA genes and the second a concatenation of 45 proteins (see SI Text inSI Appendix). Constant sites were removed from the combined data analyses as these sites do not contribute to topological resolution, and their composition differs from the variable sites (P⬍ 10⫺4by a2test). Singletons were also removed because they exacerbate long terminal branches without distin-guishing among topologies. The 45 proteins (Table S2 inSI Appendix) that were combined exhibited no significant support (ⱖ95% PP) for interdomain LGT when individually analyzed with optimal composition modeling. In ad-dition, ancestral loci that had undergone duplication (or triplication) in the
eukaryotes were represented by a single paralog (i.e., DNA directed RNA polymerase largest and second largest subunits, 26S proteasome ATP-dependent regulatory subunits, and glutamate/glutamine-tRNA ligases). Missing taxa were represented as missing data in the combined alignments. Model Selection and Phylogenetic Analyses. Optimal substitution models and among-site rate heterogeneity parameters were selected by using the soft-ware ProtTest (51) for the amino acid data and MrModeltest (52) for the nucleotide data. Bayesian MCMC analyses were conducted by using the software MrBayes (ver. 3.1.2) (53), P4 (ver. 0.83– 0.84) (18), and Phylobayes (ver. 1.1c-2.1c) (20). Substitution models and among-site rate heterogeneity parameters used in the MCMC analyses of individual proteins were those found to be optimal in the model selection analyses. Homogeneous compo-sition analyses with the covarion parameter were conducted in MrBayes for 2,000,000 generations, with other settings as the program defaults. Optimal composition analyses were conducted in P4 with the inclusion of a polytomy prior, using a resolution class and a strong prior for polytomies (i.e., C⫽ loge 10). P4 analyses used the ‘‘autoTune’’ function that automatically tunes the parameter acceptance rates of the MCMC and the chains run for 1,200,000 generations with 3 additional heated parallel chains (Metropolis-coupling) (see SI Text inSI Appendixfor details). The base composition component of the model was determined by simulation of the base composition statistic X2(18), resulting in the posterior predictive distribution, against which the statistic of the original data could be tested by using tail-area probability. By successively adding additional base composition vectors to the MCMC analyses, base composition model adequacy was tested. Homogeneous composition analy-ses were conducted in P4 without the inclusion of the polytomy prior, so that they were directly comparable with homogeneous analyses in MrBayes with the inclusion of a covarion.
MCMC analyses of combined SSU and LSU data (1,048 characters) were conducted with separate substitution models and rate parameters for each partition as determined by the analyses of the individual genes, plus the polytomy prior, and a partition rate proposal parameter. The MCMC was tuned by using the ‘‘autoTune’’ method and run for 3,000,000 generations sampling every 100 generations. The entire analysis was repeated 3 times, and the best analysis chosen by observation of the harmonic mean of the likeli-hood scores from the PP distribution. ML bootstrap analyses were performed by using RAxML (54) with a partitioned dataset and 100 replicates under the GTRGAMMA model. Four analyses were run under the CAT⫹GTR model with 4 gamma-distributed rate categories for⬇13,500 between ⬇50,000–110,000 cycles.
Analyses of combined 45 proteins were performed by using P4 and em-ploying the polytomy prior, multiple composition vectors, the WAG substitu-tion model plus 4 gamma-distributed rate categories, and with a single MCMC (i.e., not Metropolis coupled). The data were analyzed in both standard amino acid coding (5,521 characters) and Dayhoff recoded (4,248 characters) formats (the latter with a GTR model plus 4 gamma-distributed rate categories and 4 chains) for 1,120,000 and 2,000,000 generations, respectively. Bayesian anal-yses with the covarion parameter were run by using MrBayes with 1 run and a single chain with a WAG substitution model and 4 gamma-distributed rate categories for 1,000,000 generations. ML bootstrap analyses were performed by using RAxML with 100 replicates under the PROTGAMMAWAGF model. Analyses were performed under the CAT model with 4 gamma-distributed rate categories and run for⬇32,000 cycles. Four parallel MCMC analyses were performed and assessed by calculating the harmonic mean of the likelihoods from posterior distributions. Similar analyses were performed by using the ‘‘dayhoff6’’ option of Phylobayes, and run for⬇10,000 cycles.
ACKNOWLEDGMENTS. We thank Dan Swan for administration of the New-castle University computing facilities. This work was supported by Biotech-nology and Biological Sciences Research Council (U.K.) Grants BB/C508777/1 and BB/C006143/1 (to P.G.F., R.P.H., and T.M.E.).
1. Woese CR, Kandler O, Wheelis ML (1990) Towards a natural system of organisms: Proposal for the domains Archaea, Bacteria, and Eucarya. Proc Natl Acad Sci USA 87:4576 – 4579.
2. Woese CR (2002) On the evolution of cells. Proc Natl Acad Sci USA 99:8742– 8747. 3. Harris JK, Kelley ST, Spiegelman GB, Pace NR (2003) The genetic core of the universal
ancestor. Genome Res 13:407– 412.
4. Pace NR (2006) Time for a change. Nature 441:289.
5. Baldauf SL, Palmer JD, Doolittle WF (1996) The root of the universal tree and the origin of eukaryotes based on elongation factor phylogeny. Proc Natl Acad Sci USA 15:7749 –7754. 6. Hashimoto T, Hasegawa M (1996) Origin and early evolution of eukaryotes inferred from the amino acid sequences of translation elongation factors 1alpha/Tu and 2/G.
Adv Biophys 32:73–120.
7. Lake JA, Henderson E, Oakes M, Clark MW (1984) Eocytes: A new ribosome structure indicates a kingdom with a close relationship to eukaryotes. Proc Natl Acad Sci USA 81:3786–3790. 8. Lake JA (1988) Origin of the eukaryotic nucleus determined by rate-invariant analysis
of rRNA sequences. Nature 331:184 –186.
9. Yang Z, Roberts D (1995) On the use of nucleic acid sequences to infer early branchings in the tree of life. Mol Biol Evol 12:451– 458.
10. Lake JA (1994) Reconstructing evolutionary trees from DNA and protein sequences: Paralinear distances. Proc Natl Acad Sci USA 91:1455–1459.
11. Rivera MC, Lake JA (1992) Evidence that eukaryotes and eocyte prokaryotes are immediate relatives. Science 257:74 –76.
12. Embley TM, Martin W (2006) Eukaryotic evolution, changes and challenges. Nature 440:623– 630.
13. Sidow A, Wilson AC (1990) Compositional statistics: An improvement of evolutionary parsimony and its application to deep branches in the tree of life. J Mol Evol 31:51– 68. 14. Tourasse NJ, Gouy M (1999) Accounting for evolutionary rate variation among se-quence sites consistently changes universal phylogenies deduced from rRNA and protein-coding genes. Mol Phylogenet Evol 13:159 –168.
15. Brown JR, Douady CJ, Italia MJ, Marshall WE, Stanhope MJ (2001) Universal trees based on large combined protein sequence data sets. Nat Genet 28:281–285.
16. Barns SM, Delwiche CF, Palmer JD, Pace NR (1996) Perspectives on archaeal diversity, thermophily and monophyly from environmental rRNA sequences. Proc Natl Acad Sci
USA 93:9188 –9193.
17. Katoh K, Kuma K, Miyata T (2001) Genetic algorithm-based maximum-likelihood analysis for molecular phylogeny. J Mol Evol 53:477– 484.
18. Foster PG (2004) Modeling compositional heterogeneity. Syst Biol 53:485– 495. 19. Lartillot N, Brinkmann H, Philippe H (2007) Suppression of long-branch attraction
artefacts in the animal phylogeny using a site-heterogeneous model. BMC Evol Biol 7(Suppl 1):S4.
20. Lartillot N, Philippe HA (2004) Bayesian mixture model for across-site heterogeneities in the amino-acid replacement process. Mol Biol Evol 21:1095–1109.
21. Bollback JP (2002) Bayesian model adequacy and choice in phylogenetics. Mol Biol Evol 19:1171–1180.
22. Newton MA, Raftery AE (1994) Approximate Bayesian inference with the weighted likelihood bootstrap. J R Stat Soc Ser B 56:3– 48.
23. Kass RE, Raftery AE (1995) Bayes factors. J Am Stat Assoc 90:773–795.
24. Yutin N, Makarova KS, Mekhedov SL, Wolf YI, Koonin EV (2008) The deep archaeal roots of eukaryotes. Mol Biol Evol 25:1619 –1630.
25. Hrdy I, et al. (2004) Trichomonas hydrogenosomes contain the NADH dehydrogenase module of mitochondrial complex I. Nature 432:618 – 622.
26. Susko E, Roger AJ (2007) On reduced amino acid alphabets for phylogenetic inference.
Mol Biol Evol 24:2139 –2150.
27. Brochier C, Gribaldo S, Zivanovic Y, Confalonieri F, Forterre P (2005) Nanoarchaea: Representatives of a novel archaeal phylum or a fast-evolving euryarchaeal lineage related to Thermococcales? Genome Biol 6:R42.
28. Delsuc F, Brinkmann H, Philippe H (2005) Phylogenomics and the reconstruction of the tree of life. Nat Rev Genet 6:361– 675.
29. Sullivan J, Swofford DL (1997) Are guinea pigs rodents? The importance of adequate models in molecular phylogenetics. J Mamm Evol 4:77– 86.
30. Penny D, McComish BJ, Charleston MA, Hendy MD (2001) Mathematical elegance with biochemical realism: The covarion model of molecular evolution. J Mol Evol 53:711–723. 31. Ho SY, Jermiin L (2004) Tracing the decay of the historical signal in biological sequence
data. Syst Biol 53:623– 637.
32. Inagaki Y, Susko E, Fast NM, Roger AJ (2004) Covarion shifts cause a long-branch attraction artifact that unites microsporidia and archaebacteria in EF-1alpha phylog-enies. Mol Biol Evol 21:1340 –1349.
33. Bult CJ, et al. (1996) Complete genome sequence of the methanogenic archaeon,
Methanococcus jannaschii. Science 273:1058 –1073.
34. Rivera MC, Jain R, Moore JE, Lake JA (1998) Genomic evidence for two functionally distinct gene classes. Proc Natl Acad Sci USA 95:6239 – 6244.
35. Esser C, et al. (2004) A genome phylogeny for mitochondria among alpha-proteobacteria and a predominantly eubacterial ancestry of yeast nuclear genes. Mol
Biol Evol 21:1643–1660.
36. Jain R, Rivera MC, Lake JA (1999) Horizontal gene transfer among genomes: The complexity hypothesis. Proc Natl Acad Sci USA 96:3801–3806.
37. Cavalier-Smith T (2002) The neomuran origin of archaebacteria, the negibacterial root of the universal tree and bacterial megaclassification. Int J Syst Evol Microbiol 52:7–76. 38. Hallam SJ, et al. (2006) Genomic analysis of the uncultivated marine crenarchaeote
Cenarchaeum symbiosum. Proc Natl Acad Sci USA 103:18296 –18301.
39. Nesbo CL, L’Haridon S, Stetter KO, Doolittle WF (2001) Phylogenetic analyses of two ‘‘archaeal’’ genes in Thermotoga maritima reveal multiple transfers between archaea and bacteria. Mol Biol Evol 18:362–375.
40. Boucher Y, Kamekura M, Doolittle WF (2004) Origins and evolution of isoprenoid lipid biosynthesis in archaea. Mol Microbiol 52:15–27.
41. Payandeh J, Pai EF (2007) Enzyme-driven speciation: Crystallizing Archaea via lipid capture. J Mol Evol 64:364 –374.
42. Martin W, Muller M (1998) The hydrogen hypothesis for the first eukaryote. Nature 392:37– 41.
43. Zhaxybayeva O, Lapierre P, Gogarten JP (2005) Ancient gene duplications and the root (s) of the tree of life. Protoplasma 227:53– 64.
44. Skophammer RG, Servin JA, Herbold CW, Lake JA (2007) Evidence for a Gram-positive, eubacterial root of the tree of life. Mol Biol Evol 24:1761–1768.
45. Brinkman H, Philippe H (1999) Archea sister group of bacteria? Indications from tree reconstruction artifacts in ancient phylogenies. Mol Biol Evol 16:817– 825. 46. Philippe H, Forterre P (1999) The rooting of the universal tree of life is not reliable. J Mol
Evol 49:509 –523.
47. Cavalier-Smith T (2006) Rooting the tree of life by transition analysis. Biol Dir 1:19. 48. Kurland CG, Collins LJ, Penny D (2006) Genomics and the irreducible nature of
eu-karyote cells. Science 312:1011–1014.
49. Edgar RC, (2004) MUSCLE: Multiple sequence alignment with high accuracy and high throughput. Nucleic Acids Res 32:1792–1797.
50. Castresana J (2000) Selection of conserved blocks from multiple alignments for their use in phylogenetic analysis. Mol Biol Evol 17:540 –552.
51. Abascal F, Zardoya R, Posada D (2005) ProtTest: Selection of best-fit models of protein evolution. Bioinformatics 21:2104 –2105.
52. Nylander JAA (2004) MrModeltest (Evolutionary Biology Centre, Uppsala University, Uppsala, Sweden), v2.
53. Ronquist R, Huelsenbeck JP (2001) MrBayes 3: Bayesian phylogenetic inference under mixed models. Bioinformatics 19:1572–1574.
54. Stamatakis A (2006) RAxML-VI-HPC: Maximum likelihood-based phylogenetic analyses with thousands of taxa and mixed models. Bioinformatics 22:2688 –2690.
EVOLUTION
SEE